 Open Access Article
3D dendritic-Fe2O3@C nanoparticles as an anode material for lithium ion batteries
Xiaohua Zhanga,
Zhongfu Zhou *bcd,
Jinyan Ninge,
Salma Nigara,
Tingkai Zhao
 f,
Xionggang Lub and
Huaqiang Caog
aSchool of Material Science and Engineering, Shanghai University, Shanghai 200444, PR China
bState Key Laboratory of Advanced Special Steel, Shanghai University, Shanghai 200072, PR China. E-mail: z.zhou@shu.edu.cn
cKey Laboratory of Material Microstructures, Shanghai University, Shanghai 200444, PR China
dDepartment of Physics, Aberystwyth University, Aberystwyth SY23 3BZ, UK
eMaterials Genome Institute, Shanghai University, Shanghai 200444, PR China
fState Key Laboratory of Solidification Processing, School of Materials Science and Engineering, Northwestern Polytechnical University, Xi'an 710072, PR China
gDepartment of Chemistry, Tsinghua University, Beijing 100084, PR China
First published on 27th March 2017
Abstract
3D dendritic Fe2O3 nanoparticles wrapped with carbon (denoted as 3DD-Fe2O3@C hereafter) were synthesized. It is found that the 3DD-Fe2O3@C is composed of α-Fe2O3 and amorphous carbon. As an anode material for lithium ion batteries (LIBs), it exhibits an excellent discharge/charge capacity (982 mA h g−1 and 971 mA h g−1 after 100 cycles at a rate of 100 mA g−1), and good cyclic stability and rate capability.
As energy storage devices, lithium-ion batteries (LIBs) have been widely used in portable electronic devices, mobile power stations, electrical automotive vehicles etc. Graphite as the most commonly used anode material in commercial LIBs, has a stable anode performance, but it is limited due to its low theoretical capacity (372 mA h g−1).1 Thus, developing alternative electrodes with high capacity has been one of the most urgent tasks in advancing the overall performance of LIBs.2,3 Among the available candidates, nanometre-sized transition metal oxides have been attracting research attention due to their low cost, wide availability, and especially higher theoretical specific capacities (>600 mA h g−1).4,5 Iron oxide, as an important member of these transition metal oxides, is regarded as a potential electrode material to replace graphite owing to its much higher theoretical capacity (∼1005 mA h g−1) than most other oxides, natural abundance and non-toxicity.6,7 However the poor electrical conductivity and large volume change during the lithiation/delithiation processes and subsequent pulverization of particles result in rapid cycling performance dropping, which severely encumbers its practical application.8 The widely used methods to overcome these drawbacks is to form a layer of conducting materials, such as carbon,9–12 graphene13–15 and conducting polymers,16 to wrap the oxide particles. These wrapping layers, can act as buffers which preventing the agglomeration of the nanomaterials and cushioning the volume changes during the lithiation/delithiation processes. Among these wrapping candidates, amorphous carbon is the most commonly used and it can be prepared easily. Amorphous carbon wrapped Fe2O3 nanocomposites have been regarded as potential anode materials for LIBs and studied.17,18 We demonstrate here, a special 3DD-Fe2O3@C nanostructured anode material can be synthesized via a simple route, it exhibits high capacity and cyclic performance. To date, there has been no work reported about the material with same structure as electrode for LIBs.
Experimental
Fe2O3 powder was prepared by a simple hydrothermal method: 0.11 g potassium ferrocyanide (K3[Fe(CN)6]), 3.8 g polyvinyl pyrrolidone (PVP) and 0.06 g hexadecyl trimethyl ammonium bromide (CTAB) were dissolved into 40 mL deionized water and then the solution was stirred for 30 min, and then was transferred to a 50 mL Teflon-lined stainless autoclave and maintained at 180 °C for 24 h in a rotary oven. The resulted red solid was collected by centrifugation, and then washed with deionized water and ethanol each for several times to remove the soluble impurities after the autoclave was cooled to room temperature naturally. Finally, the product was obtained by dehydrating at 50 °C in an oven overnight.To synthesize 3DD-Fe2O3@C, 0.05 g as-prepared Fe2O3 and 0.2 g glucose were dispersed into 16 mL deionized water. After ultrasonic treatment for 15 min, the solution was transferred into a Teflon-lined stainless autoclave for hydrothermal reaction at 180 °C for 4 h in rotary oven. After the autoclave cooled down, the sample was washed with deionized water and absolute ethanol, then was dried in air at 80 °C for 5 h. The 3DD-Fe2O3@C was obtained by calcining the above precipitate at 400 °C for 2 h in Ar atmosphere.
X-ray diffraction (XRD) patterns were collected on a 18 kW D/MAX2500V+/PC with Cu Kα radiation at a scan speed of 4° min−1. Scanning electron microscopy (FESEM) images were acquired on a JEOL JSM-6700F. Transmission electron microscopy images were taken on a JEOL JEM-2010F and a JEOL JEM-2100F. Thermogravimetric analysis (TGA) curve was measured on an MAX700 thermal analyzer.
Electrochemical properties were investigated using CR2032-type coin cells. The working electrode consists of 60% of the active material, 30% of conducting carbon black (Super-P-L), and 10% of polymer binder (polyvinylidene fluoride, PVDF). The electrolyte is 1.0 M LiPF6 in a mixture of ethylene carbonate, ethylmethyl carbonate and diethyl carbonate (EC/EMC/DMC, 1![[thin space (1/6-em)]](https://www.rsc.org/images/entities/char_2009.gif) :
:![[thin space (1/6-em)]](https://www.rsc.org/images/entities/char_2009.gif) 1
1![[thin space (1/6-em)]](https://www.rsc.org/images/entities/char_2009.gif) :
:![[thin space (1/6-em)]](https://www.rsc.org/images/entities/char_2009.gif) 1 vol). Celgard 2400 was used as the separator and lithium as the counter electrode. Coin-type cells were assembled in an argon-filled glove box (Super 1220/750). Charge–discharge tests were carried out at the voltage range of 0.05–3.0 V (vs. Li/Li+) using a battery test system (BTSDA).
1 vol). Celgard 2400 was used as the separator and lithium as the counter electrode. Coin-type cells were assembled in an argon-filled glove box (Super 1220/750). Charge–discharge tests were carried out at the voltage range of 0.05–3.0 V (vs. Li/Li+) using a battery test system (BTSDA).
Structure and morphology
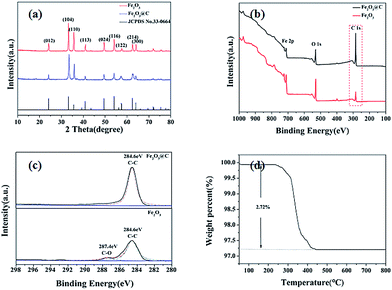
The as prepared sample is characterized by XRD. As shown in Fig. 1(a), the obtain Fe2O3 is the well crystallized rhombohedral phase of α-Fe2O3 (JCPDS no. 33-0664). Furthermore, it implies that the carbon coating treatment on the surface does not change the crystal structure of the sample. There is no distinguishable diffraction peaks associated with carbonaceous crystals found in the pattern, which indicates that the carbon shell is very likely in amorphous state.The XPS survey spectra of the Fe2O3 and 3DD-Fe2O3@C are shown in Fig. 1(b). The peaks of Fe, O and C are observed in both the uncoated and coated Fe2O3. Furthermore, the relative peak intensity of C 1s of the carbon coated sample is much stronger than that of the uncoated, this indicates the presence of carbon coating. As the atomic sensitivity factor of Fe is considerably higher than those of C and O, the relatively weak intensity of Fe and O in 3DD-Fe2O3@C suggest that there is a carbon layer coated on the surface of the 3DD-Fe2O3@C.19 Fig. 1(c) shows the C 1s of the Fe2O3 and the 3DD-Fe2O3@C samples respectively. We can see that there are only one strong peak centred at 284.6 eV in the 3DD-Fe2O3@C associated with C–C bonds. The C 1s spectrum of 3DD-Fe2O3 can be resolved into two peaks with binding energies of 284.6 eV and 287.4 eV which can be attributed to the adventitious carbon from the instrument. TGA analysis in Fig. 1(d) shows that the carbon content is about 2.72%.
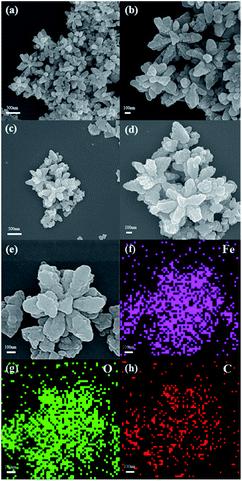
The morphology of the samples is investigated by SEM. As shown in Fig. 2. The sample show flower-like dendritic nano-crystalline structure with 6 rotational folds. The size of the particles is uniformly of 700–800 nm in diameter. It also can be seen that the size and morphology of dendritic structure are similar before and after the process of carbon coating. The elemental mapping results (Fig. 2(f)–(h)) demonstrate that the distribution patterns of iron and oxygen are coincide, and carbon is well distributed in the sample. This suggests that carbon has been coated onto the entire surface of Fe2O3 nanoparticles.
 | ||
| Fig. 2 SEM images of Fe2O3 (a and b); SEM images (c–e) and the EDS elemental mapping (f–h) of 3DD-Fe2O3@C. | ||
Electrochemical characterization
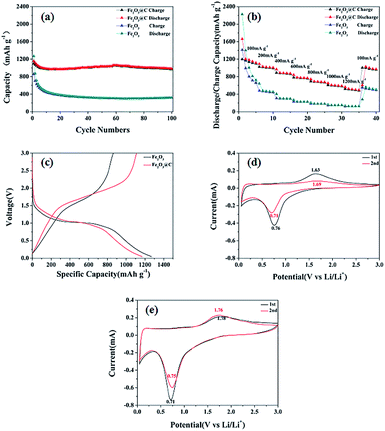
Electrochemical performance of the Fe2O3 and 3DD-Fe2O3@C samples has been investigated and is summarized in Fig. 3. Fig. 3(a) shows their charges capacities under current density of 100 mA g−1. It can be seen that the discharge and charge capacities of Fe2O3 are 2052 mA h g−1 and 1276 mA h g−1 respectively in the first cycle, but drop significantly to 320 mA h g−1 and 322 mA h g−1 after 100 cycles. In comparison, the discharge and charge capacities of 3DD-Fe2O3@C of the first cycle are 1528 mA h g−1 and 1053 mA h g−1, which are much lower than that of uncoated Fe2O3. However, after 100th cycle, the discharge and charge capacity of 3DD-Fe2O3@C can still remains at 982 mA h g−1 and 971 mA h g−1. The rate capacities of the samples are tested from 100 to 1200 mA g−1 (100, 200, 400, 600, 800, 1000 and 1200 mA g−1), the current densities for the 5th cycles are displayed in Fig. 3(b). 3DD-Fe2O3@C exhibits overall better rate performance against pure Fe2O3. The initial discharge capacity of 3DD-Fe2O3@C at 100 mA g−1 is 1119 mA h g−1. After the testing cycles, the specific capacity of 3DD-Fe2O3@C recovers to 972 mA h g−1 when the current density is returned to 100 mA g−1. Fig. 3(c) gives the first-cycle discharge/charge voltage profiles in the voltage window of 0.05–3.0 V. The first-cycle discharge/charge capacities of and the uncoated and coated Fe2O3 are 1270/862 mA h g−1 and 1169/1109 mA h g−1, which result in the coulombic efficiencies of 68% and 95%, respectively. The CV curves of the samples after the first cycle at 100 mA g−1 are presented in Fig. 3(d) and (e). The voltage window is 0.05–3 V and scan rate is set to 0.1 mV s−1. In Fig. 3(d), there is a cathodic peak centred at 0.76 V in the 1st scanning cycle, corresponding to the reduction of Fe2O3 with lithium ion to form Fe and Li2O, and the formation of solid electrolyte interphase layer on the surface of the electron. The main anodic peak at 1.63 V is attributed to the oxidation reaction of Fe to form Fe3+.19,20 In the 2nd cycle, the cathodic and anodic peaks are shifted due to the polarization in the first cycle. The redox peaks of the 3DD-Fe2O3@C in Fig. 3(e) at 0.71/1.78 V are close to those of the pure Fe2O3, but they show better repeatability. | ||
| Fig. 3 Cycle performances (a), rate capability (b), first-cycle discharge/charge voltage profiles (c) and CV curves of Fe2O3 (d) and 3DD-Fe2O3@C (e). | ||
Conclusions
A 3DD-Fe2O3@C LIB anode material has been successfully fabricated through a facile and easy scale-up two-step route. Compared with bare dendritic Fe2O3, the 3DD-Fe2O3@C exhibit an excellent overall performance. Its discharge/charge capacity can be well remained at 982 mA h g−1 and 971 mA h g−1 after 100 cycles at a rate of 100 mA g−1. The carbon coating increases significantly the cycling stability of Fe2O3. In view of the special structure and outstanding electrochemical performance, the 3DD-Fe2O3@C might serve as a potential electrode material for LIBs.Acknowledgements
This research was supported by NSFC (No. 51371112), Innovation Program of Shanghai Municipal Education Commission (No. 2014CB643403), and National Science Fund for Distinguished Young Scholars of China (No. 51225401). Z. Z. acknowledge the provision of characterization facility by Key Laboratory of Materials Microstructures, Shanghai University, under the visiting professorship scheme.Notes and references
- H. Buqa, D. Goers, M. Holzapfel, M. E. Spahr and P. Novak, J. Electrochem. Soc., 2005, 152, A474–A481 CrossRef CAS.
- M. Armand and J. M. Tarascon, Nature, 2008, 451, 652–657 CrossRef CAS PubMed.
- J. M. Tarascon and M. Armand, Nature, 2001, 414, 359–367 CrossRef CAS PubMed.
- Z. Li, B. Li, L. Yin and Y. Qi, ACS Appl. Mater. Interfaces, 2014, 6, 8098–8107 CAS.
- P. Poizot, S. Laruelle, S. Grugeon, L. Dupont and J. M. Tarascon, Nature, 2000, 407, 496–499 CrossRef CAS PubMed.
- H. Liu, G. Wang, J. Park, J. Wang, H. Liu and C. Zhang, Electrochim. Acta, 2009, 54, 1733–1736 CrossRef CAS.
- W. Xiao, Z. Wang, H. Guo, Y. Zhang, Q. Zhang and L. Gan, J. Alloys Compd., 2013, 560, 208–214 CrossRef CAS.
- C. K. Chan, H. Peng, G. Liu, K. McIlwrath, X. F. Zhang, R. A. Huggins and Y. Cui, Nat. Nanotechnol., 2008, 3, 31–35 CrossRef CAS PubMed.
- Z. Li, N. Liu, X. Wang, C. Wang, Y. Qi and L. Yin, J. Mater. Chem., 2012, 22, 16640 RSC.
- C. Wang, L. Yin, D. Xiang and Y. Qi, ACS Appl. Mater. Interfaces, 2012, 4, 1636–1642 CAS.
- W.-M. Zhang, X.-L. Wu, J.-S. Hu, Y.-G. Guo and L.-J. Wan, Adv. Funct. Mater., 2008, 18, 3941–3946 CrossRef CAS.
- J. Liu, D. Qian, H. Feng, J. Li, J. Jiang, S. Peng and Y. Liu, J. Mater. Chem. A, 2014, 2, 11372 CAS.
- H. Wang, L. F. Cui, Y. Yang, H. Sanchez Casalongue, J. T. Robinson, Y. Liang, Y. Cui and H. Dai, J. Am. Chem. Soc., 2010, 132, 13978–13980 CrossRef CAS PubMed.
- S. Yang, X. Feng, S. Ivanovici and K. Mullen, Angew. Chem., 2010, 49, 8408–8411 CrossRef CAS PubMed.
- J. Liu, J. Jiang, D. Qian, G. Tan, S. Peng, H. Yuan, D. Luo, Q. Wang and Y. Liu, RSC Adv., 2013, 3, 15457 RSC.
- F. Wu, J. Chen, R. Chen, S. Wu, L. Li, S. Chen and T. Zhao, J. Phys. Chem. C, 2011, 115, 6057–6063 CAS.
- C. Wu, X. Li, W. Li, B. Li, Y. Wang, Y. Wang, M. Xu and L. Xing, J. Power Sources, 2014, 251, 85–91 CrossRef CAS.
- F. Qin, K. Zhang, L. Zhang, J. Li, H. Lu, Y. Lai, Z. Zhang, Y. Zhou, Y. Li and J. Fang, Dalton Trans., 2015, 44, 2150–2156 RSC.
- J. Wang, M. Gao, H. Pan, Y. Liu, Z. Zhang, J. Li, Q. Su, G. Du, M. Zhu, L. Ouyang, C. Shang and Z. Guo, J. Mater. Chem. A, 2015, 3, 14178–14187 CAS.
- N. Liu, J. Shen and D. Liu, Electrochim. Acta, 2013, 97, 271–277 CrossRef CAS.
| This journal is © The Royal Society of Chemistry 2017 |

