 Open Access Article
Creative Commons Attribution 3.0 Unported Licence
Efficient and stable ZrO2/Fe modified hollow-C3N4 for photodegradation of the herbicide MTSM†
Tahir Muhmood *,
Mingzhu Xia,
Wu Lei,
Fengyun Wang
 * and
Muhammad Asim Khan
School of Chemical Engineering, Nanjing University of Science and Technology, Nanjing 210094, Jiangsu, P. R. China. E-mail: wangfy@njust.edu.cn; muhmoodtahir@njust.edu.cn
First published on 16th January 2017
Abstract
Hollow graphitic carbon nitride (HCN) ZrO2/g-C3N4 hybrid composites (HCN–ZR) and the target catalyst Fe/ZrO2/g-C3N4 (HCN–FZR) were prepared successfully by a solvo-thermal method and evaluated for photo-degradation of organic pollutants, i.e. MO, and herbicides, metsulfuron methyl (MTSM). These materials were characterized by a variety of techniques, including Fourier transform infrared spectroscopy, UV-vis spectroscopy, X-ray diffraction, X-ray photoelectron spectroscopy, transmission electron microscopy, HPLC-MS and scanning electron microscopy. The characterization and degradation results showed that FZR particles are well distributed on the surface of HCN to give a photo-catalytically active material. Photodegradation split MTSM completely into a lot of intermediate products, as depicted in the HPLC-MS results. Mooring of FZR on HCN increased the surface-area and light absorption capability of HCN–FZR, due to heterojunction formation between the semiconductors, which retarded electron–hole recombination and enhanced the photo-activity.
1. Introduction
Visible light driven photo-catalysts have become more attractive and are widely used in environmental protection to degrade harmful chemicals.1 Different kinds of metal oxides, including TiO2, ZnO and ZrO2 in pure and doped forms,2 as well as expensive precious metals3 and metal sulfides,4 have been prepared and characterized for photodegradation of different agents. Semiconductor photo-catalysis is an emerging oxidation method for the degradation of organic pollutants owning to its several advantages, such as the fixed specific reaction environment on the photo-catalyst surface in which several organic and inorganic species can be chemically altered in the presence of light.5,6 Graphitic carbon nitride (g-C3N4) has attracted great attention for making valuable stable photo-catalysts for hydrogen production and the degradation of organic pollutants.7–10 It also has high thermal stability, chemical stability and a very good response to visible light.11,12 Several methods have been used for the preparation of C3N4 with different properties, including solvo-thermal methods, iono-thermal methods, CVD (chemical vapour deposition), solid state methods, sono-chemical reactions and thermal condensation.7,13 For the further enhancement of the photocatalytic ability of g-C3N4, various methods have been used, such as metal deposition, nanostructure improvements, and generation of hetero-structures and complex structures. g-C3N4 can form hetero-structures and complex structures with semiconductor materials that have a high band gap (such as CdS, Bi2WO3, and BiOI), but can also be combined with semiconductor materials that have low band gaps (such as TiO2, ZnO, and ZnWO4).14,15 Different metal oxides, when combined with g-C3N4, can enhance electron–hole (e−/h+) separation by increasing the absorption in the visible region.16–18 g-C3N4 also has disadvantages, such as a small surface area and mild quantum efficiency,19,20 both of which are indicators of low photo-catalytic activity. Therefore, more research is needed to study the enhancement of g-C3N4 photo-catalytic activity. Hollow sphere mesoporous g-C3N4 has been reported, prepared by using porous silica spheres21 or by an assembly method.22 Hollow C3N4nano-spheres have important value, because they can act as a platform for complex nanostructures.23 g-C3N4 can be prepared using a solvo-thermal technique under a controlled temperature, and its morphology can be easily controlled.24,25 Zirconium dioxide (ZrO2) is very important in ceramic technology26,27 and is also used in heterogeneous catalysis.28,29 Previous studies have also confirmed that iron particles have great importance in catalysis.30,31 Iron particles have attracted more attention over the last few decades32 because they have high catalysis potential.33,34 Iron catalysts have higher rates of degradation of organic compounds such as ethyl-benzene, benzyl alcohol and cyclohexene.35 Many important chemical reactions, such as oxidation and synthesis of alcohols, use zirconia instead of using other catalysts.36,37 Zirconia is suitable for doping with iron due to its acidic properties, good surface properties and favorable activity as compared to other corresponding metal oxides.37,38 A previous study showed that the doping of Fe atoms into ZrO2 gave a stable tetragonal and cubic structure.39 In this article, we report, for the first time, a hybrid material synthesized from hollow g-C3N4. Many research articles have already reported hybrid materials containing g-C3N4, but we successfully prepared a hybrid composite of hollow g-C3N4 by a solvo-thermal method for the first time. The special hollow template-free graphitic carbon nitride particles were synthesized, and then doped with a specific ratio of zirconia or iron/zirconia by a solvo-thermal method. Our prepared HCN–ZR and HCN–FZR composites have larger surface areas with higher visible light absorption abilities and more photo-induced carriers due to the presence of HCN. These properties make HCN–FZR a good photo-catalyst. The photo-catalytic degradation behaviour of HCN, HCN–ZR and HCN–FZR was analysed against MTSM. The prepared photo-catalysts were also recycled for reuse, and we concluded that our target photo-catalyst possesses very good stability.2. Experimental work
2.1. Materials
All of the chemicals used in this study were of analytical grade and were used without further treatment. Acetonitrile, 2,4,6-trichloro-1,3,5-triazine, dicyandiamide, ammonia, iron(III) nitrate nonahydrate methyl orange and rhodamine ethanol were purchased from Sigma Aldrich Chemical Cooperation. Silver nitrate and zirconyl chloride octahydrate were purchased from Merck.2.2. Preparation of photo-catalyst
2.3. Characterization
Powder X-ray diffraction (XRD) patterns of the samples were collected using a Bruker D8 X-ray diffractometer. The morphology of the samples was examined by transmission electron microscopy (TEM-JEM-2010) and scanning electron microscopy (SEM-JEOL JSM-6380LV). The photo-catalytic activities of the samples were measured in the visible region using a xenon arc lamp (XBO, 500 W) with the help of a BL-GHX-1D photochemical reactor (Shanghai Bilon Instrument Co. Ltd.). A UV-vis spectrophotometer (Thermo Fisher EV220, USA) was used to analyse the performance of the photo-catalysts in the degradation of methyl orange and MTSM. To determine the pathway of complete MTSM degradation, a Finnigan TSQ Quantum ultra AM mass spectrometer (USA, Thermo Fisher) was used. Fourier transform infrared spectra (FT-IR) were recorded by a FTIR-spectrophotometer (Thermo Fisher, Nicolet-iS10, FT-IR Spectrometer, USA). X-ray photoelectron spectroscopy (XPS) measurements were performed using a PHI Quantera II spectrometer, with Al Kα (1486.6 eV) radiation. The Brunauer–Emmett–Teller (BET) specific surface area of the samples was determined using nitrogen adsorption–desorption isotherm measurements at 77 K (NOVA 2200e).2.4. Photo-catalytic reaction
The photo-catalytic activity of the prepared photo-catalysts was analysed using the degradation of MTSM in the presence of visible light. The photocatalytic runs were done in a cylindrical Pyrex glass cell that was put in a photochemical reactor (BL-GHX-1D, SBI. Co. Ltd.) (Fig. S3†). In each experiment, 15 mg of the prepared photo-catalysts were dispersed in 60 ml of freshly prepared MTSM solution (60 ml, 20 mg l−1). The photocatalytic activity was then checked by irradiating the solutions using a xenon arc lamp (XBO, 500 W) (Fig. S6†) with a cut-off filter to control the wavelength of light irradiation (visible light 420–720 nm) and a cooling water system (keeping the temperature at 24 °C). The distance between the reaction tube and the lamp was 5 cm. Before the irradiation, the suspension was magnetically stirred in the dark for 30 minutes to reach adsorption–desorption equilibrium. Then the xenon lamp was turned on, and 2 ml of the suspension was taken out from each quartz reactor at intervals of 10 min and centrifuged (11![[thin space (1/6-em)]](https://www.rsc.org/images/entities/char_2009.gif) 500 rpm for 12 min) to collect the photo-catalyst. The clear solution was analysed at the maximum absorption wavelength (233 nm for MTSM, Fig. S1†) by using a UV-visible spectrophotometer (Thermo Fisher EV220 USA). A quantity of scavengers was added into the MTSM solution prior to the addition of the photo-catalyst. The scavenger concentration (0.01 mol l−1) was controlled according to previous studies.41,42 For reference, the prepared photocatalysts were also analysed for the degradation of MO, and showed very good results.
500 rpm for 12 min) to collect the photo-catalyst. The clear solution was analysed at the maximum absorption wavelength (233 nm for MTSM, Fig. S1†) by using a UV-visible spectrophotometer (Thermo Fisher EV220 USA). A quantity of scavengers was added into the MTSM solution prior to the addition of the photo-catalyst. The scavenger concentration (0.01 mol l−1) was controlled according to previous studies.41,42 For reference, the prepared photocatalysts were also analysed for the degradation of MO, and showed very good results.
3. Results and discussion
3.1. Characterization
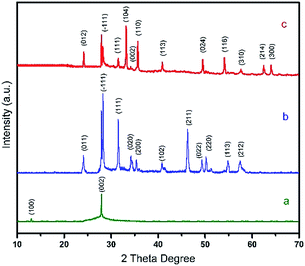
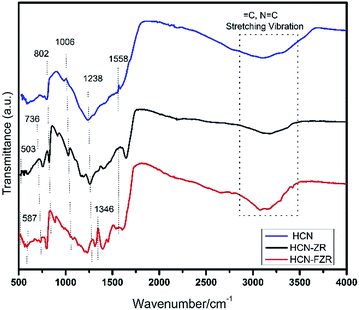
XRD patterns (Fig. 1) indicate that a graphitic-like structure exists in the HCN sample (JPCDS no. 87-1526). The highest intensity single peak at 27.3° is a characteristic (002) peak attributed to inter-layer stacking reflections of graphitic material, and the other (100) peak at 13° is assigned to heptazine g-CN.43 Fig. 1 shows the XRD patterns of HCN–ZR and HCN–FZR. Various peaks appear in the range of 10° and 70° confirming the crystallinity of the synthesised samples. Fig. 1b shows the characteristic peaks of ZrO2 observed at 2θ = 24.07, 28.20, 31.48, 34.41, 35.32, 41.18, 45.54, 49.29, 50.13, 55.40, and 57.16 with miller indices of (011), (−111), (111), (020), (200), (102), (211), (022), (220), (113), and (212), which are in agreement with JPCDS card no. 00-024-1165 for the monoclinic (ZrO2) phase of zirconia. Fig. 1c shows the XRD pattern of HCN–FZR. Hollow g-C3N4, ZrO2 and Fe (in the form of rhombohedra) can be clearly observed in the XRD pattern of the HCN–FZR. Specifically, peaks at 2θ = 24.15, 33.16, 35.64, 40.87, 49.47, 54.08, 62.454, and 64.01 are attributed to (012), (104), (110), (113), (024), (116), (214), and (300), respectively, and arise from the rhombohedral phase of Fe2O3 (JCPDF no. 01-079-1741).The other peaks (Fig. 1c) at 2θ = 28.19, 31.46, 34.14, and 57.14 with miller indices of (−111), (111), (002), and (310) (JPCDS: 01-078-0047) represent monoclinic ZrO2. The intensive peak at 27.3° exists in the XRD patterns of both HCN–ZR and HCN–FZR, which confirmed the presence of g-C3N4 in the prepared samples. Fig. S2† shows the ZR and FZR XRD patterns. FTIR spectra of HCN are shown in Fig. 2. The broad bands around 3108 cm−1 indicate N![[double bond, length as m-dash]](https://www.rsc.org/images/entities/char_e001.gif) C ring stretching vibrations. The peak at 1238 cm−1 represents C–N stretching. The peaks at 1558 cm−1 and 1006 cm−1 represent C
C ring stretching vibrations. The peak at 1238 cm−1 represents C–N stretching. The peaks at 1558 cm−1 and 1006 cm−1 represent C![[double bond, length as m-dash]](https://www.rsc.org/images/entities/char_e001.gif) N stretching vibrations. The peak at 802 cm−1 is related to s-triazine ring vibrations. These characteristic peaks show that HCN was successfully obtained.44 The bands at 503 cm−1 and 736 cm−1 (Fig. 2) correspond to various vibrations of the Zr–O bond. The band at 1238 cm−1 represents C–N stretching and that at 1006 cm−1 represents C–N–C stretching vibrations. The peak at 802 cm−1, related to the s-triazine, indicates the presence of g-C3N4 with ZrO2 in HCN–ZR. In the HCN–FZR spectrum in Fig. 2, the major peak at 3079 cm−1 represents ring
N stretching vibrations. The peak at 802 cm−1 is related to s-triazine ring vibrations. These characteristic peaks show that HCN was successfully obtained.44 The bands at 503 cm−1 and 736 cm−1 (Fig. 2) correspond to various vibrations of the Zr–O bond. The band at 1238 cm−1 represents C–N stretching and that at 1006 cm−1 represents C–N–C stretching vibrations. The peak at 802 cm−1, related to the s-triazine, indicates the presence of g-C3N4 with ZrO2 in HCN–ZR. In the HCN–FZR spectrum in Fig. 2, the major peak at 3079 cm−1 represents ring ![[double bond, length as m-dash]](https://www.rsc.org/images/entities/char_e001.gif) C stretching vibrations, and the peak at 1346 cm−1 represents ring stretching vibrations. The peak at 802 cm−1 indicates s-triazine. The band between 508 cm−1 and 518 cm−1 represents the Zr–O bond. The peak at 587 cm−1 is related to the Fe–O group of γ-Fe2O3. The characteristic FTIR data shows that the target material was successfully obtained. The EDX spectrum (Fig. S4†) indicated and confirmed the presence of all of the elements in the prepared samples. The spectrum in Fig. S2A† shows the presence of carbon and nitrogen, and confirmed the graphitic carbon nitride structure composition.
C stretching vibrations, and the peak at 1346 cm−1 represents ring stretching vibrations. The peak at 802 cm−1 indicates s-triazine. The band between 508 cm−1 and 518 cm−1 represents the Zr–O bond. The peak at 587 cm−1 is related to the Fe–O group of γ-Fe2O3. The characteristic FTIR data shows that the target material was successfully obtained. The EDX spectrum (Fig. S4†) indicated and confirmed the presence of all of the elements in the prepared samples. The spectrum in Fig. S2A† shows the presence of carbon and nitrogen, and confirmed the graphitic carbon nitride structure composition.
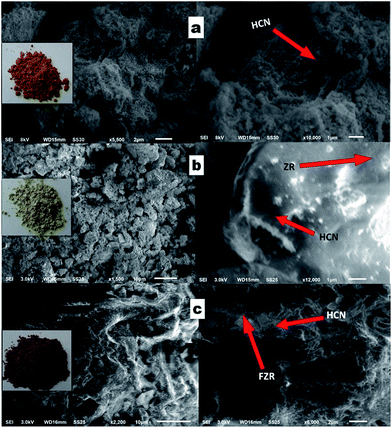
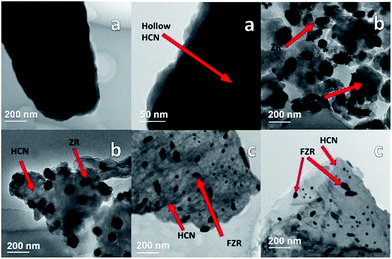
The morphology of the HCN sample was investigated by SEM analysis. A clear picture of g-C3N4 is shown in Fig. 3a. We can see a hollow template-free morphology, without a smooth surface and in the form of a sheet-like structure. The spectrum in Fig. S2b† shows the presence of all of the elements in ZR, and Fig. 3b shows the morphology of HCN–ZR by SEM analysis. The SEM image shows that the g-C3N4 does not have a smooth surface, and that the ZrO2 forms spindle nanoparticles with an average particle size of 50–70 nm (Fig. 3b), which leads to the high surface area of the sample. It can be perceived that the ZrO2 particles are coated on the surface of HCN in the composites (Fig. 3b and c). The EDX spectrum in Fig. S4† confirmed the elemental composition of HCN–FZR, and Fig. 3c shows the morphology of HCN–FZR. The surface of HCN–FZR is not smooth looking and contains grooves, and the morphology of this sample is different as compared to the pure g-C3N4 and HCN–ZR samples. The TEM image of HCN (Fig. 4a) shows that it presents an irregular sheet structure without a smooth surface. The TEM image (Fig. 4b) analysis of the ZR hybrid structure shows that small dark particles are dispersed on the HCN, which are ZrO2 particles and appear darker due to the heavier atoms.45 The particle size of the ZrO2 is between 100 nm and 150 nm. The TEM image of HCN–FZR (Fig. 4c) confirms the presence of Fe nanoparticles with ZrO2 on the surface of g-C3N4. The Fe particle size is smaller as compared to the ZrO2 particles. The average atomic number and density of Fe is higher than the ZrO2 atomic number and density, thus the ZrO2 regions appear bigger and brighter in the TEM images (Fig. 4c) than the Fe regions. Nitrogen sorption–desorption analysis showed that the specific surface areas of HCN–FZR and HCN–ZR are higher, 80 m2 g−1 and 56 m2 g−1 respectively, as compared to HCN (18 m2 g−1). The surface area of HCN is also much larger than that of bulk g-C3N4.46,47 The number of possible reactive sites for adsorbing sufficient reactant molecules is increased due to the larger surface area, which promotes the surface carrier transfer of photo-catalytic reactions.48 XPS spectra (Fig. 5) were used to determine the valance states and chemical environments of the catalysts. The XPS spectra (Fig. 5) show that the main elements in the prepared photo-catalysts are C and N. The C 1s peak (Fig. 5b) can be deconvoluted into two peaks, which shows that two different carbon environments exist in these photo-catalysts. HCN, HCN–ZR and HCN–FZR showed a peak at about 284 eV, which is assigned to sp2 C–C bonds, and another strong peak is identified,49 which is assigned to sp2 bonded carbon with nitrogen in an aromatic ring.50 Meanwhile the addition of ZrO2 and Fe/ZrO2 affects the binding energy of C 1s of HCN. The C 1s binding energy of HCN–ZR and HCN–FZR shifts from 287.19 eV to 287.18 eV.51,52 In the N 1s spectrum in Fig. 5C, the peak at the binding energy of 397 eV is attributed to nitrogen atoms in C–N–C groups, and that at a binding energy of 400 eV can be attributed to –NH2 or ![[double bond, length as m-dash]](https://www.rsc.org/images/entities/char_e001.gif) NH groups.49 The peaks (Fig. 5d) at 529 eV and 530 eV are characteristic of Zr–O in ZrO2 (HCN–ZR, HCN–FZR). As shown in Fig. 5e, a 3d doublet is located at 181.0 eV and 184.4 eV, which represents Zr 3d5/2 and 3d3/2 of ZrO2 respectively.53 Fe 2p orbital peaks in Fig. 5f indicate that Fe is not in the metallic state in HCN–FZR.54,55
NH groups.49 The peaks (Fig. 5d) at 529 eV and 530 eV are characteristic of Zr–O in ZrO2 (HCN–ZR, HCN–FZR). As shown in Fig. 5e, a 3d doublet is located at 181.0 eV and 184.4 eV, which represents Zr 3d5/2 and 3d3/2 of ZrO2 respectively.53 Fe 2p orbital peaks in Fig. 5f indicate that Fe is not in the metallic state in HCN–FZR.54,55
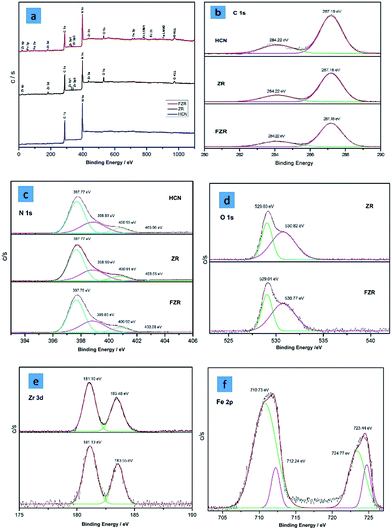 | ||
| Fig. 5 XPS spectra of (a) HCN, HCN–ZR, and HCN–FZR; (b) C 1s, (c) N 1s, (d) O 1s, (e) Zr 3d, and (f) Fe 2p. | ||
The Fe 2p orbital can be deconvoluted into four peaks. The peak centred at 710.73 eV could be attributed to Fe 2p3/2, and the peak centred at 724.77 eV is attributed to Fe 2p3/2 (ref. 56), indicating the presence of Fe in the target photo-catalyst HCN–FZR.
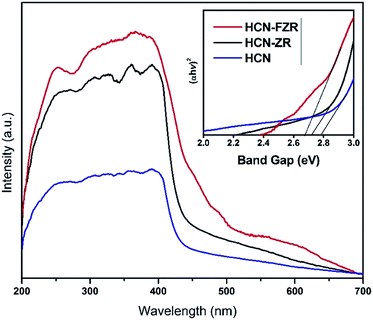
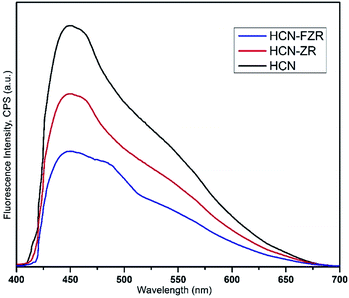
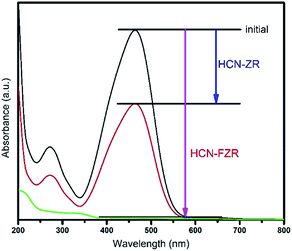
The optical properties of HCN, HCN–ZR and HCN–FZR were measured by UV-vis DRS analysis. The UV-vis DRS spectra (diffuse-reflection mode) of the samples are shown in Fig. 6. The absorption edge of HCN starts at about 425 nm and ends at 200 nm. The absorption range for HCN–ZR is larger compared to pure HCN, and the absorption intensity is also doubled. The UV-vis absorption graph shows that the absorption range for HCN–FZR is extended as compared to the other samples. HCN–FZR shows a very good absorption range that starts at 700 nm and ends at 200 nm. The HCN–FZR absorption range shows that it can almost absorb the entire visible light region. The intensity of HCN–FZR is also higher than that of the other samples. The HCN–FZR composite shows superior photo-absorption compared to HCN–ZR and HCN, which might be due to the interaction between Fe, ZrO2 and HCN. Chemical bonds between the two semiconductors might help to improve the optical properties, as is the case in N-modified ZrO2 (ref. 57) and g-C3N3–TiO2 (ref. 58 and 59) photo-catalysts. The presence of ZrO2 and Fe provides HCN–FZR with light absorption ability. DRS results indicate that HCN–ZR and HCN–FZR should also possess visible light photo-catalytic ability. ZrO2 can only absorb shorter wavelength light (<247 nm) and possesses a band gap energy of 5.02 eV. For HCN the absorbance edge is 453 nm and the band gap energy is 2.79 eV.8,60 The HCN–FZR composite shows better photo-absorption (band gap 2.68 eV) than HCN, which might be due to the interaction between FZR and HCN. HCN–ZR possesses a band gap energy of 2.72 eV. Chemical bonds between these semiconductors might result in the enhancement of the optical properties, similar to N-doped ZrO2 (ref. 57) and graphene doped TiO2 catalysts.59 DRS results indicate that HCN–ZR and HCN–FZR possess visible light photocatalytic ability.61 The effect of the formed HCN–ZR and HCN–FZR heterojunctions on the separation efficiency of transfer, migration and recombination of photo-generated electron–hole pairs was investigated using photoluminescence (PL) spectra. A strong emission peak in the PL spectrum (Fig. 7) at 453 nm is observed for HCN, which can be attributed to the band gap transition emission energy, approximately equal to the band-gap energy of g-C3N4. In the PL spectra of HCN–ZR and HCN–FZR, quenching in the same position is detected, indicating that the addition of ZrO2 and Fe meaningfully inhibited the recombination of electrons and holes.62
This fact indicates the interaction between HCN and Fe/ZrO2. The emission peak intensity of the HCN–FZR photo-catalyst decreases, which suggests that HCN–FZR has a lower recombination rate of photo-generated charge carriers than the HCN and HCN–ZR catalysts. This efficient electron transfer indicates that the HCN–FZR catalyst is very effective in electron hole pair separation, which leads to enhancement of the photo-activity of the HCN–FZR photo-catalyst.
The nitrogen adsorption–desorption isotherm plots of HCN–FZR and HCN are shown in Fig. S7.† In the P/Po range, a H3 hysteresis loop can be observed which indicates a type-IV adsorption–desorption isotherm.63,64 The BET surface area was calculated from the isotherm, and the surface area of HCN–FZR is about 87.6 m2 g−1, while that of HCN is 62.3 m2 g−1. The large surface area provides more reactive sites, which are available for the reactants and are helpful for photocatalytic degradation.
3.2. Photo-catalytic performances
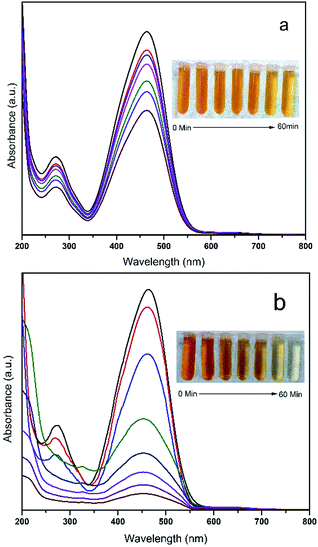
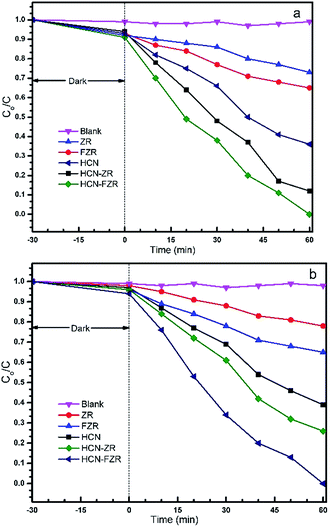
The photo-catalytic activities of the HCN, HCN–FZR and HCN–ZR photo-catalysts were investigated in the degradation of MTSM (Fig. 9a). For reference and for verification, the photodegradation ability of the prepared photo-catalysts was also tested in the degradation of methyl orange. Fig. 9a shows the degradation of MTSM by different catalysts, for a comparative study with our target photocatalyst (HCN–FZR). HCN–FZR showed good results in a short duration of time for degradation of MTSM. The other catalyst also showed degradation ability, but this was very low compared to the target catalyst. A blank test (Fig. 9a) with MTSM indicated that degradation of MTSM did not occur in the presence of light without the addition of any prepared catalyst. Fig. 8 shows the visible light photo-catalytic activities of the prepared photo-catalysts in the degradation of MO. Fig. 8a indicates that the degradation of MO occurs very slowly. As can be seen (Fig. 9b), in the blank test for MO, degradation hardly occurred under visible light without adding any photo-catalysts, indicating that the effect of MO self-degradation is inappreciable. The absorbance spectrum with HCN–ZR (Fig. 8a) showed that degradation of MO did occur, but the difference between the initial absorbance value and the absorbance value after 60 minutes is very small, indicating that the degradation rate of MO by HCN–ZR is very low. From Fig. 9, it can also be concluded that the degradation rate of MO by HCN–FZR is higher as compared to the other prepared catalysts. HCN–FZR possesses a high degradation rate due to the presence of HCN and FZR. HCN also possesses a high degradation rate compared to ZR and FZR. In Fig. 10a a comparison between HCN–ZR and HCN–FZR is conducted, which indicates the degradation ability of HCN–ZR versus HCN–FZR.We concluded that the degradation ability of HCN–FZR under visible light irradiation, in a short time duration, is higher than that of HCN–ZR. HCN–FZR has efficient degradation ability against MO. This indicates that the photo-catalytic activity increases due to the Fe in the HCN–FZR. The degradation rate with HCN–FZR is higher compared to that with HCN–ZR due to the incorporation of Fe(III), which acts as an electron–hole trapping centre.
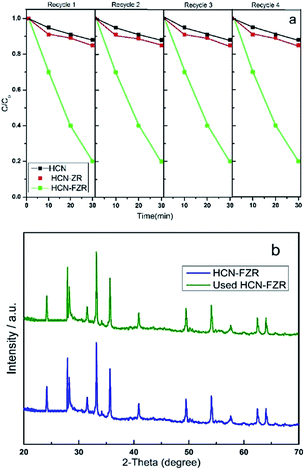
The HCN–FZR photocatalytic property enhancement is due to the presence of hollow-C3N4 and Fe. HCN–FZR almost has a five times higher degradation rate of MO as compared to the other catalysts (Fig. 9). To evaluate the stability of the photo-catalysts, after the photo-catalytic reaction, the photo-catalysts were collected by centrifugation, washed and dried for recycling tests. The photo-degradation efficiency (Fig. 11a) of HCN–FZR decreases only slightly over four cycles, which indicates that HCN–FZR can be reused completely.
The XRD pattern (Fig. 11b) of the used HCN–FZR shows similar peaks as compared to the fresh HCN–FZR. According to all of the above observations, the HCN–FZR photo-catalyst is a high efficiency and stable composite for visible light photo-catalytic degradation.
3.3. The intermediates and pathways of MTSM photodegradation
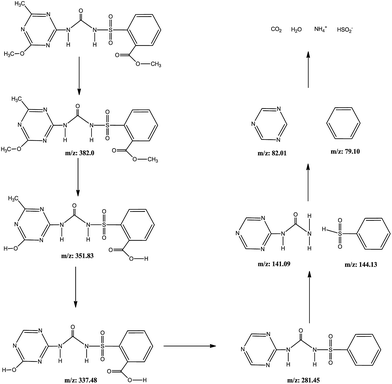
The intermediates and pathways of MTSM photodegradation under visible light were analysed by HPLC-MS. The HPLC-MS chromatograms are displayed in Fig. S5.† It can be seen that the protonated MTSM molecule ion with m/z = 382 was found.65 With increasing the reaction time, ions with m/z = 351 and m/z = 337 were identified, which was due to the loss of a methyl group.66 When the reaction time increased further, an ion with m/z = 281 was found due to the loss of hydroxyl and carboxyl groups.67 After 60 minutes, a lot of intermediates were found in the chromatograms, and the deprotonated MTSM ion with m/z = 382 had completely disappeared. The results show that MTSM was degraded into small molecules and some intermediates. The detailed photodegradation process of MTSM is described in Fig. 12.3.4. Proposed photo-catalytic mechanism
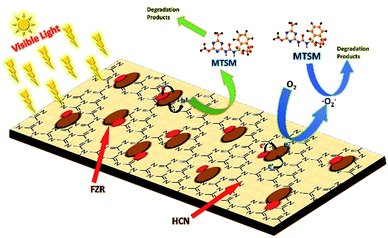
In our work (Fig. 13), the visible light photo-catalytic activity of the HCN–FZR composite was due to the synergistic effect of Fe, ZrO2 and HCN.61 The photo-generated electrons and holes are the starting point of the photo-catalytic reaction. The CB potential of HCN is more negative than that of ZrO2.68,69 Visible light irradiation creates holes in the VB of HCN due to the excitation of electrons from the VB to the CB. Due to the difference in edge potential of the two semiconductors, the photo-generated electrons of HCN easily transfer to the other semiconductor (ZrO2) while the holes remain in the VB of HCN. The ZrO2 CB potential is more negative as compared to EO2/˙O2− (−0.046 V), so it can generate ˙O2− species, which are known to be reactive species, from captured O2.70 The Fe on the surface of ZrO2 generates the photo-generated electrons. Electrons are transferred from Fe to ZrO2 because Fe has a lower Fermi level than ZrO2 (ref. 71 and 72), and the electrons are finally transferred to O2 to produce ˙O2−.4. Conclusion
A hollow graphitic carbon nitride composite was prepared by a solvo-thermal method using a new approach. The prepared catalysts were photo-catalytically active under visible light. HCN–FZR shows complete degradation of MTSM in the visible region. The HPLC-MS results showed the intermediates during degradation of MTSM. HCN–FZR also showed a good degradation rate as compared to HCN–ZR and HCN. The larger surface area with a wider visible light absorbance capability of the HCN–FZR catalyst improved its photo-catalytic ability for MTSM and MO degradation under visible light. Furthermore, the recycling experiments suggested that the photo-catalytic material possessed good stability. The results of this works will be meaningful for further research in the future on the improvement of hollow g-C3N4 photo-catalyst composites.Acknowledgements
This work was supported by the National Natural Science Foundation of P. R. China (51242001, 51572127 and 5122351).Notes and references
- D. Ollis, P. Pichat and N. Serpone, Appl. Catal., B, 2010, 99, 377 CrossRef CAS.
- A. Kubacka, M. Fernández-García and G. Colón, Chem. Rev., 2011, 112, 1555–1614 CrossRef PubMed.
- C. Cui, Y. Wang, D. Liang, W. Cui, H. Hu, B. Lu, S. Xu, X. Li, C. Wang and Y. Yang, Appl. Catal., B, 2014, 158, 150–160 CrossRef.
- K. Iwashina, A. Iwase, Y. H. Ng, R. Amal and A. Kudo, J. Am. Chem. Soc., 2015, 137, 604–607 CrossRef CAS PubMed.
- N. Serpone and A. Emeline, J. Phys. Chem. Lett., 2012, 3, 673–677 CrossRef CAS PubMed.
- M. A. Fox and M. T. Dulay, Chem. Rev., 1993, 93, 341–357 CrossRef CAS.
- X. Wang, K. Maeda, A. Thomas, K. Takanabe, G. Xin, J. M. Carlsson, K. Domen and M. Antonietti, Nat. Mater., 2009, 8, 76–80 CrossRef CAS PubMed.
- X. Wang, K. Maeda, X. Chen, K. Takanabe, K. Domen, Y. Hou, X. Fu and M. Antonietti, J. Am. Chem. Soc., 2009, 131, 1680–1681 CrossRef CAS PubMed.
- Y. Wang, Z. Wang, S. Muhammad and J. He, CrystEngComm, 2012, 14, 5065–5070 RSC.
- Z. Zhu, X. Tang, S. Kang, P. Huo, M. Song, W. Shi, Z. Lu and Y. Yan, Appl. Catal., B, 2016, 182, 115–122 CrossRef CAS.
- H. Wang, X. Yuan, Y. Wu, G. Zeng, X. Chen, L. Leng and H. Li, Appl. Catal., B, 2015, 174, 445–454 CrossRef.
- Y. Zheng, J. Liu, J. Liang, M. Jaroniec and S. Z. Qiao, Energy Environ. Sci., 2012, 5, 6717–6731 CAS.
- F. A. El-kader, M. Moharram, M. Khafagia and F. Mamdouh, Spectrochim. Acta, Part A, 2012, 97, 1115–1119 CrossRef PubMed.
- J. Fu, B. Chang, Y. Tian, F. Xi and X. Dong, J. Mater. Chem. A, 2013, 1, 3083–3090 CAS.
- D. Jiang, L. Chen, J. Zhu, M. Chen, W. Shi and J. Xie, Dalton Trans., 2013, 42, 15726–15734 RSC.
- S. Hu, R. Jin, G. Lu, D. Liu and J. Gui, RSC Adv., 2014, 4, 24863–24869 RSC.
- J. Theerthagiri, R. Senthil, A. Priya, J. Madhavan, R. Michael and M. Ashokkumar, RSC Adv., 2014, 4, 38222–38229 RSC.
- Y. Hong, Y. Jiang, C. Li, W. Fan, X. Yan, M. Yan and W. Shi, Appl. Catal., B, 2016, 180, 663–673 CrossRef CAS.
- G. Liu, P. Niu, C. Sun, S. C. Smith, Z. Chen, G. Q. Lu and H.-M. Cheng, J. Am. Chem. Soc., 2010, 132, 11642–11648 CrossRef CAS PubMed.
- S. Wang, D. Li, C. Sun, S. Yang, Y. Guan and H. He, Appl. Catal., B, 2014, 144, 885–892 CrossRef CAS.
- J. Sun, J. Zhang, M. Zhang, M. Antonietti, X. Fu and X. Wang, Nat. Commun., 2012, 1139 CrossRef.
- Y. S. Jun, E. Z. Lee, X. Wang, W. H. Hong, G. D. Stucky and A. Thomas, Adv. Funct. Mater., 2013, 23, 3661–3667 CrossRef CAS.
- A. I. Cooper, Adv. Mater., 2009, 21, 1291–1295 CrossRef CAS.
- Q. Gu, Y. Liao, L. Yin, J. Long, X. Wang and C. Xue, Appl. Catal., B, 2015, 165, 503–510 CrossRef CAS.
- Y. Cui, Z. Ding, X. Fu and X. Wang, Angew. Chem., Int. Ed., 2012, 51, 11814–11818 CrossRef CAS PubMed.
- D. A. Ward and E. I. Ko, Chem. Mater., 1993, 5, 956–969 CrossRef CAS.
- F. Nuúñez, G. Del Angel, F. Tzompantzi and J. Navarrete, Ind. Eng. Chem. Res., 2010, 50, 2495–2500 CrossRef.
- H. H. Kung, Transition metal oxides: surface chemistry and catalysis, Elsevier, 1989 Search PubMed.
- A. Corma, Chem. Rev., 1995, 95, 559–614 CrossRef CAS.
- A. N. Pour, M. R. Housaindokht, S. F. Tayyari and J. Zarkesh, J. Nat. Gas Chem., 2010, 19, 284–292 CrossRef CAS.
- S. Eriksson, U. Nylén, S. Rojas and M. Boutonnet, Appl. Catal., A, 2004, 265, 207–219 CrossRef CAS.
- Z. Zhu, Z. Lu, D. Wang, X. Tang, Y. Yan, W. Shi, Y. Wang, N. Gao, X. Yao and H. Dong, Appl. Catal., B, 2016, 182, 115–122 CrossRef CAS.
- D.-M. Huang, D.-B. Cao, Y.-W. Li and H. Jiao, J. Phys. Chem. B, 2006, 110, 13920–13925 CrossRef CAS PubMed.
- O. Shekhah, W. Ranke, A. Schüle, G. Kolios and R. Schlögl, Angew. Chem., Int. Ed., 2003, 42, 5760–5763 CrossRef CAS PubMed.
- D. Habibi, A. Faraji, M. Arshadi and J. Fierro, J. Mol. Catal. A: Chem., 2013, 372, 90–99 CrossRef CAS.
- R. Srinivasan, T. Watkins, C. Hubbard and B. H. Davis, Chem. Mater., 1995, 7, 725–730 CrossRef CAS.
- C. Morterra, E. Giamello, G. Cerrato, G. Centi and S. Perathoner, J. Catal., 1998, 179, 111–128 CrossRef CAS.
- M. Waqif, J. Bachelier, O. Saur and J.-C. Lavalley, J. Mol. Catal., 1992, 72, 127–138 CrossRef CAS.
- V. Kriventsov, D. Kochubey, Y. V. Maximov, I. Suzdalev, M. Tsodikov, J. Navio, M. Hidalgo and G. Colón, Nuclear Instruments and Methods in Physics Research Section A: Accelerators, Spectrometers, Detectors and Associated Equipment, 2001, 470, 341–346 CrossRef CAS.
- Y. Cui, Y. Tang and X. Wang, Mater. Lett., 2015, 161, 197–200 CrossRef CAS.
- H. Cui, X. Yang, Q. Gao, H. Liu, Y. Li, H. Tang, R. Zhang, J. Qin and X. Yan, Mater. Lett., 2013, 93, 28–31 CrossRef CAS.
- X. Yang, H. Cui, Y. Li, J. Qin, R. Zhang and H. Tang, ACS Catal., 2013, 3, 363–369 CrossRef CAS.
- Y. Wang, X. Wang and M. Antonietti, Angew. Chem., Int. Ed., 2012, 51, 68–89 CrossRef CAS PubMed.
- H. Li, Y. Liu, X. Gao, C. Fu and X. Wang, ChemSusChem, 2015, 8, 1189–1196 CrossRef CAS PubMed.
- R. Garvie, J. Phys. Chem., 1978, 82, 218–224 CrossRef CAS.
- Y. Cui, J. Zhang, G. Zhang, J. Huang, P. Liu, M. Antonietti and X. Wang, J. Mater. Chem., 2011, 21, 13032–13039 RSC.
- Q. Han, B. Wang, J. Gao, Z. Cheng, Y. Zhao, Z. Zhang and L. Qu, ACS Nano, 2016, 10, 2745–2751 CrossRef CAS PubMed.
- P. Niu, L. Zhang, G. Liu and H. M. Cheng, Adv. Funct. Mater., 2012, 22, 4763–4770 CrossRef CAS.
- H. Ji, F. Chang, X. Hu, Q. Wei and J. Shen, Chem. Eng. J., 2013, 218, 183–190 CrossRef CAS.
- J. Mao, T. Peng, X. Zhang, K. Li, L. Ye and L. Zan, Catal. Sci. Technol., 2013, 3, 1253–1260 CAS.
- X. Wang, S. Wang, W. Hu, J. Cai, L. Zhang, L. Dong, L. Zhao and Y. He, Mater. Lett., 2014, 115, 53–56 CrossRef CAS.
- C. Pan, J. Xu, Y. Wang, D. Li and Y. Zhu, Adv. Funct. Mater., 2012, 22, 1518–1524 CrossRef CAS.
- S. Velu, K. Suzuki, C. S. Gopinath, H. Yoshida and T. Hattori, Phys. Chem. Chem. Phys., 2002, 4, 1990–1999 RSC.
- X. Wang, X. Chen, A. Thomas, X. Fu and M. Antonietti, Adv. Mater., 2009, 21, 1609–1612 CrossRef CAS.
- J. Zhu, S. A. C. Carabineiro, D. Shan, J. L. Faria, Y. Zhu and J. L. Figueiredo, J. Catal., 2010, 274, 207–214 CrossRef CAS.
- Z. Li, C. Kong and G. Lu, J. Phys. Chem. C, 2016, 120(1), 56–63 CAS.
- Y. Zhao, Y. Zhang, J. Li and X. Du, Mater. Lett., 2014, 130, 139–142 CrossRef CAS.
- K. Woan, G. Pyrgiotakis and W. Sigmund, Adv. Mater., 2009, 21, 2233–2239 CrossRef CAS.
- R. Leary and A. Westwood, Carbon, 2011, 49, 741–772 CrossRef CAS.
- S. Yan, Z. Li and Z. Zou, Langmuir, 2009, 25, 10397–10401 CrossRef CAS PubMed.
- X. Wang, L. Zhang, H. Lin, Q. Nong, Y. Wu, T. Wu and Y. He, RSC Adv., 2014, 4, 40029–40035 RSC.
- J. Liqiang, Q. Yichun, W. Baiqi, L. Shudan, J. Baojiang, Y. Libin, F. Wei, F. Honggang and S. Jiazhong, Sol. Energy Mater. Sol. Cells, 2006, 90, 1773–1787 CrossRef.
- C. Yuan, X. Zhang, L. Su, B. Gao and L. Shen, J. Mater. Chem., 2009, 19, 5772–5777 RSC.
- A. Vinu, Adv. Funct. Mater., 2008, 18, 816–827 CrossRef CAS.
- M. Rodriguez and D. B. Orescan, Anal. Chem., 1998, 70, 2710–2717 CrossRef CAS PubMed.
- N. Brand, A. Gilles Mailhot and M. Bolte, Environ. Sci. Technol., 1998, 32, 2715–2720 CrossRef CAS.
- C. Von Sonntag and H. P. Schuchmann, Angew. Chem., Int. Ed. Engl., 1991, 30, 1229–1253 CrossRef.
- F. Wu, Y. Liu, G. Yu, D. Shen, Y. Wang and E. Kan, J. Phys. Chem. Lett., 2012, 3, 3330–3334 CrossRef CAS.
- S. Sayan, R. Bartynski, X. Zhao, E. Gusev, D. Vanderbilt, M. Croft, M. Banaszak Holl and E. Garfunkel, Phys. Status Solidi B, 2004, 241, 2246–2252 CrossRef CAS.
- D. Wang, T. Kako and J. Ye, J. Am. Chem. Soc., 2008, 130, 2724–2725 CrossRef CAS PubMed.
- H.-D. Wiemhöfer, S. Harke and U. Vohrer, Solid State Ionics, 1990, 40, 433–439 CrossRef.
- W. Zipprich, H. D. Wiemhöfer, U. Vohrer and W. Göpel, Ber. Bunsen-Ges. Phys. Chem., 1995, 99, 1406–1413 CrossRef CAS.
Footnote |
| † Electronic supplementary information (ESI) available. See DOI: 10.1039/c6ra26227a |
| This journal is © The Royal Society of Chemistry 2017 |

