 Open Access Article
Creative Commons Attribution 3.0 Unported Licence
Characterization and failure mode analyses of air plasma oxidized PDMS–PDMS bonding by peel testing†
C.-f. Chen * and
K. Wharton
Department of Mechanical Engineering, University of Alaska Fairbanks, AK, USA. E-mail: cf.chen@alaska.edu
First published on 5th January 2017
Abstract
Bonding of air plasma oxidized polydimethylsiloxane (PDMS) strips is evaluated in this paper by peel testing. Two PDMS–PDMS strips, after being treated with air plasma, were brought together for bonding into a specimen, which was subsequently subjected to peeling until breaking apart. The maximum load applied in each peel test was used to indicate the bonding strength. Among the 68 specimens tested, 40 experienced a maximum load in the range of 0.1–0.2 N mm−1. Seventy-six percent of the specimens under peel testing failed at the cohesive mode, meaning that the air plasma-based bonding can be strong enough to retain its integrity after peeling. Correlation between the maximum load and failure modes suggests that strong bonding can be achieved with a higher plasma power for 50–60 seconds of treatment in air plasma. Based on the Kendall energy balance equation, we suggest that the higher the maximum load per unit width applied in the peel test, the larger the adhesion energy in the bonding interface.
1. Introduction
Surface treatment of PDMS by plasma oxidation is a standard method to create silanol functional groups for bonding and for other surface functionalizations.1 When reacting with oxygen plasma, the monomer O–Si(CH3)2 of PDMS near the surface will be converted into the hydroxyl group (–OH, which is associated with the silanol group SiOH), ready for covalent bonding to another plasma-treated PDMS piece.2 Because the polar silanol groups make the surface hydrophilic,3 the density of the silanol group can be indirectly quantified by the hydrophilicity or wettability of the surface, e.g., the contact angle of a deionized (DI) water droplet on the treated surface.4 Therefore, the quality and strength of bonding can be indirectly evaluated by the hydrophilicity of an oxidized PDMS surface. Rezal et al.5 reviewed the heterogeneous bonding of PDMS to various materials.Among various gas media for plasma treatment of PDMS,6 oxygen is widely used.7–9 Oxygen plasma-assisted PDMS–PDMS bonding can be as strong as 690 kPa (100 psi).10 Intriguingly, inert gases, such as argon, nitrogen, and helium, have also been used in plasma oxidization of PDMS surfaces.6 The source of oxygen for plasma oxidization using inert gases comes from the residual air in the plasma chamber, the water vapor that exists in the plasma machine, or the oxygen retained in the polymer.6 Inert gases do not introduce any detectable chemical components on the treated PDMS surface.11
The bonding strength of plasma-treated PDMS surfaces has been assessed indirectly12,13 and directly,14–16 mostly for oxygen plasma-treated PDMS surfaces. Indirectly, Chen et al.12 studied hydrophobic recovery on the air plasma-treated PDMS surface. Jiang et al.13 related the contact angle of a water drop on an air plasma-treated PDMS surface to the plasma treatment time. Bhattacharya et al.14 correlated the hydrophilicity of a plasma-treated PDMS surface to its bonding strength, in terms of the contact angle. Despite the lack of a standard for measuring the true bonding strength, the air infusion test,15 pressure rupture test,14,17 shear test,16,17 mechanical tensile test,15 T-peel testing,18 and blister test19,20 have been developed for characterizing the bonding strength.
The use of air plasma is convenient, and has been used to make the PDMS surface hydrophilic.12,21–23 Chen and Lindner have studied the stability of hydrophilicity on air plasma-treated PDMS surfaces.12 Air plasma-treated PDMS–PDMS bonding, although well-known for its suitability to many microfluidics applications,24 has yet to be directly evaluated.
In this paper we assess the air plasma-assisted PDMS–PDMS bonding strength directly by peel testing, to quantify air plasma for its effectiveness in surface treatment for bonding. The failure mode of each specimen and its correlation to the bonding strength are discussed.
2. Experimental section
The PDMS samples used in this work were prepared per the standard protocol: mix the elastomer (Sylgard 184, Dow Corning) and its cross-linking agent at the 10![[thin space (1/6-em)]](https://www.rsc.org/images/entities/char_2009.gif) :
:![[thin space (1/6-em)]](https://www.rsc.org/images/entities/char_2009.gif) 1 ratio (by weight), degas in a vacuum desiccator, pour the degased mixture into the respective customer-designed molds for each experiment, and cure under 200 °C for 8 min.
1 ratio (by weight), degas in a vacuum desiccator, pour the degased mixture into the respective customer-designed molds for each experiment, and cure under 200 °C for 8 min.
A batch of specimens were assembled as follow. A flat piece of cured PDMS (1.5 mm thick) was cut into strips 5 mm wide and 50 mm long. Two cut PDMS strips, with the bonding surface up, were treated in air plasma under various combinations of three treatment parameters: the pressure in the barrel reactor, the radio frequency (RF) power, and the plasma treatment time. Two different pressure levels (200 and 300 mTorr) and three power levels (6.8, 10.5, and 18 W) were individually used for treatment times in the range of 30 and 60 seconds. In total thirteen combinations were tested (see Table 1 in the ESI†). Following plasma treatment, the PDMS strips were immediately brought into contact manually for bonding per the scheme shown in Fig. 1(a). The bonding was carefully made by placing a piece of paper between the two treated PDMS strips to achieve a bonding area of 6 mm × 5 mm. A 100 g weight was subsequently placed on the bonded specimen to keep pressing at the bonding area for 5 minutes. It took a few minutes to complete a test, the duration of which is determined by the strength of bonding (the stronger the bonding, the longer the specimen was stretched in the test). In the dwelling period and waiting in queue for testing, all the specimens were exposed to the ambient environment.
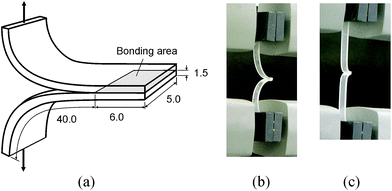 | ||
| Fig. 1 (a) Specimen geometry for peel test. (b) Specimen setup in Instron without loading (c) and under loading. (Units in mm. Dimensions not to scale.) | ||
Three bonded specimens were prepared for testing each combination of the plasma treatment parameters. Each bonded PDMS specimen was subjected to T-peel testing.18,25 For the test, each bonded specimen was clamped with the grips of a test machine (Instron 4466 System, Norwood, MA) at about 40 mm from the edge of bonding, and loading was applied as shown in Fig. 1(b). A specimen, once installed in place, remained in a slack status before the test started. Once the test started, the specimen became tauter (Fig. 1(c)) by moving the grip at 10 mm min−1 until breaking up (or breaking apart) the specimen. All the tests were conducted under the ambient conditions. In each test, the load-displacement curve, maximum slope of the curve, and maximum load were recorded.
3. Results and discussion
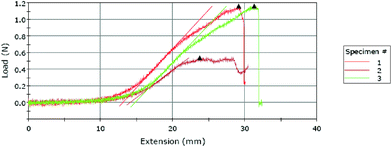
A typical result obtained from the Instron machine for a T-peel test is shown in Fig. 2, which shows that the three tests took about 3 minutes to complete (as estimated by dividing the extension by the constant extension rate 10 mm min−1). The maximum slope and maximum load are automatically marked by the software for each load vs. extension curve. These curves show that the loading starts at zero and gradually increases to a maximum value at which marks the onset of de-bonding. Note that the T-peel test in this work was conducted under a constant-displacement-rate loading condition, which is different from the traditional peel test which applies a constant load for measuring the adhesive fracture toughness.26 The load-displacement in Fig. 2 shows that the load remains zero until the specimen reached an extension of about 1 cm.Fig. 3(a) shows the mean and the 95% confidence level of the measured maximum tensile loads for each combination of the plasma treatment parameters (the magnitude is scaled to the width of each specimen). Among the 69 specimens tested, except one outlier which was not included in the discussion hereafter, 40 (59%) experienced a maximum peeling force in the range of 0.1–0.2 N mm−1, as shown in Fig. 3(b).
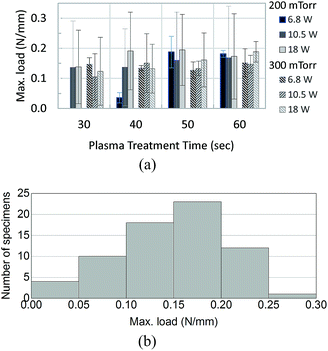 | ||
| Fig. 3 Maximum load (per unit width of specimen) applied in peel test. (a) Average of the load per the air plasma treatment parameters. (b) Population of the measured loads. | ||
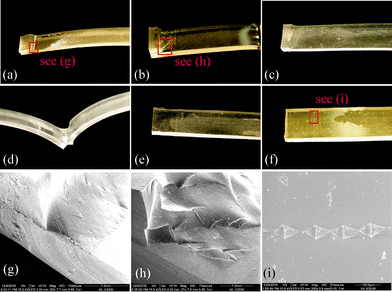
In the peel test, the experiment was terminated when a specimen was broken by pulling. We observed the patterns of failure (aka failure mode herein) at the broken site for each specimen and summarized the failure modes in Fig. 4(a) cohesive failure, (b)–(d) mixing with cohesive and adhesive failure, and (e) and (f) adhesive failure. Specimens with strong bonding were broken in the bulky PDMS material, resulting in a cohesive failure. In the mixed failure mode, a portion of the bonding interface was delaminated while the remaining remained intact. The adhesive failure mode reveals a smooth de-bonding interface, indicating a weak bonding. Fig. 4(g)–(i) show the SEM imaging of the selected areas in Fig. 4(a), (b) and (f), individually.
The failure mechanism for the adhesive and cohesive modes can be explained as follow. In plasma oxidization, the chain –O–Si(CH3)2 in PDMS reacts with oxygen to form the silanol groups SiOH on a treated surface. The silanol groups are ready for covalent bonding to other treated surface having the same –OH groups.2 The bonding strength is essentially determined by the amount of the covalent bonding, which in turn is a function of the density of the silanol groups on a treated surface. The plasma treatment parameters, in combination, account for the energy of the radicles formed at the PDMS surface.27 When under-treated, the density of the silanol groups on the PDMS surface would result in insufficient covalent bonding. When over-treated, the treated PDMS surface will appear undesired surface microcracks, which are attributed to the formation of the brittle silica layer.28 The onset of microscracking is dependent of the plasma power level, the pressure in the treatment chamber and the time of treatment.6 Although in this study we are unable to precisely quantify such an onset, in the following discussion we suggest an optimal condition of the plasma treatment for strong bonding.
Among the 68 specimens analyzed, 52 specimens (76%) failed at the cohesive mode. In Fig. 5, each data point of the measured maximum load is associated with its corresponding failure mode, and arranged against each plasma treatment parameter: pressure, treatment time, and power. It is clear that the data points with maximum loads of 0.1 N mm−1 or larger are of the cohesive failure mode, while smaller loads are associated with the adhesive failure mode. Furthermore, specimens with bonding strength 0.1 N mm−1 or larger can be achieved more probably with a higher power for 50–60 seconds of treatment in air plasma. There is more probability of failing at the adhesive mode at a lower power setting with a treatment time of 40 seconds or less in air plasma, which implies a weaker bonding.
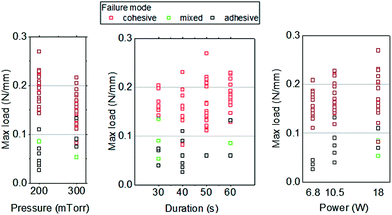 | ||
| Fig. 5 Dependence of failure modes, maximum load (per unit width of specimen), and air plasma treatment parameters. | ||
The maximum load (per unit width) applied in the peel test can be an index to the adhesive energy density in the bonding interface. Per the Kendall energy balance equation,29 the adhesive energy is the “experimental energy required to fracture unit area of interface” in the community of adhesion, which is also known as the fracture toughness in solid mechanics. Kendall's equation was originally formulated for predicting the adhesive energy of an elastic thin film peeling from a solid (undeformable) substrate. The adhesive energy between two elastic thin films can be similarly derived (see the ESI†). We show that the adhesive energy density (for density, according to Kendall's definition, is the energy per unit width of the thin film) is 2(F/b)(1 − cos![[thin space (1/6-em)]](https://www.rsc.org/images/entities/char_2009.gif) θ), where (F/b) is the maximum load per unit width. Note that Kendall's equation is only applicable to the specimens with the adhesive failure mode. As our experimental data are insufficient to determine the angle θ for the specimens failed at the adhesive mode, we can only conclude that the adhesive energy is lower bounded by 2(F/b).
θ), where (F/b) is the maximum load per unit width. Note that Kendall's equation is only applicable to the specimens with the adhesive failure mode. As our experimental data are insufficient to determine the angle θ for the specimens failed at the adhesive mode, we can only conclude that the adhesive energy is lower bounded by 2(F/b).
For simplicity, 2(F/b) can serve as an index to the adhesion energy density. It should be noted that our data were obtained under a displacement rate at 10 mm min−1 in the T-peel test. Whether the displacement rate will affect the adhesion energy is an open question for future work on peel testing.
Lu et al. used the blister test19,20 to determine the bonding strength of PDMS with oxygen plasma. They suggested using the critical line force at which a thin PDMS film is delaminated from a bonded PDMS substrate as an index to the bonding strength. For the treatment by oxygen plasma at 150 mTorr and 75 W for 10 seconds, they showed that the critical line force, independent of the blister size, is about 0.11 N mm−1. Their calculation of the critical line force in the blister test was based on the mechanics of thin shell theory,19 which is essentially a two-dimensional version of the one-dimensional Euler–Bernoulli beam theory30 on which the peel testing was based. Albeit such a first-principle approximate comparison, it is evidence that air-plasma oxidization can achieve a comparable bonding strength to oxygen plasma.
4. Conclusions
In this paper we used the peel test to characterize the bonding strength of PDMS–PDMS film treated by air plasma for bonding. The results show that the PDMS surface treated by air plasma for bonding can be strong enough that bonded PDMS strips fail by tearing (cohesive failure) rather than delaminating (adhesive failure). By a combinatorial test of various air plasma treatment conditions, our results suggest that (1) a stronger bonding can be achieved with a higher plasma power for 50–60 seconds of treatment in air plasma, and (2) weaker bonding is more probably associated with a treatment time of 40 seconds or less at a lower pressure in air plasma. This paper also contributes a finding that, based on the Kendall equation, the higher the maximum load per unit width applied in the peel test, the larger the adhesion energy in the bonding interface.Acknowledgements
The authors thank Ms Joan Welc-LePain for proof-reading the manuscript and Mr Benjamin Ramirez for taking the SEM images. This material is based in part upon work supported by the National Aeronautics and Space Administration (NASA) under Grant Number NNH15ZHA003C. Any opinions, findings, and conclusions or recommendations expressed in this material are those of the authors and do not necessarily reflect the views of NASA. The office of the Vice Chancellor for Research at the University of Alaska Fairbanks provided a financial support for publishing this paper.Notes and references
- I. Wong and C.-M. Ho, Microfluid. Nanofluid., 2009, 7, 291–306 CrossRef CAS PubMed.
- J. R. Hollahan and G. L. Carlson, J. Appl. Polym. Sci., 1970, 14, 2499–2508 CrossRef CAS.
- M. J. Owen and P. J. Smith, J. Adhes. Sci. Technol., 1994, 8, 1063–1075 CrossRef CAS.
- A. Baszkin, M. Nishino and L. Ter Minassian-Saraga, J. Colloid Interface Sci., 1976, 54, 317–328 CrossRef CAS.
- P. Rezai, P. R. Selvaganapathy and G. R. Wohl, J. Micromech. Microeng., 2011, 21, 065024 CrossRef.
- J. Fritz and M. J. owen, J. Adhes., 1995, 54, 33–45 CrossRef CAS.
- J. C. McDonald, D. C. Duffy, J. R. Anderson, D. T. Chiu, H. Wu, O. Schueller and G. M. Whitesides, Electrophoresis, 2000, 21, 27–40 CrossRef CAS PubMed.
- B. H. Jo, L. M. Van Lerberghe, K. M. Motsegood and D. J. Beebe, J. Microelectromech. Syst., 2000, 9, 76–81 CrossRef CAS.
- A. L. Thangawng, M. A. Swartz, M. R. Glucksberg and R. S. Ruoff, Small, 2007, 3, 132–138 CrossRef CAS PubMed.
- M. A. Unger, H. P. Chou, T. Thorsen, A. Scherer and S. R. Quake, Science, 2000, 288, 113–116 CrossRef CAS PubMed.
- D. Bodas and C. Khan-Malek, Sens. Actuators, B, 2007, 123, 368–373 CrossRef CAS.
- I. J. Chen and E. Lindner, Langmuir, 2007, 23, 3118–3122 CrossRef CAS PubMed.
- X. Jiang, H. Zheng, S. Gourdin and P. T. Hammond, Langmuir, 2002, 18, 2607–2615 CrossRef CAS.
- S. Bhattacharya, A. Datta, J. M. Berg and S. Gangopadhyay, J. Microelectromech. Syst., 2005, 14, 590–597 CrossRef CAS.
- V. Sunkara, D. K. Park, H. Hwang, R. Chantiwas, S. A. Soper and Y. K. Cho, Lab Chip, 2011, 11, 962–965 RSC.
- K. C. Tang, E. Lian, W. L. Ong, J. D. Wong, A. Agarwal, R. Nagarajan and L. Yobas, J. Phys.: Conf. Ser., 2006, 34, 155–161 CrossRef CAS.
- M. A. Eddings, M. A. Johnson and B. K. Gale, J. Micromech. Microeng., 2008, 18, 067001 CrossRef.
- Y.-W. Lin, T.-C. Chiu and H.-T. Chang, J. Chromatogr. B: Anal. Technol. Biomed. Life Sci., 2003, 793, 37–48 CrossRef CAS.
- Y.-W. Lu and P.-T. Lin, Proceedings of Nanotech, 2007, vol. 2007 Search PubMed.
- Y.-W. Lu, P.-T. Lin and C.-S. Pai, International Solid-State Sensors, Actuators and Microsystems Conference, 2007, pp. 2095–2098 Search PubMed.
- M. Nania, O. K. Matar and J. T. Cabral, Soft Matter, 2015, 11, 3067–3075 RSC.
- R. Bartali, L. Lorenzelli, M. Scarpa, E. Morganti, C. Collini and V. Micheli, Adv. Sci. Technol., 2013, 81, 96 CrossRef CAS.
- R. A. Lawton, C. R. Price, A. F. Runge, W. J. Doherty Iii and S. S. Saavedra, Colloids Surf., A, 2005, 253, 213–215 CrossRef CAS.
- Harrick Plasma, Benefits of Plasma Treatment for Microfluidic Device Fabrication, 2014, http://harrickplasma.com/applications/microfluidic-devices Search PubMed.
- ASTM, Standard Test Method for Peel Resistance of Adhesives (T-Peel Test), D1876–08, 2015 Search PubMed.
- L. F. Kawashita, D. R. Moore and J. G. Williams, J. Adhes., 2006, 82, 973–995 CrossRef CAS.
- N. S. J. Braithwaite, Plasma Sources Sci. Technol., 2000, 9, 517–527 CrossRef CAS.
- H. Hillborg, J. F. Ankner, U. W. Gedde, G. D. Smith, H. K. Yasuda and K. Wikström, Polymer, 2000, 41, 6851–6863 CrossRef CAS.
- K. Kendall, J. Phys. D: Appl. Phys., 1975, 8, 1449 CrossRef.
- O. Bauchau and J. Craig, in Structural analysis, Springer, 2009, pp. 173–221 Search PubMed.
Footnote |
| † Electronic supplementary information (ESI) available: In ESI the revised Kendall equation is provided. See DOI: 10.1039/c6ra25947b |
| This journal is © The Royal Society of Chemistry 2017 |

