Bridge-driven aggregation control in dibenzofulvene–naphthalimide based donor–bridge–acceptor systems:![[thin space (1/6-em)]](https://www.rsc.org/images/entities/h2_char_2009.gif) enabling fluorescence enhancement, blue to red emission and solvatochromism†
enabling fluorescence enhancement, blue to red emission and solvatochromism†
Peddaboodi
Gopikrishna
a,
Laxmi
Raman Adil
b and
Parameswar Krishnan
Iyer
 *ab
*ab
aCenter for Nanotechnology, Indian Institute of Technology Guwahati, Guwahati-781039, Assam, India
bDepartment of Chemistry, Indian Institute of Technology Guwahati, Guwahati-781039, Assam, India. E-mail: pki@iitg.ernet.in; Fax: +91 361 258 2349
First published on 8th September 2017
Abstract
Four novel 1,8-naphthalimide (NC) and mono-substituted dibenzofulvene (DBF) based structures have been designed and successfully synthesized. Two luminogens were substituted by a thiophene bridge (DT1NC and DT2NC), while the other two luminogens were substituted by a phenyl bridge (DP1NC and DP2NC) between the NC and DBF units. This minor structural modification crafts striking changes in the photophysical behavior. DT1NC and DT2NC displayed aggregation induced emission enhancement (AIEE) behavior. They also showed orange and red emission (575 nm and 602 nm), respectively, with large bathochromic shifts (35 nm and 112 nm) and high quantum yields (84.10% and 65.65%) in the aggregated state because of ladder type J-aggregation. DP1NC exhibited weak AIEE behavior in the blue region, while DP2NC showed an AIE inactive nature because of the strong C–H⋯π intermolecular interactions. All the luminogens showed positive solvatochromism caused by intramolecular charge transfer (ICT). The DT2NC and DP2NC luminogens were substituted with two bromine atoms at the 2,7 positions of the DBF moiety, but unexpectedly only DT2NC showed a strong heavy atom effect. Theoretical and experimental HOMO and LUMO energy levels were estimated by density functional theory and cyclic voltammetry, respectively. All luminogens displayed excellent thermal stabilities and good morphological behavior.
Introduction
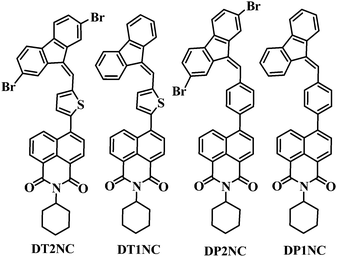
Strong solid state or aggregated state emissive organic luminescent materials have attracted great attention in the field of organic light emitting diodes (OLEDs),1–4 bio-imaging5–8 and chemosensors.9–12 Various conventional organic materials have been synthesized and utilized in various fields. Nevertheless, the major problem with these materials is their high emission in dilute solutions, and they also become less or non-emissive in the solid or aggregated state because of the occurrence of typical π–π intermolecular interactions, which leads to aggregation-caused quenching (ACQ).13–15 To overcome this problem, a new class of organic materials was developed by Tang et al. (2001), which displayed exactly the opposite characteristics compared to ACQ materials.16 These materials exhibited unique properties i.e., they exhibited less or no fluorescence in the solution state but were highly emissive in the solid state or aggregated state. In the solution state, free intramolecular rotations are highly probable when molecules go to the excited state by absorbing energy. Thus, the absorbed energy was consumed for intermolecular rotations leading to non-radiative relaxation pathways while coming back to the ground state.17 These materials possess non-planar or propeller-shaped structures. In the solid state or aggregated state, free intramolecular rotations are restricted by the phenomena called restriction of intramolecular rotation (RIR). Because of the non-planarity, they cannot come close to each other, which leads to high emission in the solid state or the aggregated state. Another interesting aggregation-induced emission enhancement (AIEE) phenomena has been reported by Park et al.18 These luminescent materials have an advantage of emitting in both solution as well as in the solid state, but compared to the solution state, the fluorescence emission or quantum yields are higher in the solid state or aggregated state. Many of the AIEE active materials have been prepared by different mechanisms such as J-type aggregation, activated phosphorescence and excimer formation. To date, several AIE and AIEE active materials have been reported, which are mainly based on tetraphenylethelene (TPE),19–21 silole16,22–25 and phenothiazine derivatives.26,27 However, very few reports are available in literature on DBF derivatives. DBFs are of two types based on substituents at the 9th position i.e., di-substituted and mono-substituted DBFs. Most of them are based on di-substituted DBFs and their optical properties are limited to the blue to green wavelength region. Mono-substituted DBF derivatives possess unique optical characteristics that are rather unusual and overlooked.28 Previous results revealed that depending on the substituent on the DBF, the luminogens exhibited diverse and exceptional photophysical properties. In addition, 1,8-naphthalimide and its derivatives have great advantages in the field of OLEDs29–31 and bio-imaging32,33 because of their good thermal stability, photostability and high fluorescence quantum yields. Recently, AIEE active luminogens based on 1,8-naphthalimide derivatives have also been reported.34–37 The photophysical, electrochemical and thermal properties of the 1,8-naphthalimide can be varied depending on the substituents. It is well-known that introduction of an electron donating group at the 4th position of the 1,8-naphthalimide molecule bestows it with high fluorescence.38 In the past decades, few donor molecules with triphenyl amine, carbazole, TPE etc. have been developed.29,36,39,40 Therefore, it is necessary to design and develop new materials possessing strong electron donors as well as exhibiting higher fluorescence in the solid state.In this report, we present four novel organic molecules, designed and synthesised via simple condensation and Suzuki coupling reactions based on mono-substituted DBFs and 1,8-naphthalimide derivatives. These luminogens exhibit AIEE active phenomena, heavy atom effect and solvatochromism. The emission colors were successfully tuned from the blue to the red region because of the electron donating ability of the donor at the 4th position of the 1,8-naphthalimide moiety. Two thiophene bridge substituted DBFs (DT1NC and DT2NC) and two phenyl bridge substituted DBFs (DP1NC and DP2NC) as donor substituents were chosen in this study. The thiophene bridge substituted DBFs exhibit unique AIEE phenomena with a large bathochromic shift and high florescence quantum yields in the aggregated state. On the other hand, the phenyl bridge substituted DBFs show high fluorescence quantum yields in the solution state and less or no luminescence in the aggregated state. The bromine substituted luminogens greatly influenced the photophysical, thermal and electrochemical properties and also exhibited solvatochromism. Density functional theory (DFT) was used to compute the ground state optimization. Time-dependent density functional theory (TD-DFT) method was utilized to estimate the absorption spectra and excitation energies for all the luminogens.41,42
Results and discussion
Synthesis and characterization
The model structures of DT1NC, DT2NC, DP1NC and DP2NC are shown in Scheme 1 and synthesized using the Suzuki coupling reaction, followed by condensation reactions in good yields. All the synthesized compounds were characterized well by 1H, 13C NMR, high resolution mass spectrometry (HRMS) and single crystal X-ray analysis (DP1NC and DP2NC). The details of the synthesis procedure and synthetic routes of all the compounds are provided in the ESI† (Scheme S2).Solvatochromism
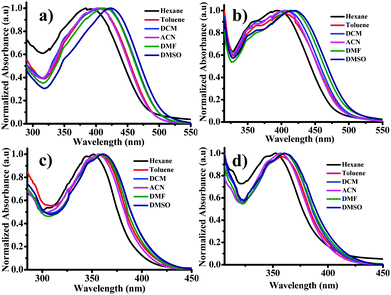
It is well accepted that the donor–acceptor organic systems readily show solvatochromic phenomenon. The UV-visible and photoluminescence (PL) spectra of luminogens were studied in various organic solvents such as hexane, toluene, DCM, acetonitrile, DMF and DMSO. The solvatochromic study was performed by changing solvents from non-polar (hexane) to polar (DMSO) with a constant concentration (10 μM) for all luminogens. Fig. 1 shows the absorption spectra of all luminogens. The absorption values summarized in Table 1 depict that among all the luminogens, DTNC (DT1NC and DT2NC) exhibited two absorption bands, the former band (343 to 350 nm and 355 to 361 nm for DT1NC and DT2NC, respectively) was attributed to the π–π* transition and the latter band (392 to 425 nm and 392 to 419 nm for DT1NC and DT2NC, respectively) indicated the intramolecular charge transfer (ICT). DPNC (DP1NC and DP2NC) luminogens showed a single broad absorption band (350 to 362 nm for DP1NC and 352 to 362 nm for DP2NC). The absorption bands were gradually red-shifted for all the luminogens on changing the solvent polarity from non-polar to polar. The PL spectra of all the luminogens are displayed in Fig. 2 and the emission values are presented in Table 1 in different solvents. Interestingly, for all the luminogens, with an increase in polarity from hexane to DMSO, the emission peaks red-shifted remarkably from 522 to 572 nm (50 nm) for DT1NC, from 426 to 500 nm (74 nm) for DT2NC, from 402 to 435 nm (33 nm) for DP1NC and from 397 to 432 nm (35 nm) for DP2NC. The DT1NC and DT2NC luminogens showed two peaks for almost all the solvents. The peak at the lower wavelength region is due to the locally excited state of the NC moiety and that at the higher wavelength region is due to the ICT between mono-substituted DBF and NC. As shown in Fig. 2, the DT2NC luminogen does not exhibit the ICT band in hexane, toluene and DCM solvents, but in DT1NC, the intensity of the locally excited emission band is reduced. This significant change is observed because of bromine atoms on the DBF moiety. The bromine atoms act as weak withdrawing groups because of which the donating capacity of the DBF is reduced. Surprisingly, the emission intensity is enhanced by changing the solvent polarity from hexane to DMSO, particularly in brominated (DT2NC and DP2NC) luminogens. Normally, in a solvatochromic phenomenon, when the solvent polarity is increased, the emission intensity decreases. It is well known that for 1,8-naphthalimide derivatives, the triplet and singlet states can be arranged according to the polarity of the solvent.43,44 In non-polar solvents, the triplet state T2 becomes lower than the singlet state S1, facilitating an efficient intersystem crossing (ISC) process. Therefore, in the presence of heavy (bromine) atoms, the fluorescence intensity gets completely quenched, promoting efficient ISC. As the polarity of the solvent is changed from non-polar to polar, the T2 state shifts to higher energies, and then the ISC process decreases, resulting in an increase in the fluorescence intensity. For better visibility of the emission colors and intensity, the luminogens were dissolved in different solvents and the images were captured using 365 nm UV lamp irradiation (Fig. 2). Surprisingly, both absorption and PL peaks were blue-shifted as observed in DT2NC compared to DT1NC for all the solvents. In particular, a greater blue-shift was observed in the PL spectra, for example 96 nm for hexane, 101 nm for toluene, 108 nm for DCM, 82 nm for acetonitrile, 73 nm for DMF and 72 nm DMSO. When closely examined, both luminogens (Scheme 1) i.e. DT1NC and DT2NC are structurally identical but the DT2NC luminogen possesses two bromine atoms. Since the bromine atom acts as a weak withdrawing group, on introducing the two bromine atoms on the DBF moiety (DT2NC), the donating capacity of the DBF decreases. However, in DPNC luminogens i.e., from DP1NC to DP2NC, a great difference was not observed in both the absorption and PL spectra. Thus, the bromine atoms do not affect DP2NC as much as affect DT2NC. This is because in the DPNC luminogens, the DBF moiety does not act as a strong donor unit. This majorly due to the fact that the phenyl bridge unit is present almost orthogonally between 1,8-naphthalimide (NC) and the DBF moiety, which reduces the effective conjugation length towards the NC from DBF.45| Monomer | DT1NC | DT2NC | DP1NC | DP2NC | ||||
|---|---|---|---|---|---|---|---|---|
| UV λmax, [nm] | PL λmax, [nm] | UV λmax, [nm] | PL λmax, [nm] | UV λmax, [nm] | PL λmax, [nm] | UV λmax, [nm] | PL λmax, [nm] | |
| Hexane | 343, 392 | 522 | 355, 392 | 426 | 350 | 402 | 352 | 397 |
| Toluene | 347, 403 | 532 | 356, 403 | 431 | 356 | 406 | 357 | 405 |
| DCM | 347, 408 | 543 | 360, 407 | 435 | 358 | 422 | 359 | 421 |
| ACN | 347, 404 | 554 | 360, 403 | 472 | 358 | 424 | 357 | 423 |
| DMF | 348, 416 | 565 | 361, 414 | 492 | 360 | 428 | 359 | 429 |
| DMSO | 350, 425 | 572 | 361, 419 | 500 | 362 | 435 | 362 | 432 |
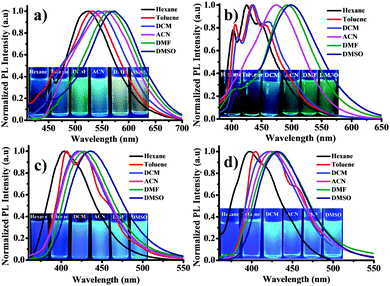 | ||
| Fig. 2 PL spectra of (a) DT1NC, (b) DT2NC, (c) DP1NC and (d) DP2NC in different solvents. Photographs were taken under 365 nm UV lamp irradiation. | ||
Aggregation induced emission enhancement (AIEE) properties
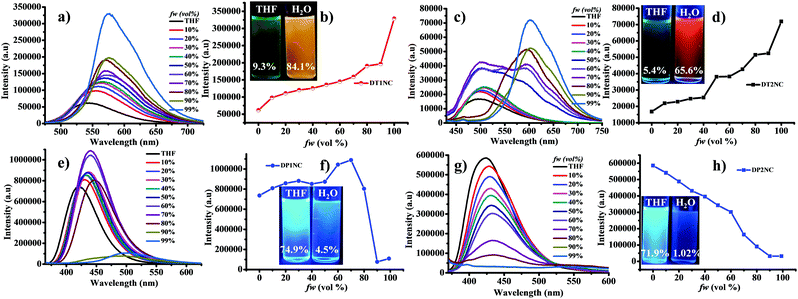
To realize the AIEE active or inactive behavior of luminogens, we selected a good solvent (THF) and a poor solvent (water). The concentrations of all the luminogens were kept constant (i.e. 50 μM). Thereafter, UV-visible and PL spectra were recorded by varying the water fraction (fw) in THF.The UV-visible spectra were studied by increasing the fw in the THF solution from 0% to 99%. As mentioned earlier, the DTNC luminogens showed two bands: one at the shorter wavelength region for π–π* transition and the second for ICT. On the contrary, the two DPNC luminogens showed a single band only for the π–π* transition. Fig. 3 explains that when fw is varied from 0% to 99%, the absorption peak gradually shifts towards the longer wavelength region (22 nm for DT1NC, 14 nm DT2NC, 11 nm for DP1NC and 8 nm for DP2NC). This might be due to the increasing solvent polarity or formation of J-type aggregation. Similarly, the PL spectra were studied for all luminogens by increasing fw in THF solution (Fig. 4). Surprisingly, it was noticed that both DTNC luminogens exhibited strong AIEE active behaviour and the remaining two DPNC luminogens displayed ACQ behavior. It is to be noted that both DT1NC and DT2NC luminogens exhibited weak emission with less quantum yields of 9.35% for DT1NC and 5.46% for DT2NC in THF. This might be due to the intermolecular rotation of the DBF moiety and thiophene. On increasing fw from 0% to 99%, the emission intensity gradually increases and the peaks are red-shifted. In 99% fw, the luminogens exhibited strong fluorescence with high quantum yields of 84.10% for DT1NC and 65.65% for DT2NC. These results clearly reveal that on increasing the fw in the THF solution, the formation of nanoparticles was initiated (confirmed by FE-SEM and DLS measurements). For both luminogens, the emission peaks were red-shifted from THF to water (99%), for DT1NC-35 nm red-shifted from 540 nm to 575 nm and for DT2NC-112 nm red-shifted from 490 nm to 602 nm because of the formation of J-type aggregation. Such remarkable red-shifts were also observed in the absorption spectra. The maximum emission intensities were observed when fw reached 99%. This was because of RIR, and the red-shift of emission was attributed to intramolecular planarization of nanoparticles leading to the formation of J-type aggregation. On comparing both the luminogens in THF and water, it was found that DT2NC was blue-shifted (50 nm) in THF and red-shifted (27 nm) in 99% fw. As already explained earlier, the two bromine atoms, present at the 2,7 positions on the DBF moiety of the DT2NC, are responsible for such a drastic blue-shift in the THF solution and red-shift in 99% fw. Unexpectedly, both DPNC luminogens showed a relatively opposite behavior compared to the DTNC luminogens, i.e., these luminogens exhibited a strong blue fluorescence with high quantum yields 74.19% and 71.92% for DP1NC and DP2NC, respectively in THF. As shown in Fig. 4e, on increasing the fw in THF from 0% to 70%, the emission intensity of the DP1NC increased with a 20 nm red-shift because of the formation of nanoparticles. On increasing the fw, the emission intensity decreases. This might be due to the agglomeration of nanoparticles in the higher fw, leading to reduced effective fluorescence emission (4.5% quantum yield in 99% fw). Similarly, the DP2NC luminogen exhibited a strong emission in THF. The emission intensity gradually decreased when the fw was varied from 0% to 99% (1.02% quantum yield in 99% fw). This might be due to the strong intermolecular π–π interactions of DP2NC in the aggregated state. The DP2NC emission was almost completely quenched in the aggregated state, compared to DP1NC. These results indicate that DP2NC molecules might be strongly packed in the aggregated state (which was confirmed by the single crystal X-ray studies and is explained in later sections). These two DPNC luminogens are structurally similar to DTNC luminogens with the only difference being the phenyl (DPNC) or thiophene (DTNC) bridge between the NC and DBF moieties. Thus, it can be concluded that the thiophene bridge moiety plays a crucial role to achieve weak emission in THF in the DTNC luminogens; the AIE property can depend on the substitution and also their position on the parent molecule.46 Using FE-SEM and DLS measurements, it was confirmed that DT1NC and DT2NC (Fig. S5, ESI†) formed nano-aggregates in 99% water. The FE-SEM images confirmed the presence of nanoparticles (∼160 nm for both luminogens) that were further confirmed by DLS studies in 99% water. These results gave the size distribution of ∼180 nm for DT1NC and ∼175 nm for DT2NC.
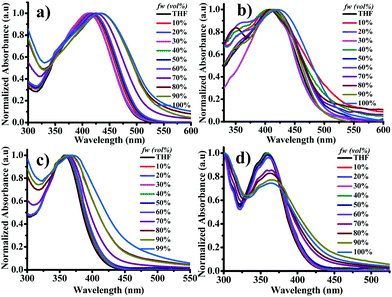 | ||
| Fig. 3 UV-visible spectra of (a) DT1NC, (b) DT2NC, (c) DP1NC and (d) DP2NC in THF and water mixtures. | ||
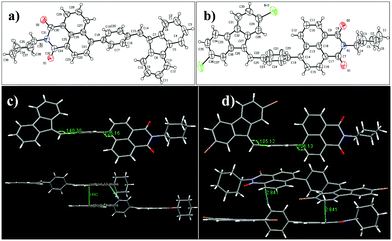
The geometry and crystal packing of the DPNC luminogens were obtained from the single crystal X-ray measurements. These results were utilized to explore the AIEE active or inactive nature of the luminogens. Unfortunately, single crystals of the DTNC luminogens were not obtained, but DPNC luminogen single crystals were obtained by slow evaporation from chloroform. Fig. 5 shows the ORTEP diagrams of the DPNC luminogens, where both the luminogens exhibited non-planarity. In both luminogens the phenyl ring is located in one plane and the remaining two groups (DBF and NC moieties) are in another plane. The torsion angles of both luminogens are almost same, i.e., between DBF and phenyl the angle was 140.30° for DP1NC and 105.12° for DP2NC. Similarly, torsion angles between phenyl and NC are 125.16° for DP1NC and 106.13° for DP2NC. However, the arrangement of the DBF moiety is different compared to that of the NC moiety. The DBF moiety is opposite to NC (like trans to NC) for DP1NC and at the same side (like cis to NC) for DP2NC. These slight structural changes likely occurred because of the bromine atoms. However, these minor structural arrangements highly affected the crystal packing as well as the photophysical properties. As shown in Fig. 5, the two DP2NC luminogens are strongly packed by the C–H⋯π (2.841 Å) intermolecular interactions. Similarly, two adjacent molecules of DP1NC are tightly packed by the C–H⋯O (2.703 Å) intermolecular interactions. This could efficiently quench the fluorescence in the aggregated state, suggesting that DPNC luminogens are AIEE inactive. The crystal studies strongly suggest that C–H⋯π and C–H⋯O interactions might be promoting an increase in the non-radiative deactivation.
Density functional theory (DFT) calculations
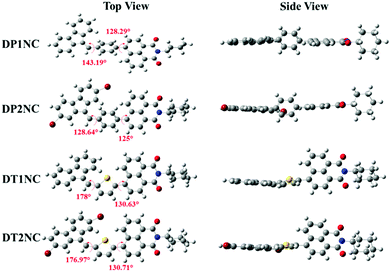
The density functional theory (DFT) calculations were carried out using Gaussian09 A.02 software package47 B3LYP/6-31g (d,p) basis set48 to understand the structural property of the luminogens. Fig. 6 shows the optimized molecular structures of the luminogens. It is clearly visible that all the luminogens are non-planar structures. In the DTNC luminogens, the DBF and thiophene moieties were almost in one plane, with torsion angles of 178.00° for DT1NC and 176.97° for DT2NC, while the non-planar NC moiety had torsion angles of 130.63° between thiophene and NC for DT1NC and 130.71° for DT2NC. Therefore, because of the non-planarity of these luminogens, they cannot come close together. This might be the reason for achieving high fluorescence in the aggregated state. These half planar molecules highly favor their self-arrangement to form ladder-type structures, which is quite common for the J-type aggregation in the solid or aggregated state. This might be the reason for the red-shift in the emission spectra from THF to 99% fw. The torsion angles of both DTNC luminogens are nearly similar to each other.On the contrary, in DPNC luminogens, the DBF and NC moieties are in one plane while the phenyl ring bridge is in another. The optimised structures and crystal structures are quite similar to each other. The torsion angles between DBF and the phenyl moieties are 143.19° for DP1NC and 128.64° for DP2NC, and the phenyl and NC moieties are 128.29° for DP1NC and 125.00° for DP2NC. In both DPNC luminogens, the torsion angles between phenyl and NC are almost similar. However, surprisingly, the torsion angles between DBF and phenyl are different and the arrangement of the DBF moiety is also different with respect to the NC moiety. The DBF moiety is arranged trans to NC for DP1NC but in DP2NC the DBF moiety shifted to cis position. These opposite structural arrangements likely occurred because of the two bromine atoms, which are present in DP2NC. On comparing DTNC with the DPNC luminogens, it can be observed that the DPNC luminogens have almost planar structures except the phenyl ring, which reduces the emission intensity in the aggregated state. However, as seen in Fig. 6, the DTNC luminogens are not in one plane, and therefore, there is no possibility for them to come closer, which results in higher PL emission in the aggregated state. The molecular orbital distributions of HOMO and LUMO structures of the luminogens are given in Fig. 7 and their energy levels are tabulated in Table 2. The HOMO electron clouds are mainly located on DBF and thiophene or phenyl moieties because of their electron donating capacity, and the LUMO electron clouds are dominated on the acceptor (NC) moiety. The time-dependant density functional theory (TD-DFT) calculations were carried out using a CAM-B3LYP/6-31g(d,p) basis set49 to find out the UV absorption transitions of all luminogens. The TD-DFT data suggested two transitions for DTNC luminogens at 302 & 323 and 403 & 399 nm for DT1NC and DT2NC, respectively. The peaks at lower wavelength are attributed to the π–π* transition and the second set of peaks at the higher wavelength region are due to ICT from the donor to acceptor. One major transition observed for both DP1NC and DP2NC at 339 and 328 nm, respectively, is due to the π–π* transition. Compared to the non-brominated samples, the brominated luminogens were blue-shifted. These results strongly supported the notion that bromine atoms acted as the weak electron withdrawing groups in both DT2NC and DP2NC. It is also observed that the ICT peak intensity was increased for DT2NC compared to that of DT1NC. Simultaneously, the π–π* transition decreased for DT2NC compared to that of DT1NC because of the bromine atoms, which are known to reduce the electron donating capacity of the DBF moiety.
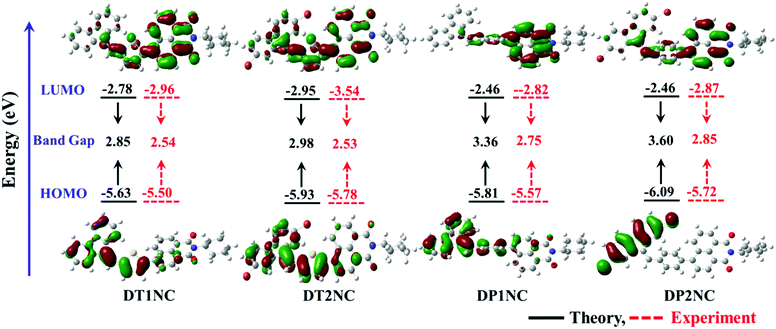 | ||
| Fig. 7 The frontier orbital plots of the HOMO and LUMO levels and the comparison energy levels estimated from the theoretical data and electrochemical data of DT1NC, DT2NC, DP1NC and DP2NC. | ||
| Monomers | Electrochemical potentials and energy levels | DFT data [eV] | ||||||
|---|---|---|---|---|---|---|---|---|
| E ox [eV] | E Red [eV] | E HOMO [eV] | E LUMO [eV] | E g [eV] | HOMO | LUMO | H–L gap | |
| DT1NC | 0.92 | −1.44 | −5.5 | −2.96 | 2.54 | 5.63 | 2.78 | 2.85 |
| DT2NC | 1.38 | −1.14 | −5.78 | −3.54 | 2.53 | 5.93 | 2.95 | 2.98 |
| DP1NC | 1.17 | −1.58 | −5.57 | −2.82 | 2.75 | 5.81 | 2.46 | 3.36 |
| DP2NC | 1.32 | −1.53 | −5.72 | −2.87 | 2.85 | 6.09 | 2.46 | 3.60 |
Electrochemical properties
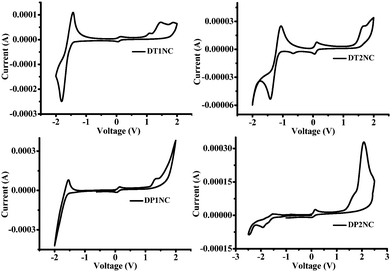
To investigate the highest occupied molecular orbital (HOMO) and lowest unoccupied molecular orbital (LUMO) energy levels of the four luminogens, cyclic voltammetry (CV) was performed in the drop-cast solid films. The CV curves of luminogens are displayed in Fig. 8 and the electrochemical data are listed in Table 2. As shown in Fig. 8, all the luminogens displayed two potential peaks and quasi-reversible reduction waves. This might be due to the electron deficient NC moiety. The HOMO and LUMO energies were estimated by substituting the onset reduction and onset oxidation peak values in ELUMO = −[(Ered − E1/2(ferrocene)) + 4.8 eV], EHOMO = −[(Eox − E1/2(ferrocene)) + 4.8 eV]. The CV and theoretical calculations reveal that the band gaps between HOMO and LUMO are less in DTNC luminogens than in DPNC luminogens. This is due to the greater electron donating capacity of the thiophene bridge-substituted DBF moiety.Thermal properties of the luminogens
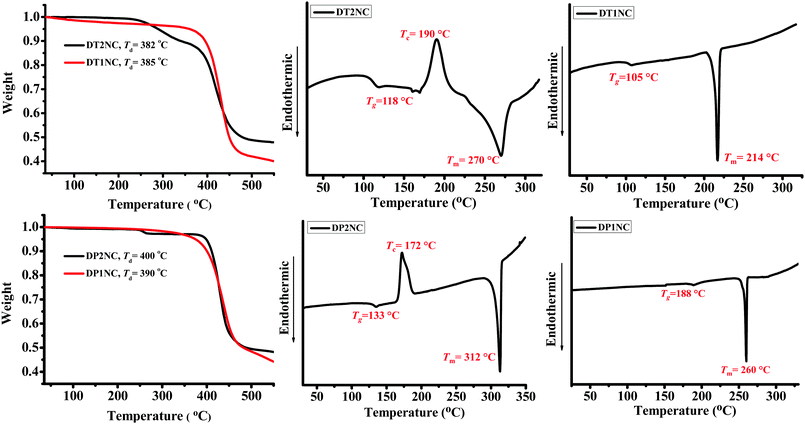
The thermal properties of the four luminogens were studied by thermogravimetric analysis (TGA) and differential scanning calorimetry (DSC), and the curves are shown in Fig. 9. Both the experiments were performed under nitrogen atmosphere with a 10 °C min−1 heating rate. According to the TGA study, all the luminogens exhibited good thermal stability up to 382–400 °C, i.e., no weight loss at low temperatures. The brominated luminogens (i.e., DT2NC and DP2NC) showed a two-step degradation: first degradation step for the bromine moiety loss and second for the aromatic backbone. The remaining two luminogens (i.e., DT1NC and DP1NC) showed a single-step degradation. The DSC analysis revealed that all the luminogens exhibited high melting points (Tm) at 312 °C, 270 °C, 214 °C and 260 °C for DP2NC, DT2NC, DT1NC and DP1NC, respectively. The glass transition temperatures (Tg) during the second heating scan for all the luminogens were 133 °C, 118 °C, 105 °C and 188 °C for DP2NC, DT2NC, DT1NC and DP1NC, respectively. Similarly, during the second heating scan, the crystallization temperatures (Tc) for brominated luminogens were observed at 172 °C for DP2NC and 190 °C for DT2NC. These results strongly suggest that the four luminogens exhibited good morphological stability.Conclusion
To summarize, we have demonstrated that the photophysical and the thermal properties of the organic materials are highly dependent as well as precisely controlled by their core structures. Two novel thiophene bridge substituted AIEE active (DT1NC and DT2NC) and two phenyl substituted inactive bridge (DP1NC and DP2NC) luminogens based on the 1,8-naphthalimide and mono-substituted dibenzofulvene derivatives were reported. Thiophene bridge substituted luminogens exhibited strong emission with high fluorescence quantum yields of 84.10% and 65.65% and a large bathochromic shift of 35 nm and 112 nm for DT1NC and DT2NC, respectively, in their aggregated state because of the ladder type J-aggregation. The theoretical and experimental results concluded that both DP1NC and DP2NC luminogens were AIE inactive. All luminogens are structurally similar, yet the photophysical properties of the luminogens predominantly depended on the bridge between DBF and NC. In addition, the fluorescence emission color could be precisely tuned through the entire visible range (blue to red) by changing the bridge between DBF and NC. The thiophene bridge moiety played a major role in achieving such a unique phenomenon. Furthermore, the heavy atom effect was successfully studied on novel donor–bridge–acceptor luminogens by introducing bromine atoms on the DBF moiety. All the luminogens exhibited excellent positive solvatochromism. The experimental and theoretical studies strongly supported that these color-tunable luminogens could contribute significantly in the field of OLEDs and multicolor bio-imaging applications.Conflicts of interest
There are no conflicts to declare.Acknowledgements
The authors acknowledge the Department of Science and Technology (DST), New Delhi, (No. DST/SERB/EMR/2014/000034), (No. DST/TSG/PT/2009/23), the DST-Max Planck Society, Germany (No. IGSTC/MPG/PG(PKI)/2011A/48) and the Department of Electronics & Information Technology, (DeitY) No. 5(9)/2012-NANO (Vol. II) for their financial support. The Central Instruments Facility, IIT Guwahati, is acknowledged for instrumental facilities.References
- M. Shimizu, R. Kaki, Y. Takeda, T. Hiyama, N. Nagai, H. Yamagishi and H. Furutani, Angew. Chem., Int. Ed., 2012, 51, 4095–4099 CrossRef CAS PubMed.
- L. Yao, S. T. Zhang, R. Wang, W. J. Li, F. Z. Shen, B. Yang and Y. G. Ma, Angew. Chem., Int. Ed., 2014, 53, 2119–2123 CrossRef CAS PubMed.
- W. Z. Yuan, P. Lu, S. M. Chen, J. W. Y. Lam, Z. M. Wang, Y. Liu, H. S. Kwok, Y. G. Ma and B. Z. Tang, Adv. Mater., 2010, 22, 2159–2163 CrossRef CAS PubMed.
- W. Z. Yuan, Y. Q. Tan, Y. Y. Gong, P. Lu, J. W. Y. Lam, X. Y. Shen, C. F. Feng, H. H. Y. Sung, Y. W. Lu, I. D. Williams, J. Z. Sun, Y. M. Zhang and B. Z. Tang, Adv. Mater., 2013, 25, 2837–2843 CrossRef CAS PubMed.
- W. Qin, D. Ding, J. Z. Liu, W. Z. Yuan, Y. Hu, B. Liu and B. Z. Tang, Adv. Funct. Mater., 2012, 22, 771–779 CrossRef CAS.
- H. Kobayashi, M. Ogawa, R. Alford, P. L. Choyke and Y. Urano, Chem. Rev., 2010, 110, 2620–2640 CrossRef CAS PubMed.
- X. Q. Zhang, X. Y. Zhang, S. Q. Wang, M. Y. Liu, L. Tao and Y. Wei, Nanoscale, 2013, 5, 147–150 RSC.
- K. Li, Y. H. Jiang, D. Ding, X. H. Zhang, Y. T. Liu, J. L. Hua, S. S. Feng and B. Liu, Chem. Commun., 2011, 47, 7323–7325 RSC.
- M. Zhang, M. X. Yu, F. Y. Li, M. W. Zhu, M. Y. Li, Y. H. Gao, L. Li, Z. Q. Liu, J. P. Zhang, D. Q. Zhang, T. Yi and C. H. Huang, J. Am. Chem. Soc., 2007, 129, 10322–10323 CrossRef CAS PubMed.
- X. G. Gu, J. J. Yao, G. X. Zhang and D. Q. Zhang, Small, 2012, 8, 3406–3411 CrossRef CAS PubMed.
- J. Huang, X. Yang, X. J. Li, P. Y. Chen, R. L. Tang, F. Li, P. Lu, Y. G. Ma, L. Wang, J. G. Qin, Q. Q. Li and Z. Li, Chem. Commun., 2012, 48, 9586–9588 RSC.
- X. Y. Liu, D. R. Bai and S. N. Wang, Angew. Chem., Int. Ed., 2006, 45, 5475–5478 CrossRef CAS PubMed.
- S. A. Jenekhe and J. A. Osaheni, Science, 1994, 265, 765–768 CAS.
- Z. J. Ning and H. Tian, Chem. Commun., 2009, 5483–5495 RSC.
- W. Verbouwe, M. Van der Auweraer, F. C. De Schryver, J. J. Piet and J. M. Warman, J. Am. Chem. Soc., 1998, 120, 1319–1324 CrossRef CAS.
- J. D. Luo, Z. L. Xie, J. W. Y. Lam, L. Cheng, H. Y. Chen, C. F. Qiu, H. S. Kwok, X. W. Zhan, Y. Q. Liu, D. B. Zhu and B. Z. Tang, Chem. Commun., 2001, 1740–1741 RSC.
- Y. N. Hong, J. W. Y. Lam and B. Z. Tang, Chem. Soc. Rev., 2011, 40, 5361–5388 RSC.
- B. K. An, S. K. Kwon, S. D. Jung and S. Y. Park, J. Am. Chem. Soc., 2002, 124, 14410–14415 CrossRef CAS PubMed.
- L. F. Zhao, Y. L. Lin, T. Liu, H. X. Li, Y. Xiong, W. Z. Yuan, H. H. Y. Sung, I. D. Williams, Y. M. Zhang and B. Z. Tang, J. Mater. Chem. C, 2015, 3, 4903–4909 RSC.
- Y. Y. Yuan, C. J. Zhang, S. D. Xu and B. Liu, Chem. Sci., 2016, 7, 1862–1866 RSC.
- Z. F. Chang, L. M. Jing, B. Chen, M. S. Zhang, X. L. Cai, J. J. Liu, Y. C. Ye, X. D. Lou, Z. J. Zhao, B. Liu, J. L. Wang and B. Z. Tang, Chem. Sci., 2016, 7, 4527–4536 RSC.
- B. Z. Tang, H. Z. Chen, R. S. Xu, J. W. Y. Lam, K. K. L. Cheuk, H. N. C. Wong and M. Wang, Chem. Mater., 2000, 12, 213–221 CrossRef CAS.
- J. W. Chen, C. C. W. Law, J. W. Y. Lam, Y. P. Dong, S. M. F. Lo, I. D. Williams, D. B. Zhu and B. Z. Tang, Chem. Mater., 2003, 15, 1535–1546 CrossRef CAS.
- Z. Li, Y. Dong, B. X. Mi, Y. H. Tang, M. Haussler, H. Tong, Y. P. Dong, J. W. Y. Lam, Y. Ren, H. H. Y. Sung, K. S. Wong, P. Gao, I. D. Williams, H. S. Kwok and B. Z. Tang, J. Phys. Chem. B, 2005, 109, 10061–10066 CrossRef CAS PubMed.
- X. B. Du and Z. Y. Wang, Chem. Commun., 2011, 47, 4276–4278 RSC.
- Y. H. Jiang, Y. C. Wang, J. L. Hua, J. Tang, B. Li, S. X. Qian and H. Tian, Chem. Commun., 2010, 46, 4689–4691 RSC.
- G. H. Zhang, J. B. Sun, P. C. Xue, Z. Q. Zhang, P. Gong, J. Peng and R. Lu, J. Mater. Chem. C, 2015, 3, 2925–2932 RSC.
- P. Gopikrishna and P. K. Iyer, J. Phys. Chem. C, 2016, 120, 26556–26568 CAS.
- J. Liu, G. L. Tu, Q. G. Zhou, Y. X. Cheng, Y. H. Geng, L. X. Wang, D. G. Ma, X. B. Jing and F. S. Wang, J. Mater. Chem., 2006, 16, 1431–1438 RSC.
- G. L. Tu, C. Y. Mei, Q. G. Zhou, Y. X. Cheng, Y. H. Geng, L. X. Wang, D. G. Ma, X. B. Jing and F. S. Wang, Adv. Funct. Mater., 2006, 16, 101–106 CrossRef CAS.
- P. Gopikrishna, D. Das and P. K. Iyer, J. Mater. Chem. C, 2015, 3, 9318–9326 RSC.
- H. H. Lin, Y. C. Chan, J. W. Chen and C. C. Chang, J. Mater. Chem., 2011, 21, 3170–3177 RSC.
- Y. H. Li, Y. Q. Wu, J. Chang, M. Chen, R. Liu and F. Y. Li, Chem. Commun., 2013, 49, 11335–11337 RSC.
- N. Meher, S. R. Chowdhury and P. K. Iyer, J. Mater. Chem. B, 2016, 4, 6023–6031 RSC.
- N. Meher and P. K. Iyer, Nanoscale, 2017, 9, 7674–7685 RSC.
- G. F. Zhang, M. P. Aldred, W. L. Gong, C. Li and M. Q. Zhu, Chem. Commun., 2012, 48, 7711–7713 RSC.
- S. Mukherjee and P. Thilagar, Chem. Commun., 2013, 49, 7292–7294 RSC.
- R. M. Duke, E. B. Veale, F. M. Pfeffer, P. E. Kruger and T. Gunnlaugsson, Chem. Soc. Rev., 2010, 39, 3936–3953 RSC.
- Q. X. Hua, B. Xin, J. X. Liu, L. X. Zhao, Z. J. Xiong, T. Chen, Z. Q. Chen, C. Li, W. L. Gong, Z. L. Huang and M. Q. Zhu, Faraday Discuss., 2017, 196, 439–454 RSC.
- C. Y. Mei, G. L. Tu, Q. G. Zhou, Y. X. Cheng, Z. Y. Xie, D. G. Ma, Y. H. Geng and L. X. Wang, Polymer, 2006, 47, 4976–4984 CrossRef CAS.
- S. Hedstrom, P. Henriksson, E. Wang, M. R. Andersson and P. Persson, Phys. Chem. Chem. Phys., 2014, 16, 24853–24865 RSC.
- M. Pastore, E. Mosconi, F. De Angelis and M. Grätzel, J. Phys. Chem. C, 2010, 114, 7205–7212 CAS.
- D. W. Cho and D. W. Cho, New J. Chem., 2014, 38, 2233–2236 RSC.
- V. Wintgens, P. Valat, J. Kossanyi, L. Biczok, A. Demeter and T. Berces, J. Chem. Soc., Faraday Trans., 1994, 90, 411–421 RSC.
- P. C. Xue, B. Q. Yao, J. B. Sun, Q. X. Xu, P. Chen, Z. Q. Zhang and R. Lu, J. Mater. Chem. C, 2014, 2, 3942–3950 RSC.
- A. D. Shao, Z. Q. Guo, S. J. Zhu, S. Q. Zhu, P. Shi, H. Tian and W. H. Zhu, Chem. Sci., 2014, 5, 1383–1389 RSC.
- M. J. Frisch, G. W. Trucks, H. B. Schlegel, G. E. Scuseria, M. A. Robb, J. R. Cheeseman, G. Scalmani, V. Barone, B. Mennucci and G. A. Petersson, et al., Gaussian 09, revision D.01, Gaussian, Inc., Wallingford, CT, 2013 Search PubMed.
- A. D. Becke, J. Chem. Phys., 1993, 98, 1372–1377 CrossRef CAS.
- T. Yanai, D. P. Tew and N. C. Handy, Chem. Phys. Lett., 2004, 393, 51–57 CrossRef CAS.
Footnote |
| † Electronic supplementary information (ESI) available: Synthetic route of monomers, 1H, 13C NMR spectra, HRMS of all the synthesized compounds, crystal data of DP1NC and DP2NC, FE-SEM images and DLS curves of DT1NC and DT2NC and theoretical results of luminogens. CCDC 1525968 and 1525969. For ESI and crystallographic data in CIF or other electronic format see DOI: 10.1039/c7qm00357a |
| This journal is © the Partner Organisations 2017 |

