Polypyrrole nanostructures and their thermoelectric performance†
Lirong
Liang
abc,
Guangming
Chen
*a and
Cun-Yue
Guo
*b
aInstitute of Chemistry, Chinese Academy of Sciences, Beijing 100190, China. E-mail: chengm@iccas.ac.cn
bSchool of Chemistry and Chemical Engineering, University of Chinese Academy of Sciences, Beijing 100049, China. E-mail: cyguo@ucas.ac.cn
cSino-Danish Center for Education and Research/Sino-Danish College, University of Chinese Academy of Sciences, Beijing 100190, China
First published on 15th August 2016
Abstract
Controlled synthesis of various nanostructures of polypyrrole (PPy) and their thermoelectric performances have been reported. First, the controlled synthesis and morphological characterization of PPy nanostructures are systematically studied by adjusting the experimental parameters. The effects of oxidant type, oxidant concentration, polymerization period as well as reaction medium are examined. Then, the thermoelectric performances of the as-obtained PPy nanostructures are measured in detail. Finally, the level of doping is calculated by X-ray photoelectron spectra. The relation between PPy nanostructures and their thermoelectric performances has been discussed. The present study will benefit the development of novel organic thermoelectric materials by a morphological design strategy, will deepen our understanding towards structure–thermoelectric function relationship, and will be helpful for the future application of organic polymer thermoelectric materials.
Introduction
In recent years, organic thermoelectric materials mainly including polymers and their composites have witnessed a rapid progress, possibly due to their versatile advantages relative to the conventional inorganic thermoelectric materials, such as solution processability, low thermal conductivity (κ), low cost, light-weight, good flexibility and adjustable molecular structure.1–5 For example, by judicious combination with graphene nanosheets or carbon nanotubes (CNTs), organic polymers have been demonstrated to gain significant improvements in their thermoelectric performance.1–5 To date, the main polymers successfully applied in thermoelectric materials are conducting polymers, including poly(3,4-ethylenedioxythiophene) (PEDOT),6–13 polyaniline (PANI),14–19 polypyrrole (PPy),20–25etc. Generally, the thermoelectric performance is evaluated by a dimension-less thermoelectric figure of merit (ZT), ZT = S2σT/κ, where S, σ, and T are the Seebeck coefficient or thermopower, electrical conductivity and absolute temperature, respectively. Due to their low intrinsic thermal conductivity (0.1–0.5 W m−1 K−1), the thermoelectric performance of organic polymer materials has always been evaluated by the power factor (S2σ) to replace ZT.1–9 In a recent study, the power factor for the PANI/graphene/PANI/CNT composites with ordered molecular structure can reach as high as 1825 µW m−1 K−2.16Morphology tuning has been demonstrated to be an important and effective strategy to significantly enhance the thermoelectric performance of neat conducting polymers and their composites.1–4,26,27 Enwrapping of conducting polymers on the surfaces of inorganic nanoparticles, nanostructure evolution of conducting polymers and coating polymer nanostructures on inorganic nanoparticle surfaces may be three viable ways.2 By using the surface coating method, a series of composites with dramatically improved thermoelectric properties, such as PEDOT/graphene,7,8 PEDOT/carbon nanotubes (CNTs),9 PANI/graphene,14–16 PANI/CNTs,17 PPy/graphene20,21 and PPy/CNTs,22,28 have been successfully prepared. Compared with the above surface coating route, the research of the dependence of polymer nanostructure on the thermoelectric properties is very limited. Recently, we reported the tuning of thermoelectric performance by means of PEDOT nanostructure evolution.27 Very interestingly, both the electrical conductivity and the Seebeck coefficient follow the same order of bulk PEDOT without nanostructure < globular nanoparticle < nanorod < nanotube < nanofibre. In addition, via the interfacial adsorption-soft template polymerization process, we have constructed a three-dimensional (3D) network morphology composed of PPy nanowires adsorbed on the surfaces of graphene nanosheets, which displayed enhanced thermoelectric properties.20
PPy is one of the most important conducting polymers with a wide range of applications in anti-electrostatic coatings, biosensors, solid electrolytic capacitors, polymer batteries, etc.29–31 Because of its diverse advantages such as ease of synthesis, good electrical conductivity, low thermal conductivity, good environmental stability and low toxicity,32–34 PPy has been believed to be a promising candidate for thermoelectric materials.20–23 Unfortunately, the studies of PPy for thermoelectric applications are limited, when compared with other conducting polymers like PEDOT and PANI. Moreover, the dependence of PPy nanostructure on its thermoelectric performance is far from clear, although some progress has been made in the synthesis of PPy nanostructures.35–39 Indeed, in previous publications, emphasis has been put on the effects of surfactant type, monomer concentration and surfactant concentration.35–39 In contrast, the role of other factors such as the reaction medium has received little attention. Here, we report the in-depth controlled synthesis and thermoelectric performance of PPy nanostructures. Various PPy nanostructures with different morphologies are fabricated depending on the polymerization conditions, where the effects of polymerization time, oxidant concentration, oxidant type, as well as reaction medium have been investigated. Then, the thermoelectric properties of the nanostructures are systematically characterized. Finally, the level of doping is measured by X-ray photoelectron spectra (XPS). The relation between nanostructure morphology of PPy and thermoelectric performance has been discussed.
Experimental
Reagents
Pyrrole (chemical pure grade, purity ≥98.0%) was purchased from Sigma Aldrich. All of the other reagents, including ammonium peroxidisulfate (APS), iron chloride hexahydrate (FeCl3·6H2O), ferric sulfate (Fe2(SO4)3), cetyltrimethyl ammonium bromide (CTAB) and anhydrous ethanol (EtOH), are of analytical reagent (A.R.) grade. All the reagents were used as received in the preparation procedure without further purification.Preparation of PPy nanostructures
PPy was synthesized using a convenient chemical oxidative polymerization method, as shown in Scheme 1. In a typical synthesis procedure, 0.36 g of CTAB was dissolved first in 100 mL of de-ionized water to obtain a homogeneous aqueous solution. Then, pyrrole monomers (55 µL) were added dropwise into the above CTAB solution (3.6 g L−1, 20 mL) and ultrasonically treated for 10 min. Soon afterwards, the obtained dispersion was stirred electro-magnetically for 20 min at 0–5 °C. Subsequently, 4.4 mL of the pre-cooled aqueous solution of the oxidant (APS, Fe2(SO4)3 and FeCl3) was slowly dropped into the above mixture. Herein, the APS concentration (0.14 mol L−1, 0.21 mol L−1 or 0.28 mol L−1) and the reaction time (4 h, 8 h, 12 h or 24 h) were discussed in detail. When the oxidant of Fe3+ (Fe2(SO4)3 or FeCl3) was used, the concentration of Fe3+ was kept at 4 mol L−1 due to its weak oxidation ability. After that, the polymerization reaction was allowed to proceed for a certain period at 0–5 °C with constant stirring for 8 h. Finally, the resulting black precipitate was filtered, rinsed with ethanol and deionized water several times until the filtrate solution became colourless. The product was obtained after being dried under vacuum at 60 °C for 24 h. | ||
| Scheme 1 Schematic illustration showing the preparation process for the PPy nanostructures by chemical oxidation polymerization. | ||
In addition, the effect of the reaction medium (aqueous solution with or without ethanol) was also investigated. In these studies, the concentration and the volume of the CTAB solutions were set at 3.6 g L−1 and 20 mL, respectively. The volume ratio of H2O![[thin space (1/6-em)]](https://www.rsc.org/images/entities/char_2009.gif) :
:![[thin space (1/6-em)]](https://www.rsc.org/images/entities/char_2009.gif) EtOH was 3
EtOH was 3![[thin space (1/6-em)]](https://www.rsc.org/images/entities/char_2009.gif) :
:![[thin space (1/6-em)]](https://www.rsc.org/images/entities/char_2009.gif) 1 or 1
1 or 1![[thin space (1/6-em)]](https://www.rsc.org/images/entities/char_2009.gif) :
:![[thin space (1/6-em)]](https://www.rsc.org/images/entities/char_2009.gif) 1. The PPy product was obtained through the preparation route similar to the above with APS (0.21 mol L−1) as the oxidant and the reaction time of 8 h. For comparison, the PPy sample was prepared in pure EtOH solution under the same conditions as well. Detailed reaction parameters are summarized in Table 1.
1. The PPy product was obtained through the preparation route similar to the above with APS (0.21 mol L−1) as the oxidant and the reaction time of 8 h. For comparison, the PPy sample was prepared in pure EtOH solution under the same conditions as well. Detailed reaction parameters are summarized in Table 1.
| Number | 1 | 2 | 3 | 4 | 5 | 6 |
|---|---|---|---|---|---|---|
| Oxidant type | APS | APS | APS | APS | APS | APS |
| Oxidant concentration (mol L−1) | 0.14 | 0.14 | 0.14 | 0.21 | 0.21 | 0.28 |
| Polymerization time (h) | 8 | 12 | 24 | 4 | 8 | 8 |
| Reaction medium | H2O | H2O | H2O | H2O | H2O | H2O |
| PPy morphology | Curly nanowire | Curly nanowire | Curly nanowire | Curly nanowire | Curly nanowire | Curly nanowire |
| Diameter (nm) | 30–60 | 40–70 | 50–85 | 30–50 | 55–75 | 40–70 |
| Number | 7 | 8 | 9 | 10 | 11 |
|---|---|---|---|---|---|
| Oxidant type | Fe2(SO4)3 | FeCl3 | APS | APS | APS |
| Oxidant concentration (mol L−1) | 2 | 4 | 0.21 | 0.21 | 0.21 |
| Polymerization time (h) | 8 | 8 | 8 | 8 | 8 |
| Reaction medium | H2O | H2O | V(H2O![[thin space (1/6-em)]](https://www.rsc.org/images/entities/char_2009.gif) : :![[thin space (1/6-em)]](https://www.rsc.org/images/entities/char_2009.gif) EtOH) = 3 EtOH) = 3![[thin space (1/6-em)]](https://www.rsc.org/images/entities/char_2009.gif) : :![[thin space (1/6-em)]](https://www.rsc.org/images/entities/char_2009.gif) 1 1 |
V(H2O![[thin space (1/6-em)]](https://www.rsc.org/images/entities/char_2009.gif) : :![[thin space (1/6-em)]](https://www.rsc.org/images/entities/char_2009.gif) EtOH) = 1 EtOH) = 1![[thin space (1/6-em)]](https://www.rsc.org/images/entities/char_2009.gif) : :![[thin space (1/6-em)]](https://www.rsc.org/images/entities/char_2009.gif) 1 1 |
EtOH |
| PPy morphology | Scale-like | Cauliflower-like | Curly nanowire | Necklace-like | Scale-like |
| Diameter (nm) | — | — | 75–110 | 85–110 | — |
Morphological characterization, FTIR and XPS spectra
The morphology of the PPy nanostructures was directly observed using a HITACHI S-4800 scanning electron microscope with the acceleration voltage of 15 kV. The Fourier transform infrared (FTIR) spectra were collected using a Perkin-Elmer System 2000 FTIR spectrophotometer after 64 scans with a nominal resolution of 2 cm−1. The surface composition changes of the samples were analyzed using X-ray photoelectron spectroscopy (XPS, Thermo Scientific ESCALAB 250Xi).Measurements of thermoelectric performance
The PPy pellets used for thermoelectric measurements (electrical conductivity and Seebeck coefficient) were obtained by cold pressing the powder samples at 15 MPa. The electrical conductivities were measured using a Keithley 2000 Multimeter (Keithley Instruments Inc, USA) by a standard four point configuration method. The Seebeck coefficients were measured using a quasi-steady temperature differential method40 in a home-made apparatus described elsewhere.41 For the Seebeck coefficient measurement, the temperature gradient along the length of the sample (one end of the sample was heated) was determined through two thermocouples. The slope of the linear relationship between the thermoelectric voltage (ΔV) and the temperature difference (ΔT ≈ 10 K) was then used to calculate the Seebeck coefficient (S = −ΔV/ΔT). At least five samples were measured, and the average values were used.Results and discussion
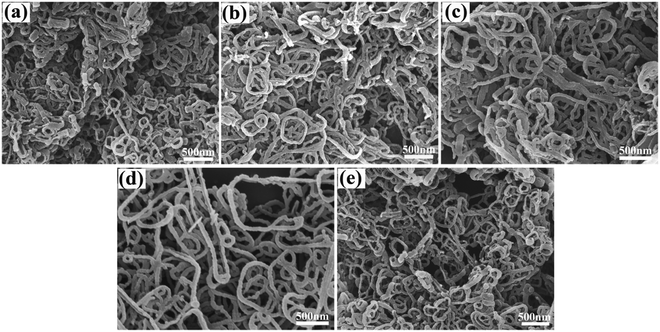
Scheme 1 shows a schematic illustration for the process of controlled preparation of the PPy nanostructures. In brief, after an aqueous solution of cetyltrimethyl ammonium bromide (CTAB) was obtained, the monomers of pyrrole were titrated in the solution. Under electro-magnetic stirring, the pyrrole monomers entered the micelles of CTAB. Then, an aqueous solution of the oxidant ammonium peroxidisulfate (APS) or iron chloride (FeCl3) or ferric sulfate (Fe2(SO4)3) was added. After that, polymerization was carried out at 0–5 °C for a certain period. Finally, the resulting black precipitant was rinsed several times, and dried under vacuum at 60 °C for 24 h. The detailed experimental parameters of the preparation procedure are illustrated in Table 1. The effects of polymerization time and oxidant concentration, oxidant type, as well as reaction medium on the product morphology are studied in detail. All of the FTIR spectra for the PPy samples prepared with different oxidizing agent type, oxidizing agent concentration and reaction medium are almost the same (Fig. S1, ESI†), suggesting the same molecular structure.The effect of polymerization time and oxidant concentration on the PPy morphology using APS as the oxidant and water as the reaction medium is evaluated: Fig. 1 displays the field-emission scanning electron microscopic (FESEM) images of the PPy nanowires synthesized using APS and water as the oxidant and reaction medium, respectively. The effects of polymerization time and the oxidant concentration are investigated. Distinctly, all of the products reveal curly nanowire morphology, suggesting that APS is an effective oxidant and water is a reasonable medium to achieve PPy nanowires. This is in good agreement with the previous publications.35–39 Furthermore, from Fig. 1(a)–(c), it can be seen that with the elongation of polymerization time at the APS concentration of 0.14 mol L−1, the diameter of the nanowires increases from 30–60 nm (Fig. 1(a)) to 50–85 nm (Fig. 1(c)). More interestingly, it is worth noting that the degree of the curly shape decreases as well. In other words, the nanowires become straight with increasing polymerization time. At other APS concentrations, such as 0.21 mol L−1, a similar phenomenon can be observed. A short polymerization period led to curly and thin nanowires in diameter, when comparing Fig. S2 (ESI†) (30–50 nm, 4 h) with Fig. 1(d) (55–75 nm, 8 h). And the nanowires with long polymerization time (8 h) shown in Fig. 1(d) are much straighter than those polymerized for 4 h presented in Fig. S2 (ESI†).
In addition, the oxidant concentration also greatly affects the morphology of PPy nanowires. At the same polymerization period of 8 h, the diameter of the nanowires prepared with the oxidant concentration of 0.21 mol L−1 is 55–75 nm (Fig. 1(d)), larger than that obtained with 0.14 mol L−1 (Fig. 1(a), 30–60 nm) and 0.28 mol L−1 (Fig. 1(e), 40–70 nm). On the other hand, the PPy nanowires shown in Fig. 1d are distinctly straighter than any of the other nanowires shown in Fig. 1. Therefore, we conclude that both the polymerization time and the oxidant concentration are major factors defining the final morphology of the PPy nanowires. With the increase of polymerization time, the diameter increases, and the degree of curly shape decreases. Additionally, when the other experimental parameters are set, the nanowires prepared at an oxidant concentration of 0.21 mol L−1 are thicker in diameter and straighter than those prepared at other concentrations in our experiments.
Effect of oxidant type on PPy morphology
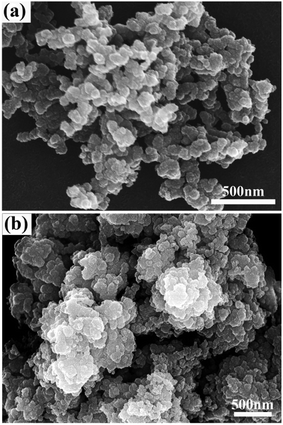
During the chemical oxidation polymerization of pyrrole monomers, APS, Fe2(SO4)3 and FeCl3 are three major oxidants. In the present study, they are employed and their effects on the product morphology are compared. In sharp contrast with the nanowires shown in Fig. 1, the application of the Fe3+ oxidant could not afford PPy nanowires under the present experimental conditions. Typical scale-like (or called globular) particles, characteristic of the conventional morphology for conducting polymers, are shown in Fig. 2(a) with the oxidant Fe2(SO4)3. When FeCl3 was used, a cauliflower-like morphology made up of small granular particles was observed (Fig. 2(b)). Note that the cauliflower-like morphology is seldom reported for PPy samples. Thus, the morphology of the final product also strongly depends on the oxidant type. APS is preferred to achieve PPy nanowires, while the use of Fe2(SO4)3 and FeCl3 as the oxidant in the chemical oxidative polymerization resulted in scale-like or cauliflower-like morphologies, respectively.Effect of reaction medium on PPy morphology
In the above investigations, water was used as the reaction medium. Fig. 3 shows the effect of reaction medium on the PPy morphology, where a mixture of water and ethanol (Fig. 3(a) and (b)), and pure ethanol (Fig. 3(c)) was applied. Fig. 3(a) reveals a curly-nanowire morphology similar to the images shown above in Fig. 1. This demonstrates that water and a mixture of water with ethanol at a high H2O![[thin space (1/6-em)]](https://www.rsc.org/images/entities/char_2009.gif) :
:![[thin space (1/6-em)]](https://www.rsc.org/images/entities/char_2009.gif) EtOH ratio (3
EtOH ratio (3![[thin space (1/6-em)]](https://www.rsc.org/images/entities/char_2009.gif) :
:![[thin space (1/6-em)]](https://www.rsc.org/images/entities/char_2009.gif) 1) can lead to the formation of PPy nanowires. However, when a mixture of water with ethanol at a low H2O
1) can lead to the formation of PPy nanowires. However, when a mixture of water with ethanol at a low H2O![[thin space (1/6-em)]](https://www.rsc.org/images/entities/char_2009.gif) :
:![[thin space (1/6-em)]](https://www.rsc.org/images/entities/char_2009.gif) EtOH ratio (1
EtOH ratio (1![[thin space (1/6-em)]](https://www.rsc.org/images/entities/char_2009.gif) :
:![[thin space (1/6-em)]](https://www.rsc.org/images/entities/char_2009.gif) 1) was employed, an unexpected necklace-like morphology can be observed in Fig. 3(b), which has not been reported previously in our survey for PPy morphology. If pure ethanol was used, a planar morphology composed of small particles was present (Fig. 3(c)). Based on these studies, we conclude that the oxidant type, oxidant concentration, polymerization period and reaction medium are also important factors defining the final morphology of the PPy products.
1) was employed, an unexpected necklace-like morphology can be observed in Fig. 3(b), which has not been reported previously in our survey for PPy morphology. If pure ethanol was used, a planar morphology composed of small particles was present (Fig. 3(c)). Based on these studies, we conclude that the oxidant type, oxidant concentration, polymerization period and reaction medium are also important factors defining the final morphology of the PPy products.
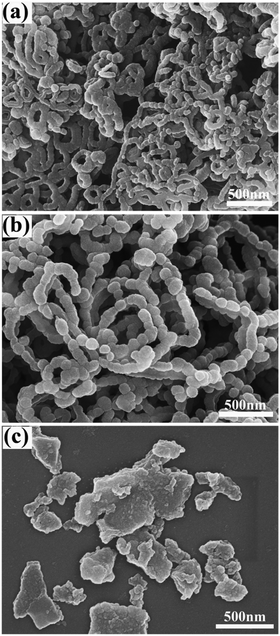 | ||
Fig. 3 FESEM images of PPy samples prepared in different reaction media: (a) and (b) a mixture of H2O![[thin space (1/6-em)]](https://www.rsc.org/images/entities/char_2009.gif) : :![[thin space (1/6-em)]](https://www.rsc.org/images/entities/char_2009.gif) EtOH with a volume ratio of (a) 3 EtOH with a volume ratio of (a) 3![[thin space (1/6-em)]](https://www.rsc.org/images/entities/char_2009.gif) : :![[thin space (1/6-em)]](https://www.rsc.org/images/entities/char_2009.gif) 1 or (b) 1 1 or (b) 1![[thin space (1/6-em)]](https://www.rsc.org/images/entities/char_2009.gif) : :![[thin space (1/6-em)]](https://www.rsc.org/images/entities/char_2009.gif) 1; (c) pure EtOH. 1; (c) pure EtOH. | ||
Thermoelectric performance of PPy with different nanostructures
On the basis of the above-performed investigations of controlled synthesis of PPy nanostructures, the dependence of PPy nanostructures on their thermoelectric performance is systematically studied. Fig. 4 presents the electrical conductivities, the Seebeck coefficients and the power factors for PPy nanostructures prepared with different oxidants. The related morphologies correspond to curly nanowires (Fig. 1(d)), and scale-like (Fig. 2(a)) and cauliflower-like (Fig. 2(b)) PPy samples. The electrical conductivity for the nanowires is obviously much larger than any of the other products. The Seebeck coefficient follows the sequence of the scale-like particle < nanowire < cauliflower-like particle. As a result, the power factor for the PPy nanowires is the largest, for the scale-like particle is the lowest, while for the cauliflower-like sample is in the middle. In previous research for PEDOT nanostructures including globular particles, nanorods, nanotubes and nanofibres, the conductivity and the power factor are the largest for the nanofibres.27 This is in good agreement with the present study. As for the Seebeck coefficient of the cauliflower-like sample, the mechanism is still not clear and needs further investigation.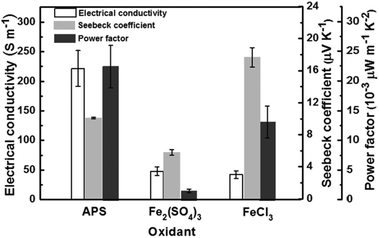 | ||
| Fig. 4 Thermoelectric performance of electrical conductivity, Seebeck coefficient and power factor for PPy prepared with different oxidants. | ||
Fig. 5 displays the thermoelectric properties for the PPy nanowires synthesized at different APS concentrations. The corresponding FESEM images have been shown in Fig. 1(a), (d) and (e), respectively. At a low APS concentration of 0.14 mol L−1, all of the electrical conductivity, the Seebeck coefficient and the power factor are the lowest. At the medium concentration of 0.21 mol L−1, the thermoelectric performance reaches the maximum. The electrical conductivity, the Seebeck coefficient and the power factor are 221.7 ± 30.2 S m−1, 10.1 ± 0.1 µV K−1, and (22.6 ± 3.6) × 10−3 µW m−1 K−2, respectively. However, when the oxidant concentration increases further to 0.28 mol L−1, the thermoelectric performance decreases. All of these three samples display a curly nanowire morphology (shown in Fig. 1(a), (d) and (e)). The main morphological difference lies in the deviance of the diameter and the degree of the curve shape. Considering that the electrical conductivity of PPy nanowires42 or nanotubes43 always decreases with the diameter, it is reasonable to deduce that straighter nanowires of PPy tend to display larger electrical conductivity and Seebeck coefficient, and thus the higher power factor.
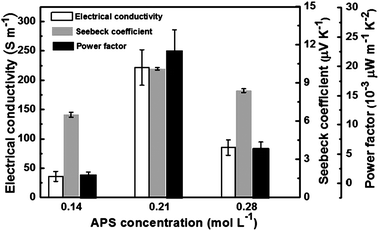 | ||
| Fig. 5 Thermoelectric performance of electrical conductivity, Seebeck coefficient and power factor for PPy nanowires prepared at different APS concentrations (the polymerization time was 8 h). | ||
The effect of the reaction medium on the PPy thermoelectric performance is presented in Fig. 6. Clearly, the application of water as the medium results in the largest thermoelectric performance for the straight and thick nanowires shown in Fig. 1(d). Indeed, both the electrical conductivity, and the power factor for the PPy nanowires prepared in water are the largest. In sharp contrast, if pure ethanol is used, the electrical conductivity and the Seebeck coefficient for the PPy planar morphology (Fig. 3(c)) are too low to be detected using the present instrument. When a mixture of water with ethanol was adopted, the thermoelectric properties for the curly PPy nanowires (Fig. 3(a)) and the necklace-like sample (Fig. 3(b)) are medium. Moreover, with the decrease of the volume ratio of water to ethanol, both the electrical conductivity and the power factor decrease. As for the Seebeck coefficients, no significant changes can be observed for the three samples prepared in water or a water–ethanol mixture. In other words, the electrical conductivity and the power factor depend much more on the PPy morphology compared to the Seebeck coefficient, and follow the sequence of straight wires > curly wires > necklace-like morphology > planar sample.
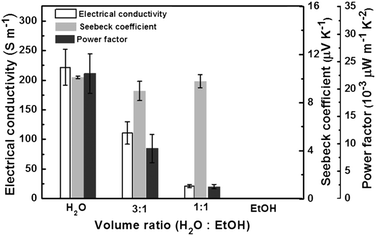 | ||
| Fig. 6 Thermoelectric performance of electrical conductivity, Seebeck coefficient and power factor for the PPy samples prepared in various reaction media. | ||
XPS spectra
In order to further study the mechanism of the thermoelectric performance, the doping behaviour of PPy nanostructures is investigated by XPS spectral analysis. Fig. 7 displays the N1s spectra and the fitting curves of the PPy nanowires prepared in water with different APS concentrations. Other PPy samples reveal similar shapes of the XPS spectra and the fitting curves. The strongest peak lies at 400.1 eV, possibly due to the neutral amine nitrogen (–NH–) of the pyrrole unit. The two peaks with higher bonding energies at around 401.4 and 402.4 eV are assigned to the positively-charged polaron (–NH+–) and bipolaron (![[double bond, length as m-dash]](https://www.rsc.org/images/entities/char_e001.gif) NH+–) structures, respectively.44,45 Additionally, the peak at low binding energy (398.3 eV) is attributed to the C
NH+–) structures, respectively.44,45 Additionally, the peak at low binding energy (398.3 eV) is attributed to the C![[double bond, length as m-dash]](https://www.rsc.org/images/entities/char_e001.gif) N defects of PPy.46,47 First, the positions of these peaks have not changed obviously. Then, the proportion of positively-charged nitrogen (N+/N ratio) was measured to evaluate the doping level of PPy, i.e. the ratio of sum areas of the –NH+– polaron and the
N defects of PPy.46,47 First, the positions of these peaks have not changed obviously. Then, the proportion of positively-charged nitrogen (N+/N ratio) was measured to evaluate the doping level of PPy, i.e. the ratio of sum areas of the –NH+– polaron and the ![[double bond, length as m-dash]](https://www.rsc.org/images/entities/char_e001.gif) NH+– bipolaron to the total area under the curve. As deduced from Fig. 7, the levels of doping for the nanowires obtained at APS concentrations of 0.14, 0.21 and 0.28 mol L−1 are 0.13, 0.23 and 0.19, respectively. Note that the straight and thick nanowires (FESEM image in Fig. 1(d)) prepared at 0.21 mol L−1 have the highest level of doping, which may contribute greatly to the enhancement of the thermoelectric performance. In addition, the curly nanowires prepared at a low concentration of 0.14 mol L−1 with more curly diameters (30–60 nm, FESEM image shown in Fig. 1(a)) possess a lower level of doping than that for the nanowires (40–70 nm in diameter, the FESEM image shown in Fig. 1(e)) obtained at a high concentration of 0.28 mol L−1.
NH+– bipolaron to the total area under the curve. As deduced from Fig. 7, the levels of doping for the nanowires obtained at APS concentrations of 0.14, 0.21 and 0.28 mol L−1 are 0.13, 0.23 and 0.19, respectively. Note that the straight and thick nanowires (FESEM image in Fig. 1(d)) prepared at 0.21 mol L−1 have the highest level of doping, which may contribute greatly to the enhancement of the thermoelectric performance. In addition, the curly nanowires prepared at a low concentration of 0.14 mol L−1 with more curly diameters (30–60 nm, FESEM image shown in Fig. 1(a)) possess a lower level of doping than that for the nanowires (40–70 nm in diameter, the FESEM image shown in Fig. 1(e)) obtained at a high concentration of 0.28 mol L−1.
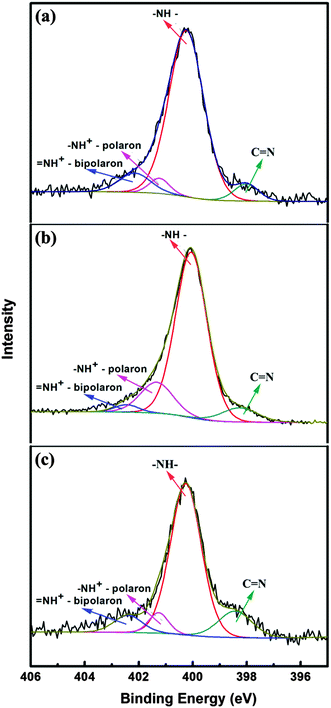 | ||
| Fig. 7 N 1s XPS spectra of PPy nanowires prepared at different APS concentrations: (a) 0.14 mol L−1, (b) 0.21 mol L−1 and (c) 0.28 mol L−1. | ||
Interestingly, the data in Fig. 7 suggest that the doping levels follow the same sequence of the thermoelectric performance. The reason may lie in that the doping level contributes greatly to the carrier concentration, which is a major factor in the enhancement of the thermoelectric performance. Thus, we deduce that straight nanowires of PPy tend to reveal improved thermoelectric performance.
As for the other nanostructure morphologies, they also display much lower levels of doping than that for the straight nanowires (Fig. 1(d)). Taking the effect of the unusual PPy necklace-like morphology (FESEM image shown in Fig. 3(b)) as an example, the doping level is only 0.14. The corresponding XPS spectra are displayed in Fig. S3(c) (ESI†). They are also distinctly less than the curly nanowires prepared using a 3![[thin space (1/6-em)]](https://www.rsc.org/images/entities/char_2009.gif) :
:![[thin space (1/6-em)]](https://www.rsc.org/images/entities/char_2009.gif) 1 water/ethanol mixture (FESEM image shown in Fig. 3(a)), with the doping level of 0.19 (measured from the XPS spectra displayed in Fig. S3(b), ESI†).
1 water/ethanol mixture (FESEM image shown in Fig. 3(a)), with the doping level of 0.19 (measured from the XPS spectra displayed in Fig. S3(b), ESI†).
Conclusions
The nanostructures of PPy have been conveniently and effectively tuned by adjusting the experimental conditions, and their thermoelectric performances are closely related to the nanostructure morphology. The PPy nanostructures strongly depend on the experimental parameters including oxidant type, oxidant concentration, polymerization period and the reaction medium. APS is preferred as the oxidant to afford curly nanowires, while scale-like and cauliflower-like morphologies are obtained when Fe2(SO4)3 and FeCl3 are chosen as the oxidant, respectively. With APS as the oxidant, the elongation of polymerization time tends to result in relatively straight and thick nanowires. In our experimental range, the APS concentration of 0.21 mol L−1 and the polymerization time of 8 h are the optimum reaction conditions to achieve straight and thick nanowires. However, the replacement of water with a mixture of water/ethanol or pure ethanol will lead to curly nanowires, necklace-like or even planar morphology for PPy. On the other hand, the nanostructures of PPy have a very close relation with their thermoelectric performances. The straight PPy nanowires display the best thermoelectric performances and simultaneously the highest level of doping; the curly nanowires show the medium thermoelectric performances. Other morphologies such as scale-like, cauliflower-like and necklace-like reveal the lowest thermoelectric performances. The present study sheds some light on the relation between PPy nanostructure and thermoelectric performances, providing a new strategy to improve the thermoelectric performance of organic polymer materials by judicious morphological control.Acknowledgements
We thank the National Natural Science Foundation of China (51573190, 51343005) for financial support. G. Chen acknowledges Youth Innovation Promotion Association, Chinese Academy of Sciences. Prof. Hanfu Wang at National Center for Nanoscience and Technology is acknowledged for helping us in the measurements of the Seebeck coefficients.Notes and references
- O. Bubnova, Z. U. Khan, H. Wang, S. Braun, D. R. Evans, M. Fabretto, P. Hojati-Talemi, D. Dagnelund, J.-B. Arlin, Y. H. Geerts, S. Desbief, D. W. Breiby, J. W. Andreasen, R. Lazzaroni, W. M. Chen, M. Zozoulenko, M. Fahlman, P. J. Murphy, M. Berggren and X. Crispin, Nat. Mater., 2014, 13, 190 CrossRef CAS PubMed.
- C. Gao and G. Chen, Compos. Sci. Technol., 2016, 124, 52 CrossRef CAS.
- M. L. Chabinyc, Nat. Mater., 2014, 13, 119 CrossRef CAS PubMed.
- A. M. Glaudell, J. E. Cochran, S. N. Patel and M. L. Chabinyc, Adv. Energy Mater., 2015, 5, 1401072 CrossRef.
- J. Xie, C.-e. Zhao, Z.-q. Lin, P.-y. Gu and Q. Zhang, Chem. – Asian J., 2016, 11, 1489 CrossRef CAS PubMed.
- K. Xu, G. Chen and D. Qiu, J. Mater. Chem. A, 2013, 1, 12395 CAS.
- Q. Jiang, C. Liu, J. Xu, B. Lu, H. Song, H. Shi, Y. Yao and L. Zhang, J. Polym. Sci., Part B: Polym. Phys., 2014, 52, 737 CrossRef CAS.
- K. Xu, G. Chen and D. Qiu, Chem. – Asian J., 2015, 10, 1225 CrossRef CAS PubMed.
- Z. Zhang, G. Chen, H. Wang and X. Li, Chem. – Asian J., 2015, 10, 149 CrossRef CAS PubMed.
- Y. Du, K. Cai, S. Chen, H. Wang, S. Z. Shen, R. Donelson and T. Lin, Sci. Rep., 2015, 5, 6411 CrossRef CAS PubMed.
- J. Wang, K. Cai and S. Shen, Org. Electron., 2015, 17, 151 CrossRef CAS.
- G. P. Moriarty, S. De, P. J. King, U. Khan, M. Via, J. A. King, J. N. Coleman and J. C. Grunlan, J. Polym. Sci., Part B: Polym. Phys., 2013, 51, 119 CrossRef CAS.
- T. Stocker, A. Kohler and R. Moos, J. Polym. Sci., Part B: Polym. Phys., 2012, 50, 976 CrossRef.
- L. Wang, Q. Yao, H. Bi, F. Huang, Q. Wang and L. Chen, J. Mater. Chem. A, 2015, 3, 7086 CAS.
- K. Xu, C. Gao, G. Chen and D. Qiu, Org. Electron., 2016, 31, 41 CrossRef CAS.
- C. Cho, B. Stevens, J.-H. Hsu, R. Bureau, D. A. Hagen, O. Regev, C. Yu and J. C. Grunlan, Adv. Mater., 2015, 27, 2996 CrossRef CAS PubMed.
- J. Liu, J. Sun and L. Gao, Nanoscale, 2011, 3, 3616 RSC.
- B. Endrodi, G. F. Samu, D. Fejes, Z. Nemeth, E. Horvath, A. Pisoni, P. K. Matus, K. Hernadi, C. Visy, L. Forro and C. Janaky, J. Polym. Sci., Part B: Polym. Phys., 2015, 53, 1507 CrossRef CAS.
- J. Wu, Y. Sun, W. Xu and Q. Zhang, Synth. Met., 2014, 189, 177 CrossRef CAS.
- Z. Zhang, G. Chen, H. Wang and W. Zhai, J. Mater. Chem. C, 2015, 3, 1649 RSC.
- S. Han, W. Zhai, G. Chen and X. Wang, RSC Adv., 2014, 4, 29281 RSC.
- J. Wang, K. Cai, S. Shen and J. Yin, Synth. Met., 2014, 195, 132 CrossRef CAS.
- M. Culebras, B. Riol, C. M. Gómez and A. Cantarero, Phys. Chem. Chem. Phys., 2015, 17, 15140 RSC.
- N. T. Kemp, A. B. Kaiser, H. J. Trodahl, B. Chapman, R. G. Buckley, A. C. Partridge and P. J. S. Foot, J. Polym. Sci., Part B: Polym. Phys., 2006, 44, 1331 CrossRef CAS.
- J. Wu, Y. Sun, W.-B. Pei, L. Huang, W. XU and Q. Zhang, Synth. Met., 2014, 196, 173 CrossRef CAS.
- W. Zhao, S. Fan, N. Xiao, D. Liu, Y. Y. Tay, C. Yu, D. Sim, H. H. Hng, Q. Zhang, F. Boey, J. Ma, X. Zhao, H. Zhang and Q. Yan, Energy Environ. Sci., 2012, 5, 5364 CAS.
- X. Hu, G. Chen, X. Wang and H. Wang, J. Mater. Chem. A, 2015, 3, 20896 CAS.
- L. Liang, C. Gao, G. Chen and C.-Y. Guo, J. Mater. Chem. C, 2016, 4, 526 RSC.
- L. X. Wang, X.-G. Li and Y.-L. Yang, React. Funct. Polym., 2001, 47, 125 CrossRef CAS.
- J. Ouyang and Y. Li, Polymer, 1997, 38, 3997 CrossRef CAS.
- C.-E. Zhao, J. Wu, S. Kjelleberg, J. S. C. Loo and Q. Zhang, Small, 2015, 11, 3440 CrossRef CAS PubMed.
- H.-M. Xiao and S.-Y. Fu, CrystEngComm, 2014, 16, 2097 RSC.
- W.-D. Zhang, H.-M. Xiao and S.-Y. Fu, Compos. Sci. Technol., 2012, 72, 1812 CrossRef CAS.
- H.-M. Xiao, W.-D. Zhang and S.-Y. Fu, Compos. Sci. Technol., 2010, 70, 909 CrossRef CAS.
- M. Wei, T. Dai and Y. Lu, Synth. Met., 2010, 160, 849 CrossRef CAS.
- J. Upadhyay and A. Kumar, Mater. Sci. Eng., B, 2013, 178, 982 CrossRef CAS.
- X. Zhang, J. Zhang, Z. Liu and C. Robinson, Chem. Commun., 2004, 1852 RSC.
- X. Zhang, J. Zhang, W. Song and Z. Liu, J. Phys. Chem. B, 2006, 110, 1158 CrossRef CAS PubMed.
- Y. Cui, Z. Wen, X. Liang, Y. Lu, J. Jin, M. Wu and X. Wu, Energy Environ. Sci., 2012, 5, 7893 CAS.
- J. Martin, T. Tritt and C. Uher, J. Appl. Phys., 2010, 108, 121101 CrossRef.
- A. Guan, H. Wang, H. Jin, W. Chu, Y. Guo and G. Lu, Rev. Sci. Instrum., 2013, 84, 043903 CrossRef PubMed.
- V. P. Menon, J. Lei and C. R. Martin, Chem. Mater., 1996, 8, 2382 CrossRef CAS.
- J. Jang and H. Yoon, Langmuir, 2005, 21, 11484 CrossRef CAS PubMed.
- S. D. A. S. Ramôa, G. M. O. Barra, C. Merlini, W. H. Schreiner, S. Livi and B. G. Soares, Appl. Clay Sci., 2015, 104, 160 CrossRef.
- P. M. Carrasco, M. Cortazar, E. Ochoteco, E. Calahorra and J. A. Pomposo, Surf. Interface Anal., 2007, 39, 26 CrossRef CAS.
- N. Wang, G. Li, Z. Yu, X. Zhang and X. Qi, Carbohydr. Polym., 2015, 127, 332 CrossRef CAS PubMed.
- C.-C. Hu and X.-X. Lin, J. Electrochem. Soc., 2002, 149, A1049 CrossRef CAS.
Footnote |
| † Electronic supplementary information (ESI) available: FTIR, FESEM images and XPS spectra. See DOI: 10.1039/c6qm00061d |
| This journal is © the Partner Organisations 2017 |

