DOI:
10.1039/C7QI00532F
(Research Article)
Inorg. Chem. Front., 2018,
5, 90-99
Simple and large-scale synthesis of β-phase molybdenum carbides as highly stable catalysts for dry reforming of methane†
Received
1st September 2017
, Accepted 24th October 2017
First published on 25th October 2017
Abstract
In this work, we propose a facile, fast and large-scale synthesis of β-Mo2C catalysts (about 100 grams). The current approach uses a simple solid mixture of (NH4)6Mo7O24·4H2O and carbon nanotubes (CNTs) as a precursor and employs a fast heating rate method without holding time. Moreover, there was no need for passivating the carbide products. A series of β-Mo2C/CNT catalysts (denoted as MoC-5, -15, -30 and -60) were successfully prepared from the precursors with the Mo content ranging from 5 to 60 wt% and their catalytic activities for dry reforming of methane (DRM) were evaluated. CH4-TPSR and CO2-TPO over the fresh samples proved that the abilities of CH4 dissociation and oxidation resistance of β-Mo2C were greatly enhanced by compositing with CNTs. It was also found that these abilities were dependent on the Mo content, the particle size and the interaction between β-Mo2C and CNTs. Among these β-Mo2C/CNT catalysts, MoC-30 showed the best catalytic stability for DRM, attributed to its high activity for CH4 dissociation and high resistance to oxidation. Additionally, it is worth noting that the catalytic stability of monometallic MoC-30 was found to be superior to that of bimetallic Ni/β-Mo2C (recently known to be an efficient non-noble metal catalyst for DRM).
1. Introduction
In recent decades, transition metal carbides have attracted much attention owing to their potential uses as substitutes for noble metal catalysts.1 Among them, molybdenum carbides have been one of the most widely studied carbides and they showed good activities in many reactions including Fischer–Tropsch synthesis,3,4 NO reduction,6 hydrotreating reactions,2 N2H4 decomposition,7 hydrogen evolution reaction,8,9 water–gas shift reaction5 and dry reforming of methane (DRM).10 Particularly for DRM, molybdenum carbide (β-Mo2C) catalysts displayed high activity and good resistance to coke formation because they have been recognized as redox catalysts in the reactions:10| | | β-Mo2C + 5CO2 = 2MoO2 + 6CO, | (1) |
| | | 2MoO2 + 5CH4 = β-Mo2C + 4CO + 10H2. | (2) |
Therefore, β-Mo2C catalysts have been studied extensively for DRM in recent years.10–22 However, it is worth noting that monometallic β-Mo2C catalysts can exhibit stable activity only at relatively high pressures.10,21 At atmospheric pressure, the rapid deactivation of these carbides occurred due to their oxidation by CO2.10,17,22 The consequence is the transformation of the β-Mo2C phase into the ineffective MoO2 phase. Therefore, it was reasonable to deduce that at atmospheric pressure the reaction of CO2 with β-Mo2C (reaction (1)) was more favourable than the reaction of CH4 with MoO2 (reaction (2)), which led to the final oxidation of β-Mo2C catalysts.
Subsequently, bimetallic Ni(Co)/β-Mo2C carbides were found to exhibit stable DRM activity at atmospheric pressure due to the synergic effect between the two metals.23–30 In bimetallic carbide systems, the role of Ni(Co) was to conduct the dissociation of CH4, while the activation of CO2 took place on β-Mo2C. It is worth pointing out that the molar ratio of Ni(Co) and Mo was very important for stabilizing the bimetallic carbide systems. If the ratio was higher, the CH4 dissociation was enhanced, which led to the formation of coke. Conversely, the lower ratio would facilitate the oxidation of β-Mo2C by CO2. An appropriate molar ratio of Ni(Co) and Mo was required to match the conversion rates of reactants CH4 and CO2, and then a catalytic oxidation–recarburization cycle (reactions (1) and (2)) can be well established. Unfortunately, the appropriate Ni(Co)/Mo ratio was highly dependent on reaction conditions. As for the Ni/β-Mo2C system with the Ni/Mo ratios from 1/10 to 1/1, the catalyst stability sequence was reported as Ni/β-Mo2C (1/2) > Ni/β-Mo2C (1/1) > Ni/β-Mo2C (1/3) at 800 °C with WHSV = 12![[thin space (1/6-em)]](https://www.rsc.org/images/entities/char_2009.gif) 000 cm3 g−1 h−1,28 while the catalyst stability followed the sequence Ni/β-Mo2C (1/10) ≈ Ni/β-Mo2C (1/5) > Ni/β-Mo2C (1/3) > Ni/β-Mo2C (1/2) at 850 °C with GHSV = 3800 h−1.23 It was hence highly desirable to develop a new design for a β-Mo2C catalyst that was resistant to coking and oxidation without the addition of a second metal for atmospheric DRM reaction.
000 cm3 g−1 h−1,28 while the catalyst stability followed the sequence Ni/β-Mo2C (1/10) ≈ Ni/β-Mo2C (1/5) > Ni/β-Mo2C (1/3) > Ni/β-Mo2C (1/2) at 850 °C with GHSV = 3800 h−1.23 It was hence highly desirable to develop a new design for a β-Mo2C catalyst that was resistant to coking and oxidation without the addition of a second metal for atmospheric DRM reaction.
In the case of the preparation method of β-Mo2C catalysts, there are two general methods, namely the temperature programmed reduction (TPR) of Mo oxide precursors using mixtures of hydrocarbons/hydrogen31 and the carbothermal (hydrogen) reduction of Mo oxide precursors using various solid-state carbon sources.22,32,33 However, the two methods mentioned above normally involve complicated steps as follows: (i) the dissolution of (NH4)6Mo7O24·4H2O; (ii) the drying and calcination of Mo precursors under air; (iii) the reduction of Mo oxide precursors by reducing gas and (iv) the passivation of the fresh β-Mo2C sample at low concentrations of O2 (typically <1%). On the other hand, the reduction processes usually involved a key stage using a low heating rate (e.g. <1 °C min−1) and involved a holding time (e.g. 2 h) at the final temperature. Furthermore, only a small amount (a few grams) of β-Mo2C catalysts can be produced. Thus, developing a facile method for large-scale synthesis was vital to promote the industrialization of β-Mo2C catalysts.
Herein, a facile, fast and large-scale synthesis of β-Mo2C catalysts was demonstrated and their catalytic activities were evaluated for DRM. The current approach was conducted just with a simple solid mixture of (NH4)6Mo7O24·4H2O and carbon nanotubes (CNTs) at an elevated temperature under an inert atmosphere and employed a fast heating rate (heating rate = 10 °C min−1) method without holding time and there was no need for passivating the as-prepared samples. In view of the simple preparation of precursors and solid–solid reaction without significant gas diffusion limitations, about 100 grams of β-Mo2C sample can be obtained with one reaction. More significantly, this type of monometallic β-Mo2C/CNT catalyst exhibited an even higher catalytic stability than the bimetallic Ni/β-Mo2C catalyst (recently known to be the most efficient carbide catalyst for atmospheric DRM reaction).
2. Experimental
2.1 Catalyst preparation
The carbon nanotubes (CNTs) used were multi-walled carbon nanotubes (purchased from Chengdu Organic Chemicals Co. Ltd). More information regarding the CNTs is listed in Table S1 (see the ESI†).
In this study, β-Mo2C was prepared simply in two steps. Firstly, the precursors for β-Mo2C were prepared by a mechanical mixing method through co-grinding (NH4)6Mo7O24·4H2O and carbon nanotubes (CNTs) with different Mo contents. Secondly, the precursor (∼110 g) was heated in a quartz reactor with an inner diameter of 80 mm from room temperature (RT) to 850 °C at a rate of 10 °C min−1 under an Ar flow (300 ml min−1), followed by cooling to RT under Ar. A series of products were obtained from the precursors with Mo contents of 5, 15, 30, 60 and 80 wt%, designated as MoC-c (c = 5, 15, 30, 60 and 80). In addition, the bulk β-Mo2C and bimetallic Ni/β-Mo2C (Ni/Mo = 1/2) were prepared according to previous studies,27,28 and the former was designated as MoC-100.
2.2 Catalyst characterization
X-ray diffraction (XRD) was conducted using an X-ray diffractometer (X'Pert Pro MPD) equipped with a Cu Kα source. X-ray photoelectron spectroscopy (XPS) was carried out using a Kratos Axis ultra (DLD) equipped with an Al Kα X-ray source. The binding energies (±0.2 eV) were referenced to the C 1s peak at 284.8 eV due to adventitious carbon. BET surface areas of the samples were measured by using a surface area analyzer (NOVA4200). TEM images were acquired using a transmission electron microscope (Philips Tecnai 10). Raman spectroscopy was performed using a Horiba/Jobin-Yvon LABRAM-HR spectrometer with the 632.8 nm line of a helium–neon laser as an excitation source. The process of carbothermal reduction was carried out under an Ar flow (50 ml min−1). The quadrupolar mass spectrometer QMS 403 D Aeolos was used for detection. Carbon dioxide temperature-programmed oxidation (CO2-TPO) and methane temperature-programmed surface reaction (CH4-TPSR) studies were performed using a flow of 2% CO2(CH4)/Ar (50 ml min−1). Prior to the reaction, the sample (0.1 g) was heated to 850 °C (650 °C) under Ar (H2), followed by cooling to RT under Ar, and then it was heated under the reactant gas from RT to 850 °C at a rate of 10 °C min−1. The evolution of gas-phase products during the reaction was monitored using gas chromatography (GC).
2.3 Catalyst performance tests
Catalytic performance of the as-prepared carbides for DRM was evaluated in a micro-reactor with an inner diameter of 10 mm at atmospheric pressure. Prior to the reaction, the carbide catalyst was pretreated at 850 °C (650 °C) under Ar (H2) for 30 min. After the pretreatment step, a stoichiometric mixture (CH4:CO2 = 1:1) was allowed to pass through the catalyst (60–80 mesh) with a WHSV of 9000–24000 cm3 g−1 h−1. The exit gas stream from the reactor was passed through a silica-gel dryer to remove water. The product gases (after removing water) were analyzed by on-line GC equipped with a thermal conductivity detector and a 3-m TDX-01 packed column. The conversions of CH4 and CO2, selectivities of H2 and CO, and carbon balance were defined as follows (ni,in = the initial molar fraction of component i in the feed, ni,out = the final molar fraction of component i in the gaseous effluent):
3. Results and discussion
3.1 Preparation and characterization of fresh molybdenum carbide samples
Fig. 1 shows the XRD patterns of fresh carbided 5–80 wt% Mo/CNT samples. For the sake of comparison, the XRD pattern of pure CNTs is also shown. For Mo contents of 5–60 wt%, the XRD patterns clearly showed the main diffraction peaks at 34.4, 38.0, 39.4, 52.1, 61.5 and 69.6° corresponding to the (100), (002), (101), (102), (110) and (103) reflections, respectively, of β-Mo2C (JCPDS 35-0787), besides the diffraction peaks due to CNTs themselves. The results indicated that these Mo precursors can be carbided by CNTs to molybdenum carbides. It was reasonable to observe that the diffraction peaks of CNTs on the carbided 5–60 wt% Mo/CNT samples became weaker and weaker with the increase of Mo content. When the Mo content increased to 80 wt%, no CNTs can be detected on the MoC-80 and the unreacted MoO2 phase (JCPDS 78-1069, the main diffraction peaks at 2θ = 26.0, 36.9, 53.1 and 53.5°) can be detected besides β-Mo2C. These facts suggested that the Mo content of 60 wt% was the maximum for the preparation of β-Mo2C by the current method. Moreover, it is worth noting that this method did not require the passivation step for preparing β-Mo2C. In the case of the preparation of bulk β-Mo2C (MoC-100), the used method was the traditional 20% CH4/H2-TPR route. As shown in Fig. 2, it was obvious that the passivation was a vital step in the TPR method and the fresh bulk β-Mo2C had to be oxidized after exposure to air where it did not suffer from passivation. It can be concluded from Fig. 1 and 2 that the β-Mo2C bonded with CNTs exhibited higher resistance to oxidation than bulk β-Mo2C. This might be due to the interaction between β-Mo2C and CNTs. Carbon materials usually showed poor electrical resistivity and good stability in chemical medium with a high specific surface area, which provided hindrance to the oxidation of nanoparticles.34,35
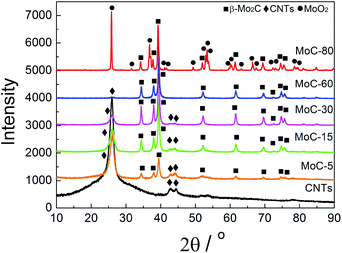 |
| | Fig. 1 XRD patterns of fresh carbided 5–80 wt% Mo/CNT samples as well as CNTs for comparison. | |
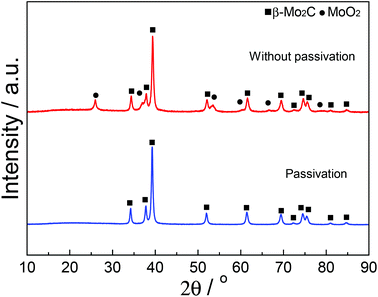 |
| | Fig. 2 XRD patterns of bulk β-Mo2C prepared by the TPR method with and without passivation. | |
Table 1 lists the textural properties of various samples obtained in this study. It was clear that the β-Mo2C/CNT composites showed different microstructures in comparison with bulk β-Mo2C. Furthermore, SBET, DP and VP were found to vary linearly with the Mo content. This suggested that the interaction between β-Mo2C and CNTs was dependent on the Mo content. Accordingly, the oxidation resistance of β-Mo2C might change with the Mo content.
Table 1 Textural properties of various samples obtained in this study
| Sample |
Mo content (wt%) |
S
BET (m2 g−1) |
D
P (nm) |
V
P (cm3 g−1) |
|
S
BET = BET surface area; DP = average pore diameter; VP = total pore volume. |
| CNTs |
0 |
99.7 |
59.24 |
1.48 |
| MoC-5 |
5 |
96.8 |
57.16 |
1.24 |
| MoC-15 |
15 |
80.7 |
55.46 |
0.97 |
| MoC-30 |
30 |
66.0 |
53.57 |
0.81 |
| MoC-60 |
60 |
43.6 |
52.68 |
0.67 |
| MoC-100 |
100 |
21.9 |
7.62 |
0.04 |
In order to further investigate the effect of the Mo content on the oxidation resistance of β-Mo2C in the carbided 5–60 wt% Mo/CNT samples, XPS analyses are conducted on the selected MoC-5, MoC-30 and MoC-60 samples. Fig. 3 shows the spectra of Mo 3d levels for MoC-5, MoC-30 and MoC-60 samples. By means of curve fitting, the corresponding distribution and concentration of Mo species are listed in Table 2. As shown in Fig. 3 and Table 2, the MoC-5, MoC-30 and MoC-60 samples displayed three surface Mo species. The peaks at a binding energy of 228.4 eV were assigned to the Mo 3d5/2 of Mo2+ (carbide),36,37 and the peaks at Mo 3d5/2 binding energies of 229.0–229.2 and 232.4–232.7 eV were due to Moδ+ (oxycarbide)38,39 and Mo6+ (oxide),39 respectively. These results indicated that more or less Mo carbides had been oxidized to Mo oxides or oxycarbides on the surfaces. It can be seen from Table 2 that the concentration of Mo2+ carbide (Mo6+ oxide) first increased (decreased) and then decreased (increased) with increasing Mo content from 5 to 60 wt%. Based on the data listed in Table 2, the oxidation resistance of β-Mo2C ranked in the order of MoC-30 > MoC-5 ≈ MoC-60.
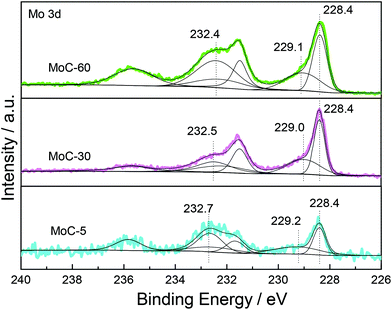 |
| | Fig. 3 XPS Mo 3d spectra of fresh MoC-5, MoC-30 and MoC-60 samples. | |
Table 2 XPS results for fresh MoC-5, MoC-30 and MoC-60 samples
| Sample |
Mo content (wt%) |
Mo 3d5/2 (eV) |
| Mo2+ carbide |
Moδ+ oxycarbide |
Mo6+ oxide |
| Binding energies (eV) and concentration (%) of Mo 3d5/2 species. |
| MoC-5 |
5 |
228.4 (29%) |
229.2 (30%) |
232.7 (41%) |
| MoC-30 |
30 |
228.4 (40%) |
229.0 (31%) |
232.5 (29%) |
| MoC-60 |
60 |
228.4 (32%) |
229.1 (25%) |
232.4 (43%) |
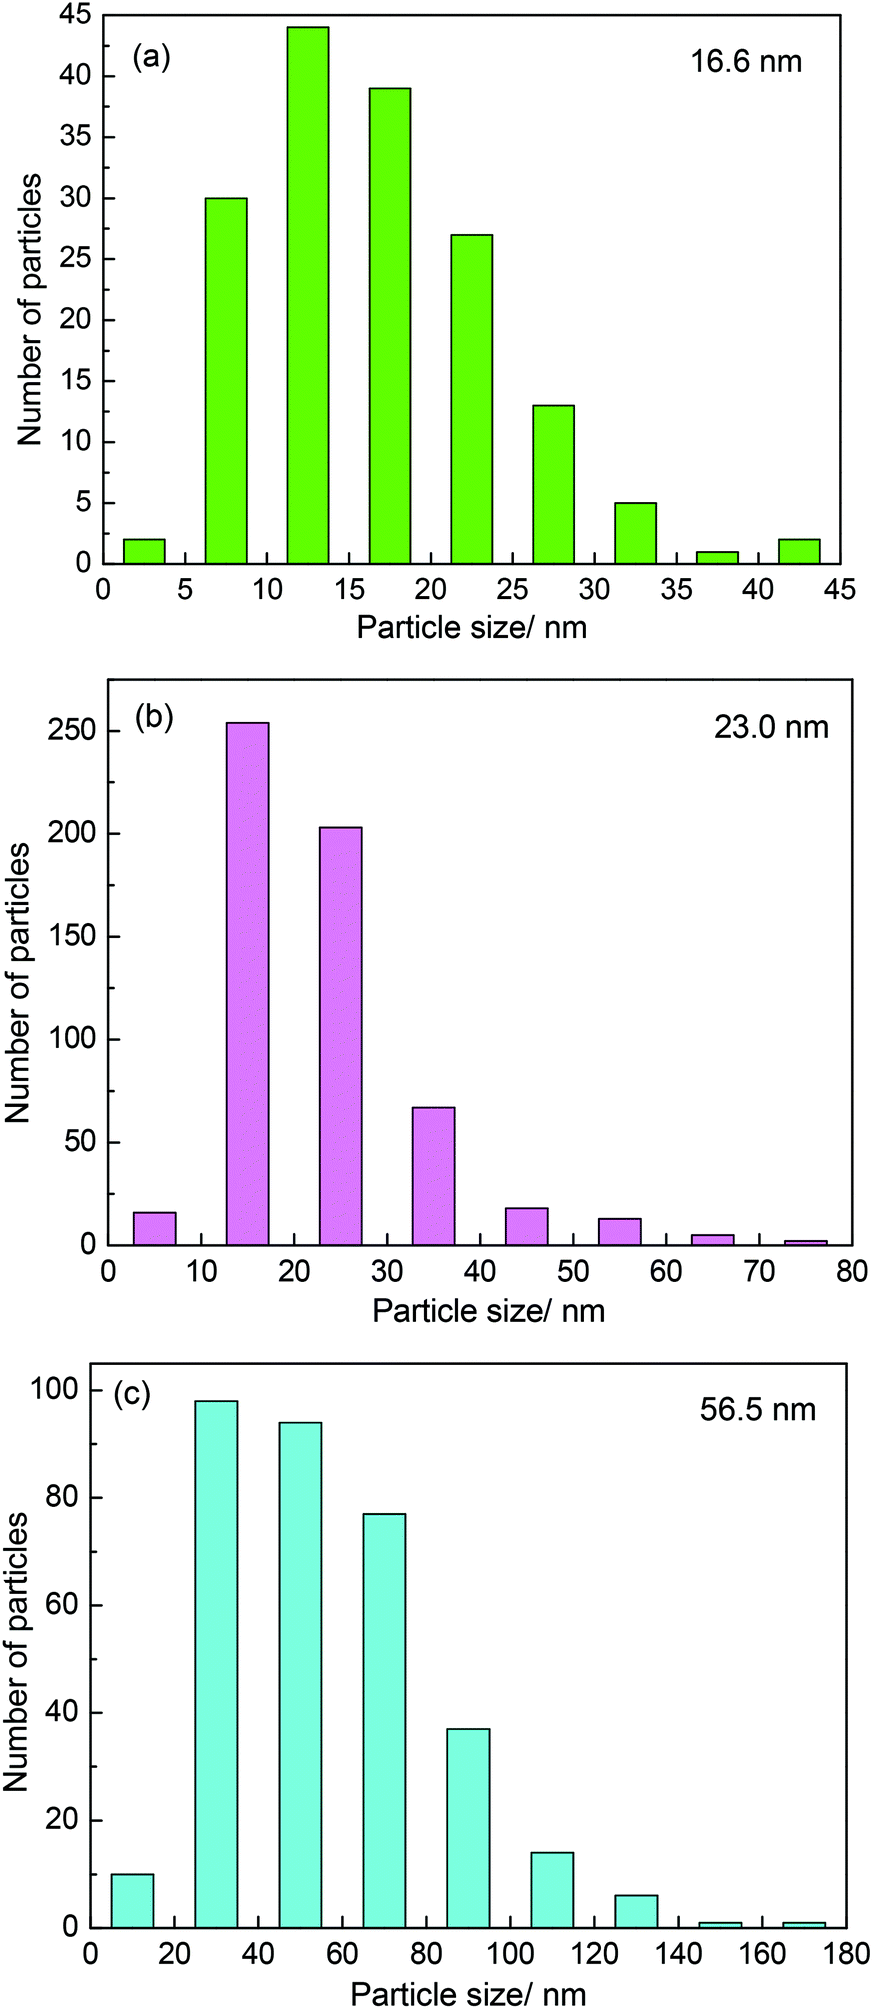
It was believed that the particle size effect and the interaction between particles and carbon materials were important factors for the tuning of the redox properties of particles.40 It can therefore be deduced that the two factors could affect the oxidation resistance of β-Mo2C. Fig. 4 shows the TEM images of the MoC-5, MoC-30 and MoC-60 samples. It was clear that irregular-shaped nanoparticles were well dispersed on CNTs. The insets in Fig. 4 clearly show the crystal lattice of β-Mo2C (100), which proved the existence of β-Mo2C in the corresponding samples. The size distributions of these nanoparticles in the MoC-5, MoC-30 and MoC-60 samples were determined by measuring the particle size directly from the TEM images (Fig. 4). It can be observed from Fig. 5 that the average particle size of β-Mo2C varied with the Mo content. It was 16.6 nm for MoC-5, 23.0 nm for MoC-30, and 56.5 nm for MoC-60, respectively. It was usually accepted that the bigger particles exhibited higher oxidation resistance due to their lower reactivity.40 Therefore, the oxidation resistance of β-Mo2C should follow the order of MoC-60 > MoC-30 > MoC-5 on the basis of the particle size effect. On the other hand, in order to gain insights into the interaction between β-Mo2C and CNTs, the carburization processes of Mo/CNT precursors were investigated by mass spectrometry (MS). In view of the fact that the Mo/CNT precursors were prepared by a mechanical mixing method, it was reasonable to deduce that the stronger the interaction between Mo and CNTs, the easier the formation of β-Mo2C was achieved via carbothermal reduction.
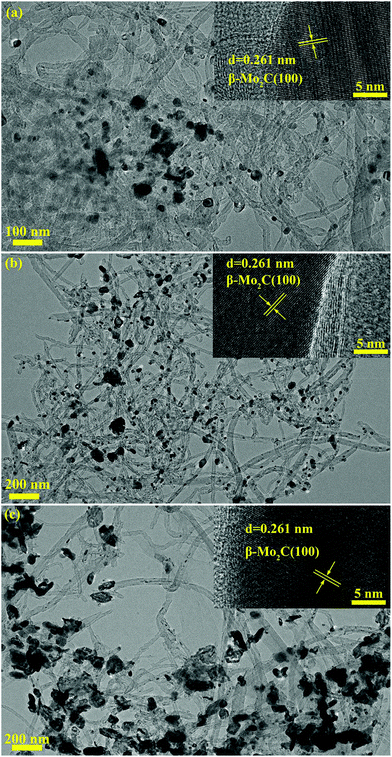 |
| | Fig. 4 TEM images of (a) MoC-5, (b) MoC-30 and (c) MoC-60 samples. The insets show the β-Mo2C (100) crystal lattices. | |
 |
| | Fig. 5 Particle size distributions of β-Mo2C nanoparticles in (a) MoC-5, (b) MoC-30 and (c) MoC-60. | |
As shown in Fig. 6, the temperature for COx evolution increased with the Mo content, indicating that the easiness in the formation of β-Mo2C ranked in the order of MoC-5 > MoC-30 > MoC-60. In other words, the interaction between β-Mo2C and CNTs should follow the same order. The ensemble of the TEM and MS results allowed us to deduce that the MoC-30 probably possessed more appropriate microstructures than MoC-5 and MoC-60, which showed that the β-Mo2C could display higher oxidation resistance. The deduction was in good agreement with the result of XPS (Table 2).
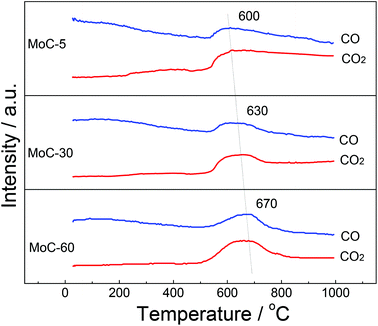 |
| | Fig. 6 MS profiles for the formation of β-Mo2C via carbothermal reduction. | |
3.2 Catalytic performances
The effect of the Mo content on the catalytic performance of β-Mo2C/CNTs for DRM was studied at 850 °C and atmospheric pressure. It was obvious from Fig. 7 that the catalyst stability was dependent on the Mo content. The MoC-30 catalyst showed higher stability and suffered from deactivation after a 13 h test period. On the other hand, rapid declines of performance were observed on MoC-5, MoC-15 and MoC-60 before 6 h. It is worth pointing out that there were very poor and even no DRM performances over CNTs and MoC-100, respectively, under similar reaction conditions. The initial activity of the CNTs was attributed to the multiple metal impurities (listed in Table S1†) that remained after the preparation process of the CNTs because the DRM activity can be negligible for almost pure multi-walled carbon nanotubes (metal impurity content = 0.001%), as suggested before.41 Therefore, it was clear that there was a synergistic effect between β-Mo2C and CNTs that facilitated the catalysis of β-Mo2C/CNT catalysts. In addition, it was found that the carbon balances were above 1.0 all the time except for the periods of deactivation. This was probably because the CNTs themselves were reacted directly with CO2 as well as the speed of the reaction between Mo2C and CO2 (reaction (1)) was faster than that between MoO2 and CH4 (reaction (2)), as proved later. In addition, the variation trend of CO selectivity was similar to that of the carbon balance and they both reflected catalyst oxidation in the DRM.
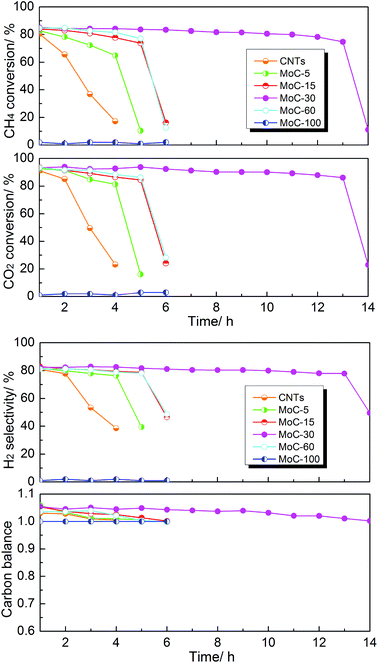 |
| | Fig. 7 Lifetime study of the Mo2C/CNT catalysts with various Mo contents in DRM (T = 850 °C, P = 1 atm, CH4/CO2 = 1, WHSV = 18000 cm3 g−1 h−1). | |
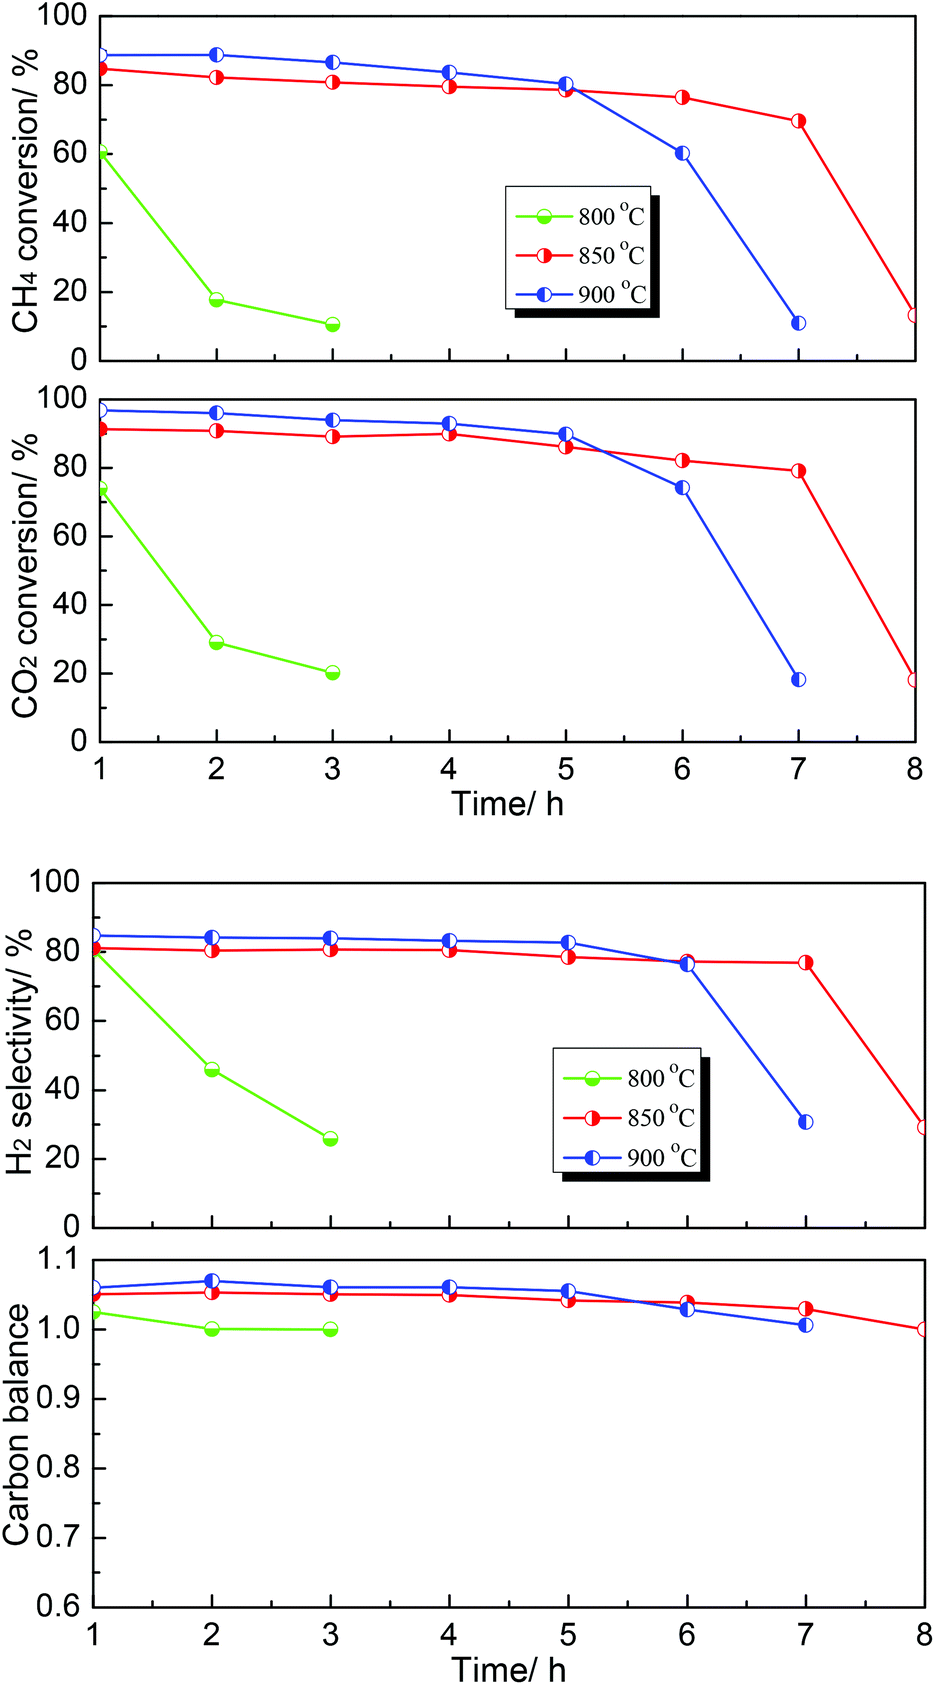
Subsequently, the effect of temperature on the DRM performance over the MoC-30 catalyst was further investigated and the results are shown in Fig. 8. It can be seen that the DRM performance of MoC-30 was greatly dependent on temperature. The catalytic stability was very low at 800 °C, however, it can be enhanced when the temperature rose above 800 °C. It was indicated that 850 °C was a relatively appropriate reaction temperature, at which the oxidation–recarburization cycle (β-Mo2C ⇄ MoO2) can be maintained for a longer time.
 |
| | Fig. 8 Dependence of catalytic performance on temperature over the MoC-30 catalyst (P = 1 atm, CH4/CO2 = 1, WHSV = 20400 cm3 g−1 h−1). | |
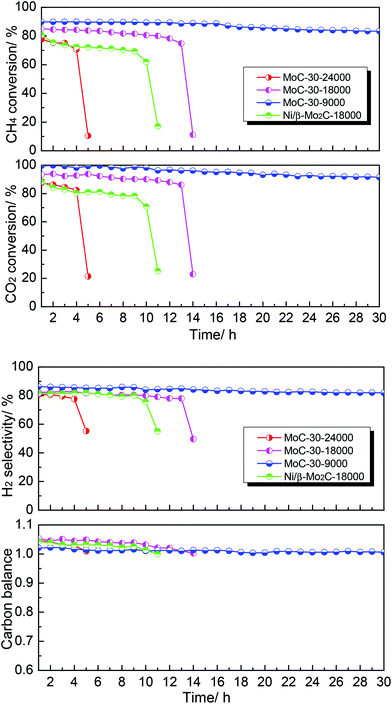
Finally, the effect of WHSV on the DRM performance over the MoC-30 catalyst was investigated (see Fig. 9). It was clear that WHSV had a vital effect on the DRM performance over the MoC-30 catalyst. On the one hand, the CH4 conversion, CO2 conversion and H2 selectivity increased but the carbon balance decreased with decreasing WHSV before rapid deactivation. On the other hand, it can be observed that the MoC-30 catalysts suffered from rapid deactivation with higher WHSV values. In the case of 24000 cm3 g−1 h−1, the CH4 conversion, CO2 conversion and H2 selectivity decreased respectively from 78%, 88% and 81% to 11%, 21% and 55% within a period of 5 h. As for 18000 cm3 g−1 h−1, they decreased respectively from 85%, 93% and 82% to 11%, 23% and 50% over a run of 14 h. Fortunately, as the WHSV was decreased to 9000 cm3 g−1 h−1, the MoC-30 catalyst showed a stable performance (83% CH4 conversion, 92% CO2 conversion and 82% H2 selectivity) throughout the test period of 30 h. At the same time, the catalytic performance of the MoC-30 catalyst for DRM was compared with that of the Ni/β-Mo2C catalyst (Ni/Mo = 1/2 was the optimized molar ratio28) under similar conditions. The results clearly indicated that even the monometallic MoC-30 catalyst showed both higher activity and stability than the bimetallic Ni/β-Mo2C catalyst. The next part of this paper was devoted to the characterization of these used MoC-30 catalysts, in order to gain insights into the deactivation mechanism of this new β-Mo2C/CNT catalyst for DRM.
 |
| | Fig. 9 The effect of WHSV on the DRM performance over MoC-30 and comparison of catalytic performance of MoC-30 and Ni/β-Mo2C (CH4/CO2 = 1, WHSV = 9000–24000 cm3 g−1 h−1, P = 1 atm, T = 850 °C). | |
3.3 Characterization of used molybdenum carbide samples
Oxidation and particle sintering were usually reported to be the main reasons for the deactivation of carbide catalysts in DRM.10,24 To understand the cause of the catalyst deactivation, XRD, Raman and TEM investigations were performed over the used MoC-30 catalysts. Fig. 10 shows the XRD patterns of MoC-30 used in DRM with a WHSV of 9000 and 18000 cm3 g−1 h−1 (designated as MoC-30-9000 and MoC-30-18000). Over the MoC-30-18000, we detected sharp diffraction lines due to the MoO2 phase and very weak peaks (2θ = 40.5, 58.6 and 73.7°) due to the Mo phase (JCPDS 42-1120). The β-Mo2C and CNT lines of the used sample can still be identified, but they were much lower in intensity than the fresh MoC-30 (see Fig. 1). The results indicated that the MoC-30-18000 had been oxidized to MoO2 after DRM reaction. The formation of a small amount of Mo might be due to the fact that MoO2 can be reduced by H2 to Mo during DRM.22 In contrast, it seems that there were no remarkable differences in the XRD patterns between MoC-30-9000 and fresh MoC-30.
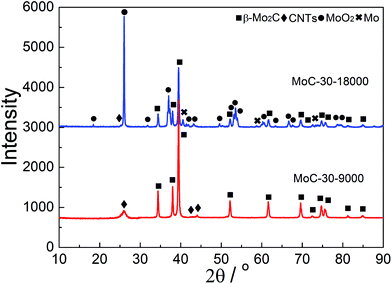 |
| | Fig. 10 XRD patterns of MoC-30 catalysts used in DRM with a WHSV of 9000 and 18000 cm3 g−1 h−1. | |
Fig. 11 shows the Raman spectra of MoC-30 used in DRM with a WHSV of 9000 and 18000 cm3 g−1 h−1 as well as fresh MoC-30 for comparison. In the case of fresh MoC-30, there were two intense bands at ∼1342 and ∼1574 cm−1 due respectively to the disorder band (D-band) and tangential band (G-band) of the carbon species.24 Compared with the fresh MoC-30, the MoC-30-18000 exhibited very weak peaks attributed to the D- and G-bands, but the MoC-30-9000 also clearly showed strong peaks with a similar intensity. The results indicated that the majority of the carbon species on the MoC-30-18000 were removed during the DRM reaction, which suggested that it had suffered from oxidation.
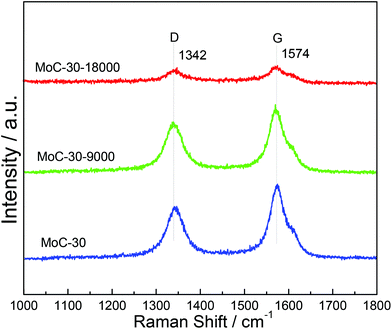 |
| | Fig. 11 Raman spectra of MoC-30 catalysts used in DRM with a WHSV of 9000 and 18000 cm3 g−1 h−1 as well as fresh MoC-30 for comparison. | |
Finally, the morphologies of MoC-30 used in DRM with a WHSV of 9000 and 18000 cm3 g−1 h−1 were investigated by TEM analysis (Fig. 12). Comparing the TEM images of MoC-30-18000 and MoC-30-9000 samples with that of the fresh MoC-30 sample (see Fig. 4 and 12), there were almost no differences in the shape and size of β-Mo2C particles except that very large MoO2 particles were observed on the MoC-30-18000 sample. It can be concluded from the XRD, Raman and TEM results that the MoC-30-18000 sample was indeed oxidized but there was no sintering of β-Mo2C particles in the DRM reaction. Therefore, it was reasonable to deduce that the deactivation of MoC-30-18000 was just due to the bulk oxidation of β-Mo2C. It was suggested that the oxidation of β-Mo2C by CO2 was still more favourable than the carburization of MoO2 by CH4 over MoC-30 under a high WHSV of 18000 cm3 g−1 h−1. In other words, a high WHSV meant high oxidant-to-catalyst exposure, which accounted for a short lifetime of the MoC-30 catalyst. When the WHSV decreased to 9000 cm3 g−1 h−1, the rate of β-Mo2C oxidation can be matched with that of MoO2 carburization and no obvious structural change of MoC-30 was observed by various characterization techniques (Fig. 10–12), which made maintaining a long-time stable activity of β-Mo2C possible (see Fig. 9).
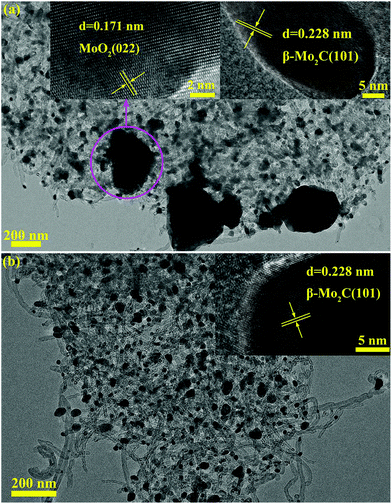 |
| | Fig. 12 TEM images of MoC-30 catalysts used in DRM with a WHSV of (a) 18000 and (b) 9000 cm3 g−1 h−1. The insets show the β-Mo2C (101) and MoO2 (022) crystal lattices. | |
3.4 Surface reactions of CH4 and CO2
It was believed that the structural stability of carbides was associated with the oxidation–recarburization cycle in the DRM reaction. To further understand the effect of the Mo content on the oxidation–recarburization cycle, CO2-TPO and CH4-TPSR investigations were performed over various Mo2C/CNT catalysts. Fig. 13 shows the results of CO2-TPO over MoC-5, MoC-30, MoC-60 and MoC-100 as well as CNTs for comparison. In the case of CNTs, the oxidation occurred at above 550 °C and the amount of CO2 consumption and CO formation increased with temperature. And there were similar trends of CO2 consumption and CO formation on the MoC-5, MoC-30, and MoC-60 samples. In the case of MoC-100, the amount of CO2 consumption was more than that for these Mo2C/CNT samples at lower temperatures (350–550 °C), indicating that the β-Mo2C on CNTs displayed higher oxidation resistance than bulk β-Mo2C. The result was in agreement with the conclusion from Fig. 1 and 2. Contradictorily, it was found that at temperatures above 550 °C, the amount of CO2 consumption on the Mo2C/CNT samples was more than that on the bulk β-Mo2C, probably due to the oxidation of CNTs themselves. We also found that it was impossible to differentiate the difficulty degree in oxidation among the MoC-5, MoC-30, and MoC-60 samples due to the same factor. Fortunately, based on the previous XPS results, it can be concluded that the oxidation resistance of β-Mo2C ranked in the order of MoC-30 > MoC-5 ≈ MoC-60.
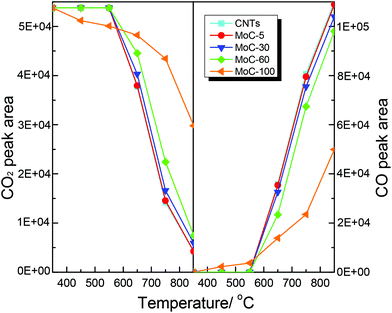 |
| | Fig. 13 Variations of the areas of CO2 and CO chromatographic peaks (normalized, taking into account the relative molar response of the TCD) during CO2-TPO. | |
Shown in Fig. 14 are the variations of the areas of CH4 and H2 chromatographic peaks during CH4-TPSR of MoC-5, MoC-30, MoC-60, MoC-100 and CNTs. It was generally accepted that the amount of CH4 consumption and H2 formation increased with increasing temperature, which was due to catalytic cracking of CH4 on these samples. In addition, over MoC-100 there was a consumption peak of CH4 observed at 750 °C accompanied by the formation peak of H2, which should be a result of reactivity of CH4 with the uncarburized Mo species, as suggested before.27,28,42 Based on the peak areas of CH4 and H2, it can be deduced that the β-Mo2C on CNTs was more favorable for the dissociation of CH4 than bulk β-Mo2C and the CH4 dissociation ability of Mo2C/CNTs followed the order: MoC-30 > MoC-60 > MoC-5.
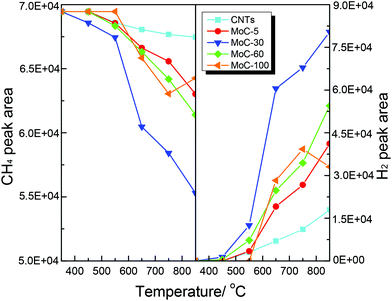 |
| | Fig. 14 Variations of the areas of CH4 and H2 chromatographic peaks (normalized, taking into account the relative molar response of the TCD) during CH4-TPSR. | |
In order to give a supplementary explanation for why the MoC-30 showed a better catalytic stability at lower WHSV (see Fig. 9), the conversion rates of CH4 and CO2 at different WHSV values were determined by CH4-TPSR and CO2-TPO studies. It can be seen from Table 3 that although R1 and R2 increased with the increase of WHSV value, the ratio of R1 to R2 decreased with WHSV. The results gave proof that high oxidant-to-catalyst exposure was obtained at a high WHSV, leading to a short lifetime of the MoC-30 catalyst.
Table 3 Conversion rates of CH4 and CO2 at 850 °C with different WHSV values obtained from CH4-TPSR and CO2-TPO studies
| WHSV (cm3 g−1 h−1) |
R
1 (mol g−1 s−1) |
R
2 (mol g−1 s−1) |
R
1/R2 |
|
R
1 = CH4 conversion rate, R2 = CO2 conversion rate. |
| 15000 |
9.24 × 10⁻⁷ |
3.54 × 10⁻⁶ |
0.26 |
| 30000 |
1.51 × 10⁻⁶ |
6.73 × 10⁻⁶ |
0.22 |
Correlating the CO2-TPO, CH4-TPSR, XRD and XPS results with the catalytic performance data allowed us to deduce that it was possible to enhance the CH4 dissociation ability and oxidation resistance of β-Mo2C by compositing with CNTs. Among these Mo2C/CNT catalysts, the β-Mo2C in MoC-30 showed the highest CH4 dissociation ability and oxidation resistance, which can greatly promote the oxidation–recarburization cycle. Thus, a highly stable DRM performance can be obtained on the MoC-30 catalyst.
4. Conclusions
In summary, a simple, fast and large-scale (about 100 grams) synthesis of β-Mo2C catalysts was reported and their catalytic activities for DRM were evaluated. The current approach has four advantages compared with the most common TPR method: (i) the use of a simple solid mixture of (NH4)6Mo7O24·4H2O and CNTs as a precursor; (ii) the use of a fast heating rate method without holding time; (iii) no need for the passivation procedure; (iv) the achievement of large-scale synthesis. It was found that the abilities of CH4 dissociation and oxidation resistance of β-Mo2C were greatly enhanced by compositing with CNTs. It was indicated that these abilities were dependent on the Mo content, the particle size and the interaction between β-Mo2C and CNTs. Through the optimization of the Mo content ranging from 5 to 60%, stable catalytic performance could be achieved at a Mo content of 30%. Noticeably, the catalytic stability of the monometallic MoC-30 was found to be superior to that of the bimetallic Ni/β-Mo2C.
Conflicts of interest
There are no conflicts to declare.
Acknowledgements
This work was supported by the National Natural Science Foundation of China (No. 21276253) and by the talent scientific research fund of LSHU (No. 2013XJJ-018).
Notes and references
- A.-M. Alexander and J. S. J. Hargreaves, Chem. Soc. Rev., 2010, 39, 4388–4401 RSC.
- L. Zhong, F. Yu, Y. An, Y. Zhao, Y. Sun, Z. Li, T. Lin, Y. Lin, X. Qi and Y. Dai, Nature, 2016, 538, 84–87 CrossRef CAS PubMed.
- K. Xu, B. Sun, J. Lin, W. Wen, Y. Pei, S. Yan, M. Qiao, X. Zhang and B. Zong, Nat. Commun., 2014, 5, 5783 CrossRef CAS PubMed.
- Z. Yao and C. Shi, Catal. Lett., 2009, 130, 239–245 CrossRef CAS.
- E. Furimsky, Appl. Catal., A, 2003, 240, 1–28 CrossRef CAS.
- H. Wang, A. Wang, X. Wang and T. Zhang, Chem. Commun., 2008, 2565–2567 RSC.
- N. S. Alhajri, D. H. Anjum and K. Takanabe, J. Mater. Chem. A, 2014, 2, 10548–10556 CAS.
- L. Liao, S. Wang, J. Xiao, X. Bian, Y. Zhang, M. D. Scanlon, X. Hu, Y. Tang, B. Liu and H. H. Girault, Energy Environ. Sci., 2014, 7, 387–392 CAS.
- M. Nagai and K. Matsuda, J. Catal., 2006, 238, 489–496 CrossRef CAS.
- J. B. Claridge, A. P. E. York, A. J. Brungs, C. Marquez-Alvarez, J. Sloan, S. C. Tsang and M. L. H. Green, J. Catal., 1998, 180, 85–100 CrossRef CAS.
- H. Shao, E. L. Kugler, D. B. Dadyburjor, S. A. Rykov and J. G. Chen, Appl. Catal., A, 2009, 356, 18–22 CrossRef CAS.
- D. C. LaMont and W. J. Thomson, Appl. Catal., A, 2004, 274, 173–178 CrossRef CAS.
- A. R. S. Darujati and W. J. Thomson, Appl. Catal., A, 2005, 296, 139–147 CrossRef CAS.
- S. Naito, A. Takada, S. Tokizawa and T. Miyao, Appl. Catal., A, 2005, 289, 22–27 CrossRef CAS.
- M. L. Pritchard, R. L. McCauley, B. N. Gallaher and W. J. Thomson, Appl. Catal., A, 2004, 275, 213–220 CrossRef CAS.
- S. Naito, M. Tsuji and T. Miyao, Catal. Today, 2002, 77, 161–165 CrossRef CAS.
- D. C. LaMont and W. J. Thomson, Chem. Eng. Sci., 2005, 60, 3553–3559 CrossRef CAS.
- A. R. S. Darujati and W. J. Thomson, Chem. Eng. Sci., 2006, 61, 4309–4315 CrossRef CAS.
- J. Sehested, C. J. H. Jacobsen, S. Rokni and J. R. Rostrup-Nielsen, J. Catal., 2001, 201, 206–212 CrossRef CAS.
- A. J. Brungs, A. P. E. York and M. L. H. Green, Catal. Lett., 1999, 57, 65–69 CrossRef CAS.
- A. E. York, J. Claridge, A. Brungs, S. Tsang and M. H. Green, Chem. Commun., 1997, 39–40 RSC.
- P. Liang, H. Gao, Z. Yao, R. Jia, Y. Shi, Y. Sun, Q. Fan and H. Wang, Catal. Sci. Technol., 2017, 7, 3312–3324 CAS.
- J. Cheng and W. Huang, Fuel Process. Technol., 2010, 91, 185–193 CrossRef CAS.
- Z. Yao, J. Jiang, Y. Zhao, F. Luan, J. Zhu, Y. Shi, H. Gao and H. Wang, RSC Adv., 2016, 6, 19944–19951 RSC.
- J. Huang, T. Huang, L. Liu, W. Huang and R. Ma, Energy Sources, Part A, 2011, 33, 2249–2256 CrossRef CAS.
- T. Hirose, Y. Ozawa and M. Nagai, Chin. J. Catal., 2011, 32, 771–776 CrossRef CAS.
- C. Shi, S. Zhang, X. Li, A. Zhang, M. Shi, Y. Zhu, J. Qiu and C. Au, Catal. Today, 2014, 233, 46–52 CrossRef CAS.
- C. Shi, A. Zhang, X. Li, S. Zhang, A. Zhu, Y. Ma and C. Au, Appl. Catal., A, 2012, 431, 164–170 CrossRef.
- A. Zhang, A. Zhu, B. Chen, S. Zhang, C. Au and C. Shi, Catal. Commun., 2011, 12, 803–807 CrossRef CAS.
- T. Huang, W. Huang, J. Huang and P. Ji, Fuel Process. Technol., 2011, 92, 1868–1875 CrossRef CAS.
- W. Xu, P. J. Ramirez, D. Stacchiola and J. A. Rodriguez, Catal. Lett., 2014, 144, 1418–1424 CrossRef CAS.
- W.-F. Chen, C.-H. Wang, K. Sasaki, N. Marinkovic, W. Xu, J. T. Muckerman, Y. Zhu and R. R. Adzic, Energy Environ. Sci., 2013, 6, 943–951 CAS.
- X. Y. Li, D. Ma and X. H. Bao, Chin. J. Catal., 2008, 29, 884–894 CAS.
- Z. Wen, J. Liu and J. Li, Adv. Mater., 2008, 20, 743–747 CrossRef CAS.
- C. A. Bessel, K. Laubernds, N. M. Rodriguez and R. T. K. Baker, J. Phys. Chem. B, 2001, 105, 1115–1118 CrossRef CAS.
- X. Y. Li, D. Ma and X. H. Bao, Chin. J. Catal., 2008, 29, 884–894 CAS.
- T. Bécue, J. Manoli, C. Potvin and G. Mariadassou, J. Phys. Chem. B, 1997, 101, 6429–6435 CrossRef.
- P. Perez-Romo, C. Potvin, J.-M. Manoli, M. M. Chehimi and G. Djéga-Mariadassou, J. Catal., 2002, 208, 187–196 CrossRef CAS.
- P. Delporte, F. Meunier, C. Pham-Huu, P. Vennegues, M. J. Ledoux and J. Guille, Catal. Today, 1995, 23, 251–267 CrossRef CAS.
- W. Chen, X. Pan and X. Bao, J. Am. Chem. Soc., 2007, 129, 7421–7426 CrossRef CAS PubMed.
- M. Khavarian, S.-P. Chai and A. R. Mohamed, Chem. Eng. J., 2014, 257, 200–208 CrossRef CAS.
- Z. Yao, F. Luan, Y. Sun, B. Jiang, J. Song and H. Wang, Catal. Sci. Technol., 2016, 6, 7996–8004 CAS.
Footnote |
| † Electronic supplementary information (ESI) available. See DOI: 10.1039/c7qi00532f |
|
| This journal is © the Partner Organisations 2018 |
Click here to see how this site uses Cookies. View our privacy policy here. 
 *a,
Yan
Shi
a,
Renren
Jia
b,
Feixue
Liang
a,
Yue
Sun
a,
Wei
Mao
a and
Haiyan
Wang
a
*a,
Yan
Shi
a,
Renren
Jia
b,
Feixue
Liang
a,
Yue
Sun
a,
Wei
Mao
a and
Haiyan
Wang
a