 Open Access Article
Creative Commons Attribution 3.0 Unported Licence
Long-range transport clusters and positive matrix factorization source apportionment for investigating transboundary PM2.5 in Gothenburg, Sweden†
Peter
Molnár
 *a,
Lin
Tang
 b,
Karin
Sjöberg
 b and
Janine
Wichmann
 c
c
aOccupational and Environmental Medicine, Sahlgrenska University Hospital & University of Gothenburg, Medicinaregatan 16A, SE-40530 Gothenburg, Sweden. E-mail: peter.molnar@amm.gu.se
bIVL Swedish Environmental Research Institute, P.O. Box 53021, SE-40014 Gothenburg, Sweden
cSchool of Health Systems and Public Health, University of Pretoria, 31 Bophelo Road 00 01, Pretoria, South Africa
First published on 28th July 2017
Abstract
Source apportionment studies of particulate matter are common and have been performed either as source region analyses using air mass back trajectories or by source type using source apportionment techniques. By combining the two approaches, it is possible to estimate the relative importance of emitters in different regions. PM2.5 samples were collected in Gothenburg between September 2008 and September 2009. The mean daily PM2.5 level was 6.1 μg m−3 (range 0.79–30.91 μg m−3). Elemental analyses were done using Energy dispersive X-ray fluorescence (EDXRF) spectroscopy. Source apportionment was carried out using the US EPA PMF 5.0 software. The sources long-range transport (LRT), LRT-Pb (lead-containing LRT), ship emissions, combustion, marine, and resuspension were identified. Air mass trajectories were estimated using HYSPLIT model (version 4.9). Six transport clusters were identified: South Scandinavia 21%, North Scandinavia 11%, Baltic Sea 8%, Eastern Europe 6%, UK/North Sea/Denmark 25%, and North Atlantic Ocean 30%. LRT was the major contributor to PM2.5 levels across all six transport clusters (48%) followed by ship emissions (20%) and combustion (19%). The transport cluster associated with the highest PM2.5 levels was Eastern Europe followed by South Scandinavia, UK/North Sea/Denmark, and Baltic Sea. After considering the frequency of the transport clusters, the transport clusters associated with the highest PM2.5 levels were UK-NorthS-DK, S-Scandic, and N-Atlantic, while Eastern Europe only contributed 9% towards PM2.5 levels. Abatement strategies aimed at reductions of ship emissions, industry emissions, and road traffic emissions on an European level and local combustion sources on a city-scale level would be the two most effective directions for reducing ambient PM2.5 in Gothenburg.
Environmental impactIn the manuscript, we present the results and conclusions from a study of one-year daily PM2.5 sampling in Gothenburg Sweden. Our study is one of few that combine back trajectory modeling with source apportionment analyses using positive matrix factorization. By combining the two methods, it is possible to identify how different source areas and types of pollutants affect a receptor site. We found that only a minor part (about 6–10%) were from natural sources, around 25% were from local anthropogenic sources, and the rest (about 65–70%) originated from regional anthropogenic sources. Contributions were dominated by the regional transport from three source areas covering the central and western parts of Europe. The highest levels were found on days with air masses from Eastern Europe, but the low frequency of these air masses resulted in only a minor contribution. Results from our study show that by combining the two methods we can identify both source types and the origin of the pollutants, which is valuable when discussing different abatement strategies on both national and international levels. |
Introduction
People are exposed to air pollutants that originate from natural sources as well as anthropogenic activities. Fine particulate matter (PM2.5) can be transported thousands of miles from its initial site of emission,1 and the concentrations vary spatially and temporally.2 Moreover, local activities (traffic, domestic wood burning, and industrial activities) and meteorological conditions play an important role in the concentration and distribution of PM.3 Several epidemiological studies have found associations between mass concentrations of fine PM and adverse health effects.4–7 No safe level of exposure has been found,7 meaning that even exposure levels in the lower range of concentration (such as in the Nordic countries) cause adverse health effects. It is therefore important to identify the pollution sources and their contributions to the ambient concentrations in order to direct abatement strategies to reduce the concentrations in a cost-effective way.In a recent review,8 the authors have analyzed available source apportionment studies on particulate matter (PM10 and PM2.5) performed in cities to estimate typical shares of the sources of pollution. In their conclusions, they stated that a combination of back trajectory modeling with source apportionment analyses holds a large potential. Three of the studies listed in the review were from Sweden.9–11 Those studies were conducted in Lund in southern Sweden, in Stockholm, and in Lycksele in northern Sweden, respectively. Only the Stockholm study by Furusjo et al. covered a full year, which is necessary for assessing the population exposure. There is, therefore, a need for new source apportionment studies in Sweden conducted over one year's duration.
The objectives of this study were to (1) investigate the chemical components of PM2.5 and the contributions of different sources in Gothenburg, Sweden, by using positive matrix factorization (PMF), and (2) to investigate source region contributions using the back-trajectories cluster analysis. Seasonal variations, local vs. regional contributions, and the effect of limited local dispersion (i.e., temperature inversions) were also investigated.
Material and methods
PM2.5 sampling
Daily 24 hour PM2.5 samples were collected for about a year between 22 September 2008 to 24 September 2009 in Gothenburg, Sweden, using the IVL (IVL Swedish Environmental Research Institute, Gothenburg, Sweden) PModel S2.5 on 25 mm TF (PTFE) Membrane filters (Pall Corp., Port Washington, NY, USA). The sampling spot was an urban background site, located on the roof of a two-story building on a hill in the central part of Gothenburg, away from and not affected by local major traffic routes.In total, sampling was performed for 368 days, and 364 samples were successfully collected. An additional three samples were discarded from the analysis due to special events occurring (e.g., fireworks on New Year's Eve), which gave us a total of 361 samples.
Chemical analyses of PM2.5 filters
The filters were weighed using microbalance (Mettler MT5; Mettler XP6) under climate-controlled conditions (relative humidity 45–50%, temperature 19–21 °C) at the IVL laboratory before and after sampling. After determination of gravimetric mass concentrations, the filters were analyzed for black carbon (BC), UVPM (a proxy for organic carbonaceous particulate matter absorbing UV light at 370 nm),12 and elemental concentrations. Analyses of BC and UVPM were performed using a Model OT21 Optical Transmissometer (Magee Scientific Corp., Berkeley, CA, USA). The additional absorption in the UV light, at 370 nm, due to the organics indicate the presence of biomass burning.13–15 UVPM is a proxy for organic carbon species, expressed in mass concentration. An energy-dispersive X-ray fluorescence (EDXRF) spectrometer at the Department of Chemistry, Atmospheric Science, University of Gothenburg, was used to analyze the elemental composition from sulfur to lead. The EDXRF spectra were processed and quantified using the Quantitative X-ray Analysis System (QXAS), and the Analysis of X-ray spectra by Iterative Least-square fitting (AXIL). All samples were analyzed using a live time of 1000 seconds, a tube voltage of 55 kV, a tube current of 25 mA, and a Mo secondary target.16 For the majority of the elements, most samples were above the limit of detection. Only Ti, V, Rb, Sr, and Pb had <50% above the limit of detection, but these elements were present in one or more sources to a high degree and thus were incorporated in the analysis.Source apportionment by positive matrix factorization (PMF)
Source apportionment analysis was carried out by the PMF technique, using the U.S. Environmental Protection Agency software EPA-PMF 5.0. PMF is a multivariate receptor model concept that estimates the source profiles and their contributions based on a weighted least square approach.17,18 The task of the PMF model, eqn (1), is to obtain the unknown matrices, G and F, by the iterative treatment of a least square method:| X = GF + E | (1) |
 | (2) |
In the present study, BC, UVPM, and the following elements were included in the PMF analysis: S, Cl, K, Ca, Ti, V, Mn, Fe, Ni, Cu, Zn, Br, Rb, Sr, and Pb. In all the analyses, the elemental mass concentrations were recalculated to their mean oxidized mass concentrations, when applicable according to Beuck et al.19
The following settings were used when running the PMF. If the signal-to-noise ratio was below 1 for a variable in the model, the variable was deemed weak (and the uncertainty was tripled). The PMF model was run with four to seven source profiles, the results were compared and tested both for stability of the solution (using bootstrap and displacement analysis) and examining the resulting source profiles for consistency with known source profiles.
Transport clusters
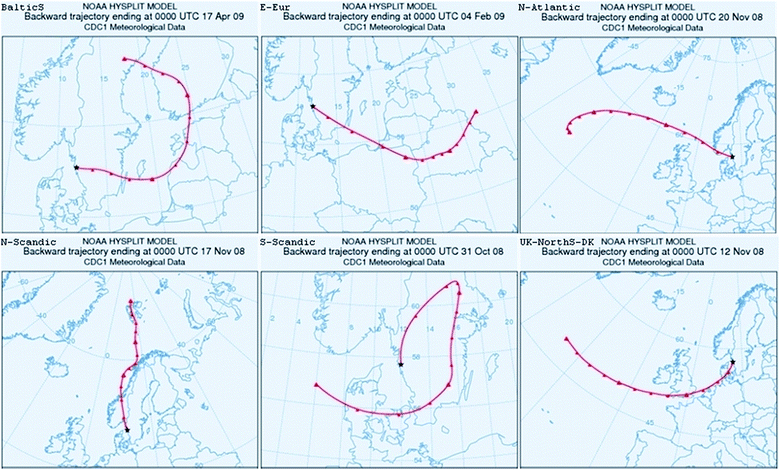
We reported previously on air mass back trajectories in Gothenburg during a 26 year study period.3 The backward trajectories were produced by the Hybrid Single Particle Lagrangian Integrated Trajectory (HYSPLIT, version 4.9) model.20,21 The model was driven by the NCEP/NCAR (National Centers for Environmental Prediction/National Center for Atmospheric Research) Global Reanalysis Data at the web server of the National Oceanic and Atmospheric Administration Air Resources Laboratory (NOAA ARL). An analysis field (resolution 2.5° × 2.5° and 17 vertical levels) was provided every 6 h and the wind field was interpolated linearly between each analysis.Since a single backward trajectory has a large uncertainty and is of limited significance,22 an ensemble of trajectories with 500 m starting height and a fixed offset grid factor of 250 m was used in this study. The daily average trajectories were calculated backwards for 72 h and used for cluster analysis. The clustering algorithm coupled in HYSPLIT was based on the distance between a trajectory endpoint and the corresponding cluster-mean endpoint.23 The cluster analysis was conducted seasonally due to the limitation of sample size for the HYSPLIT model. The final six transport clusters were categorized according to their mean pathways and the properties of the trajectories: South Scandinavia (S-Scandic), North Scandinavia (N-Scandic), Baltic Sea (BalticS), Eastern Europe (E-Eur), UK/North Sea/Denmark (UK-NorthS-DK), and North Atlantic Ocean (N-Atlantic) see also Fig. 3.3
Statistical analysis
Statistical analyses were performed with the SAS System for Windows, version 9.3. According to the Shapiro–Wilk's test, the PM2.5 levels and the PMF sources did not have normal Gaussian distributions. Hence, non-parametric tests were applied. Kruskal–Wallis test was conducted to test whether PM2.5 levels and PMF sources differed significantly across seasons and the six transport clusters (trajectories). Wilcoxon's rank-sum test was applied to test whether PM2.5 levels and PMF sources differed significantly between weekdays and weekends and between the local dispersion conditions (good vs. bad).Results and discussion
The mean daily PM2.5 level in the study period was 6.1 μg m−3 (see Table 1 below) and well below the EU air quality standard of 25 μg m−3. In spring (March to May), the mean level was significantly higher than in autumn (September to November), winter (December to February), and summer (June to August): 7.7 vs. 5.1, 6.8, and 5.1 μg m−3, respectively (p < 0.0001) Table 1. No significant difference was found between weekdays and during weekends; the mean levels were 6.2 and 5.9 μg m−3, respectively (p = 0.24). The levels were the same on days with limited local dispersion (i.e., temperature inversions) and days with more dispersion.| Species | Full study (n = 361) | Autumn (n = 90) | Winter (n = 87) | Spring (n = 92) | Summer (n = 92) | |||||
|---|---|---|---|---|---|---|---|---|---|---|
| Mean | Range | Mean | Range | Mean | Range | Mean | Range | Mean | Range | |
| PM2.5 | 6.15 | 0.79 to 30.91 | 5.09 | 0.79 to 17.30 | 6.77 | 2.25 to 20.87 | 7.66 | 2.71 to 30.91 | 5.08 | 2.12 to 10.28 |
| PM2.5PMF | 5.66 | 0.71 to 18.21 | 4.23 | 0.71 to 13.20 | 6.13 | 1.78 to 18.09 | 6.91 | 2.47 to 18.21 | 5.35 | 2.17 to 11.66 |
| LRT | 2.73 | −0.55 to 14.06 | 1.63 | −0.55 to 8.86 | 3.14 | −0.41 to 13.72 | 3.80 | −0.55 to 14.06 | 2.36 | −0.55 to 6.18 |
| LRT-Pb | 0.11 | −0.02 to 0.70 | 0.09 | −0.02 to 0.31 | 0.14 | −0.02 to 0.50 | 0.10 | −0.02 to 0.31 | 0.09 | −0.02 to 0.70 |
| Marine | 0.37 | −0.07 to 3.52 | 0.47 | −0.07 to 3.13 | 0.30 | −0.07 to 3.52 | 0.39 | −0.07 to 2.00 | 0.31 | −0.07 to 3.01 |
| Shipping | 1.14 | −0.23 to 7.13 | 0.85 | −0.23 to 2.49 | 0.67 | −0.23 to 2.02 | 1.33 | −0.23 to 7.13 | 1.69 | 0.10 to 3.62 |
| Resuspension | 0.25 | −0.05 to 1.23 | 0.26 | −0.03 to 1.23 | 0.25 | −0.05 to 1.10 | 0.33 | −0.05 to 1.08 | 0.14 | −0.05 to 0.74 |
| Combustion | 1.06 | −0.21 to 5.54 | 0.92 | −0.21 to 3.39 | 1.62 | −0.19 to 5.53 | 0.96 | −0.21 to 4.40 | 0.77 | −0.21 to 3.53 |
The World Health Organization daily air quality guideline for PM2.5 (25 μg m−3) was exceeded only once during the study period (30.9 μg m−3 on 23 April 2009). On that day the LRT cluster was from S-Scandic, and local dispersion conditions were also limited, that is, low wind speed. The daily mean wind speed was low (0.7–2.1 m s−1) on all five local ground level stations and all hourly means were below 4 m s−1.
The individual concentrations and seasonal variations of the chemical species by themselves is not a focus in this study, but a mainly used to identify PM2.5 sources. Descriptive statistics of the chemical species can be found in Table S1 in the ESI† for reference. Generally the concentrations were low compared to levels found over Continental Europe.
Sources of PM2.5 identified by PMF
The PMF model chosen was a six sources solution. This solution was proven to be stable under the bootstrap and displacement tests, and the six sources were chemically separated into plausible sources. The six estimated sources (i.e., chemical profiles) are presented in Fig. 1 with information on mass contribution and percentage of the variables within each source. Similar sources and chemical specie contributions have been found in previous studies on the Swedish west coast.24,25 The mean PM2.5 levels of the six estimated sources (LRT, LRT-Pb, marine, shipping, resuspension, and combustion) can be found in Table 1. The mean PM2.5 levels of these sources were 2.7, 0.1, 0.4, 1.1, 0.2, and 1.1 μg m−3, respectively (Fig. 2). LRT was the major contributor, with 48% of the total PM2.5 levels on a yearly average. The sum of non-local anthropogenic sources, that is, LRT, LRT-Pb, and shipping, add up to a daily mean contribution of 4.0 μg m−3 (70% of the total PM2.5). The two mainly local sources, combustion and resuspension, contributed on a daily average 1.3 μg m−3 (23%), and the remaining 7% was mainly sea salt. This is in accordance with the previous estimate by,26 which found that about 29% of PM10 in Sweden is of local origin and the rest is transboundary, transported from other areas.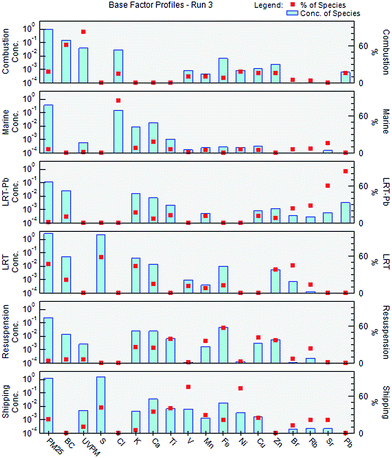 | ||
| Fig. 1 PMF sources and mean contributions (concentrations are in μg m−3) between 22 September 2008 and 24 September 2009 in Gothenburg, Sweden. | ||
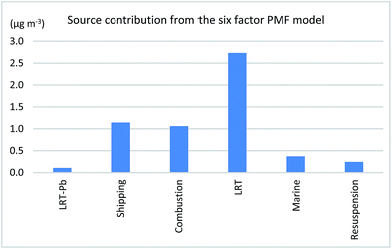 | ||
| Fig. 2 Mean source contributions from the six-factor PMF model to the yearly mean PM2.5 concentration. | ||
The linear regression line between measured PM2.5 mass at our site and PM2.5PMF (the sum of PM2.5 from the identified sources in the PMF analyses) had slope, intercept, and R2 values of 0.59, 2.05 μg m−3, and 0.59, respectively. We have three samples with high PM2.5 mass that cannot be explained by local events or sample handling. If we remove these from the analysis, the R2 value increase from 0.59 to 0.72. Removing the three-outliers from the dataset do not change the source profiles.
Seasonal and weekly variations of PM2.5 sources
Several sources were found to have a seasonal behavior (see Table 1). In winter the estimated contributions to the PM2.5 concentration levels from the sources combustion and LRT-Pb were found to be significantly higher compared to the other seasons, while the marine contribution was lower. In spring the levels from resuspension and LRT were higher, and in summer shipping was higher (p < 0.0001 for all tests).The elevated contributions from combustion during winter were expected, since cold starts from vehicles and more residential heating would increase the emissions.
The increase during spring season from resuspension was also expected and has been shown in other studies.27 It is a phenomenon common in Nordic countries, caused by the use of studded tires and sanding of snow- and ice-covered streets, which create a brittle asphalt with excess sand in spring, and on days with dry road surfaces, the resuspension can cause very high PM levels. Daily mean PM10 levels of up to 150 μg m−3 have been seen in Stockholm during springtime days with dry road surfaces.28
The higher levels of PM2.5 from shipping in the summer are most likely caused by the combination of increase in ferry traffic and cruise ships, the extensive use of smaller motor boats for leisure, travelling along the west coast of Sweden and in and around the archipelago outside Gothenburg, as well as an increase in particle formation caused by gaseous ship emissions.
When comparing weekends with weekdays, only the mean level in the resuspension factor was significantly lower, 0.13 μg m−3vs. 0.21 μg m−3 (p = 0.0006). This is a clear indication of the reduction in road traffic intensity during weekends compared to normal workdays.
As described in Tang et al.,3 we examined the sampling days to see if weather conditions promoted local dispersion or not. A day with limited local dispersion is defined as the day with temperature inversion which was calculated from local vertical temperature difference. The limited local dispersion means a relative stable boundary condition characterized with weak wind and turbulence. Days with local limited dispersion were much more common when the air masses originated from E-Eur, UK-NorthS-DK or N-Atlantic (>60% of the days) during 1985–2010.29 On days with limited local dispersion the contributions from combustion and resuspension were found to be significantly higher (p = 0.02 and p < 0.0001, respectively), while the marine influence was reduced (p < 0.0001). Low wind speed limits the amount of sea spray from the ocean, while the local emissions from combustion and resuspension would not be dispersed and transported away as effectively and thus increase the contribution to the PM2.5 concentrations from these sources.
Transport clusters
The cluster S-Scandic is characterized by trajectories in the vicinity of southern Scandinavia; the cluster E-Eur with pathways over Eastern Europe, and the cluster UK-NorthS-DK covering the Atlantic Ocean and Western Europe. Using the potential source contribution function fields calculated in Tang et al. (2014), we can identify the potential source areas for the different transport clusters. For the cluster S-Scandic, the source areas extend westward to the continental coastal areas of the North Sea and eastward to Poland; for the cluster E-Eur, Czech Republic, Poland, and Ukraine are also covered; for the cluster UK-NorthS-DK, the source areas start from the Celtic Sea, France, southern UK, and Belgium to the Netherlands. Air masses for the cluster N-Atlantic are mainly from the marine area, the cluster BalticS derives from the Baltic Sea and the Baltic countries, and the cluster N-Scandic from the Norwegian Sea/North Sweden. The clusters N-Atlantic, BalticS, and N-Scandic do not show any apparent source areas.
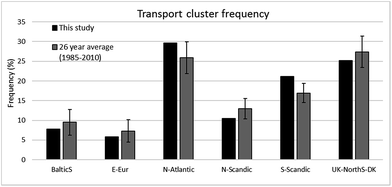 | ||
| Fig. 4 Annual frequencies of the six transport clusters in the present study, plus the mean and standard deviation for 1985–2010 (by Tang et al., 2014). | ||
The cluster S-Scandic occurs more frequently in winter, spring, and autumn, the N-Scandic in winter, and the BalticS in summer, while the cluster E-Eur is found more often in winter, the frequency of the cluster UK-NorthS-DK is higher in spring and summer, and N-Atlantic is more common in winter (see Table S2, in the ESI†).
| Transport cluster | PM2.5a | LRTa | LRT-Pb | Marinea | Shippinga | Resuspensiona | Combustiona |
|---|---|---|---|---|---|---|---|
| a Differs across the six transport clusters (p < 0.0001). | |||||||
| S-Scandic (76 days) | 7.61 | 3.72 | 0.10 | 0.15 | 1.13 | 0.31 | 1.52 |
| N-Scandic (38 days) | 4.06 | 1.86 | 0.11 | 0.27 | 0.72 | 0.37 | 0.91 |
| BalticS (28 days) | 5.79 | 2.49 | 0.10 | 0.13 | 1.12 | 0.39 | 1.08 |
| E-Eur (21 days) | 9.65 | 5.62 | 0.18 | 0.05 | 0.47 | 0.24 | 2.49 |
| UK-NorthS-DK (91 days) | 6.89 | 3.17 | 0.11 | 0.38 | 1.53 | 0.13 | 0.88 |
| N-Atlantic (107 days) | 4.62 | 1.47 | 0.10 | 0.68 | 1.12 | 0.22 | 0.65 |
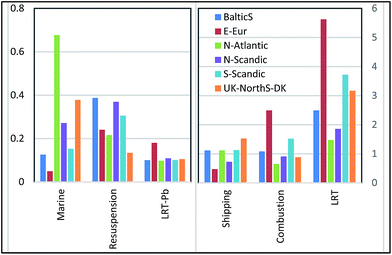
As expected, the marine source was higher for N-Atlantic and UK-NorthS-DK compared to the other clusters. The combustion source was higher when air masses came from E-Eur or from S-Scandic. Shipping was found in all transport clusters, with somewhat higher concentrations from the UK-NorthS-DK and decidedly lower from E-Eur and N-Scandic. The LRT-Pb and resuspension didn't change much over the different clusters, although the resuspension was significantly lower on days with air masses from UK-NorthS-DK.
PM2.5 sources and transport clusters
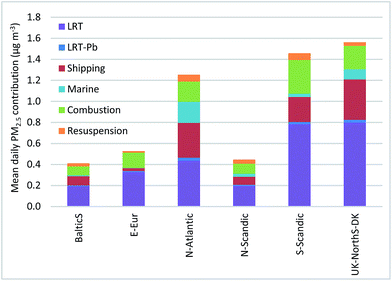
The average size of the impact from different source areas and source types at a receptors point depends on the combination of source strength and frequency. In the present study, we found the highest concentrations of PM2.5 when the air masses originated from Eastern Europe, while on days with air masses from Northern Scandinavia or the North Atlantic the levels were less than half (Table 2). On the other hand, air masses from Eastern Europe were the least common (21 out of 361 days, i.e., 5.8% of the days), while air masses from the North Atlantic and the UK-NorthS-DK cluster occurred on 107 and 91, days, respectively (30% and 25% of the days). Multiplying the average contribution (Fig. 5) by the frequency of the air masses gives a different picture (Fig. 6). The source areas that contributed the most to PM2.5 in Gothenburg were the UK-NorthS-DK, S-Scandic, and N-Atlantic, about 1.2–1.6 μg m−3 each, while the contributions from E-Eur, N-Scandic, and BalticS were around 0.4–0.5 μg m−3, that is, about a third each, compared to the former ones. Nevertheless, LRT was still the source type with the largest contribution.Sources and abatement strategies
When we examine the results from the PMF analysis and from the transport clusters, we can group the contributions to the ambient PM2.5 concentrations as either from local or regional natural sources, or local or regional anthropogenic sources. Natural sources in Gothenburg are typically sea salt and to a lesser extent resuspension, while the other sources are predominantly anthropogenic. The local sources are road traffic; local industries; domestic heating; emissions from nearby sea traffic, that is, the combustion source, a minor part of the ship emission source; and traffic-derived resuspension. The two LRT sources and part of the shipping source are mostly of regional origin. Summing up the average PM2.5 contributions in three categories, natural, local anthropogenic, and regional anthropogenic sources, we can deduce that only a minor part (about 6–10%) were from natural sources; around 25% were from local anthropogenic sources, and the rest (about 65–70%) originated from regional anthropogenic sources.It is also evident that the regions from which the regional air mass transport originates more frequently also contribute more to the PM2.5 levels (Table 2 and Fig. 6). Abatement strategies within the European Union that focus on reduction of LRT sources (mainly industry, road traffic, and residential heating) as well as ship emissions (already in progress) will therefore benefit Gothenburg (and the southwestern part of Scandinavia) the most. On a more local scale, the city of Gothenburg should focus abatement strategies on local road traffic, residential heating, and near shore and harbor emissions from sea traffic.
Conclusions
This study investigated chemical components of PM2.5 and contributions of different sources for a full year of daily measurements in Gothenburg, Sweden, in four seasons, using PMF. Source areas were studied using the transport clusters based on the HYSPLIT backward trajectory model. When we combine the results from the PMF analysis and from the transport clusters, we can identify the contributions to the ambient PM2.5 concentrations as either mostly from local or regional natural sources, or local or regional anthropogenic sources.The main sources types were long-range transported pollution (about 50% of PM2.5), followed by ship emissions and local combustion. The transport clusters indicated that the North Atlantic was the most frequent PM source area (30% of the year), followed by Western Europe and southern Scandinavia. Although Eastern Europe was identified as the source area with the highest PM2.5 contributions, those events occurred on only 6% of the days, thus the yearly average contribution was low. North Atlantic air masses were the most common, however, they carry high concentration of sea salt particles and therefore most likely have less negative health effects then its mass contribution indicate.
Average contributions were dominated by the regional transport from the three transport clusters UK-NorthS-DK, S-Scandic, and N-Atlantic, covering the central and western parts of Europe, and to a lesser degree by local combustion, according to our findings. Abatement strategies aimed toward reductions of ship emissions, industry emissions, and road traffic emissions on a European level and local combustion sources on a city-scale level would be the two most effective directions by which to reduce ambient PM2.5.
Acknowledgements
The authors gratefully acknowledge the NOAA Air Resources Laboratory for providing the HYSPLIT model and the NOAA/OAR/ESRL PSD, Boulder, Colorado, USA, for providing the NCEP Reanalysis datasets. The authors acknowledge Ms Malin Gustafsson for sharing her experiences in running the HYSPLIT model, and Environmental Office in Gothenburg for providing measured meteorological data. JW received funding from the South African National Research Foundation as rated researcher [grant number 95692]. PM received funding from FORTE [FAS 2008-0450].References
- N. Huneeus, M. Schulz, Y. Balkanski, J. Griesfeller, J. Prospero, S. Kinne, S. Bauer, O. Boucher, M. Chin, F. Dentener, T. Diehl, R. Easter, D. Fillmore, S. Ghan, P. Ginoux, A. Grini, L. Horowitz, D. Koch, M. C. Krol, W. Landing, X. Liu, N. Mahowald, R. Miller, J. J. Morcrette, G. Myhre, J. Penner, J. Perlwitz, P. Stier, T. Takemura and C. S. Zender, Atmos. Chem. Phys., 2011, 11, 7781–7816 CAS.
- K. Ito, N. Xue and G. Thurston, Atmos. Environ., 2004, 38, 5269–5282 CrossRef CAS.
- L. Tang, M. Haeger-Eugensson, K. Sjöberg, J. Wichmann, P. Molnár and G. Sallsten, Atmos. Environ., 2014, 89, 93–101 CrossRef CAS.
- R. D. Brook, S. Rajagopalan, C. A. Pope, J. R. Brook, A. Bhatnagar, A. V. Diez-Roux, F. Holguin, Y. L. Hong, R. V. Luepker, M. A. Mittleman, A. Peters, D. Siscovick, S. C. Smith, L. Whitsel and J. D. Kaufman, Circulation, 2010, 121, 2331–2378 CrossRef CAS PubMed.
- C. A. Pope, R. T. Burnett, M. J. Thun, E. E. Calle, D. Krewski, K. Ito and G. D. Thurston, JAMA, J. Am. Med. Assoc., 2002, 287, 1132–1141 CrossRef CAS PubMed.
- J. M. Samet, F. Dominici, F. C. Curriero, I. Coursac and S. L. Zeger, N. Engl. J. Med., 2000, 343, 1742–1749 CrossRef CAS PubMed.
- WHO, Review of evidence on health aspects of air pollution – REVIHAAP Project, Copenhagen, Denmark, 2013 Search PubMed.
- F. Karagulian, C. A. Belis, C. F. C. Dora, A. M. Pruess-Ustuen, S. Bonjour, H. Adair-Rohani and M. Amann, Atmos. Environ., 2015, 120, 475–483 CrossRef CAS.
- E. Furusjo, J. Sternbeck and A. P. Cousins, Sci. Total Environ., 2007, 387, 206–219 CrossRef PubMed.
- P. Krecl, J. Ström and C. Johansson, Atmos. Environ., 2008, 42, 4113–4125 CrossRef CAS.
- E. Swietlicki, S. Puri, H. C. Hansson and H. Edner, Atmos. Environ., 1996, 30, 2795–2809 CrossRef CAS.
- S. Raja, S. R. Chandrasekaran, L. Lin, X. Xia, P. K. Hopke and K. T. Valsaraj, Aerosol Air Qual. Res., 2017, 17, 14–23 CrossRef.
- J. Sandradewi, A. S. H. Prevot, S. Szidat, N. Perron, M. R. Alfarra, V. A. Lanz, E. Weingartner and U. Baltensperger, Environ. Sci. Technol., 2008, 42, 3316–3323 CrossRef CAS PubMed.
- J. Sandradewi, A. S. H. Prevot, E. Weingartner, R. Schmidhauser, M. Gysel and U. Baltensperger, Atmos. Environ., 2008, 42, 101–112 CrossRef CAS.
- M. Teich, D. van Pinxteren, M. Wang, S. Kecorius, Z. B. Wang, T. Muller, G. Mocnik and H. Herrmann, Atmos. Chem. Phys., 2017, 17, 1653–1672 CAS.
- P. Molnár, S. Johannesson, J. Boman, L. Barregard and G. Sallsten, J. Environ. Monit., 2006, 8, 543–551 RSC.
- P. Paatero, Chemom. Intell. Lab. Syst., 1997, 37, 23–35 CrossRef CAS.
- P. Paatero and U. Tapper, Environmetrics, 1994, 5, 111–126 CrossRef.
- H. Beuck, U. Quass, O. Klemm and T. A. J. Kuhlbusch, Atmos. Environ., 2011, 45, 5813–5821 CrossRef CAS.
- R. R. Draxler and G. D. Hess, Aust. Meteorol. Mag., 1998, 47, 295–308 Search PubMed.
- R. R. Draxler and G. D. Rolph, HYSPLIT (HYbrid Single-Particle Lagrangian Integrated Trajectory) Model, 2016, http://ready.arl.noaa.gov/HYSPLIT.php Search PubMed.
- A. Stohl, Atmos. Environ., 1998, 32, 947–966 CrossRef CAS.
- S. R. Dorling, T. D. Davies and C. E. Pierce, Atmos. Environ., Part A, 1992, 26, 2575–2581 CrossRef.
- P. Molnár, S. Johannesson and U. Quass, Aerosol Air Qual. Res., 2014, 14, 725–733 Search PubMed.
- P. Molnar and G. Sallsten, Environ. Sci.: Processes Impacts, 2013, 15, 833–838 CAS.
- B. Forsberg, H. C. Hansson, C. Johansson, H. Areskoug, K. Persson and B. Jarvholm, Ambio, 2005, 34, 11–19 CrossRef PubMed.
- M. Ketzel, G. Omstedt, C. Johansson, I. During, M. Pohjolar, D. Oettl, L. Gidhagen, P. Wahlin, A. Lohmeyer, M. Haakana and R. Berkowicz, Atmos. Environ., 2007, 41, 9370–9385 CrossRef CAS.
- C. Johansson, M. Norman and L. Burman, Atmos. Environ., 2009, 43, 4681–4688 CrossRef CAS.
- J. Wichmann, K. Sjoberg, L. Tang, M. Haeger-Eugensson, A. Rosengren, E. M. Andersson, L. Barregard and G. Sallsten, Environ. Health, 2014, 13, 16 CrossRef PubMed.
- P. Molnár, P. Gustafson, S. Johannesson, J. Boman, L. Barregard and G. Sallsten, Atmos. Environ., 2005, 39, 2643–2653 CrossRef.
- K. Torseth, W. Aas, K. Breivik, A. M. Fjaeraa, M. Fiebig, A. G. Hjellbrekke, C. L. Myhre, S. Solberg and K. E. Yttri, Atmos. Chem. Phys., 2012, 12, 5447–5481 CrossRef.
Footnote |
| † Electronic supplementary information (ESI) available. See DOI: 10.1039/c7em00122c |
| This journal is © The Royal Society of Chemistry 2017 |

