
Thermally reversible nanoparticle gels with tuneable porosity showing structural colour†
Z.
Ruff
 *ab,
P.
Cloetens
c,
T.
O’Neill
a,
C. P.
Grey
b and
E.
Eiser
*a
*ab,
P.
Cloetens
c,
T.
O’Neill
a,
C. P.
Grey
b and
E.
Eiser
*a
aUniversity of Cambridge, Cavendish Laboratory, JJ Thompson Ave, Cambridge CB3 OHE, UK. E-mail: zr232@cam.ac.uk; ee247@cam.ac.uk
bUniversity of Cambridge, Department of Chemistry, Lensfield Rd, Cambridge, CB2 1EW, UK
cEuropean Synchrotron Radiation Facility, 71, avenue des Martyrs, CS 40220, 38043 Grenoble Cedex 9, France
First published on 28th November 2017
Abstract
We present colloidal gels formed from dispersions of PEG- and PEG+DNA-coated silica nanoparticles showing structural colour. The PEG- and PEG+DNA-coated silica colloids are functionalized using exclusively covalent bonds in aqueous conditions. Both sets of colloids self-assemble into thermally-reversible colloidal gels with porosity that can be tuned by changing the colloid volume fraction, although the interaction potentials of the colloids in the two systems are different. Confocal microscopy and image analysis tools are used to characteraize the gels’ microstructures. Optical reflection spectroscopy is employed to study the underlying gel nanostructure and to characterize the optical response of the gels. X-ray nanotomography is used to visualize the nanoscale phase separation between the colloid-rich gel branches and the colloid-free gel pores. These nanoparticle gels open new routes for creating structural colour where the gel structure is decoupled from the form factor of the individual colloids. This approach can be extended to create unexplored three dimensional macroscale materials with length scales spanning hundreds of nanometers, which has been difficult to achieve using other methods.
Introduction
Forming three-dimensional macroscopic materials with feature sizes on the order of hundreds of nanometers remains a challenge for many current materials processing techniques. Yet, the control of the morphology of materials at this length scale is a promising approach for optimizing a device's performance and unlocking novel device functionalities. Top-down patterning methods, such as interference lithography,1 have been successful in creating planar geometries on the macro-scale. Bottom up techniques, by contrast, such as those using block copolymers, can be designed to self-assemble in three dimensions,2 but these systems are limited to feature sizes of tens of nanometers and a finite thickness of microns. Colloidal self-assembly can potentially fill this important technological gap.3In colloidal self-assembly, the attraction potentials between colloids can lead to materials with short-range order and characteristic length scales spanning tens of nanometers to tens of microns. There are numerous examples in the literature that take advantage of depletion forces4 and electrostatic interactions5 to form nanoparticle gels. Coating colloids with DNA introduces an additional route for controlling the interaction potentials between particles in a highly selective, tuneable and thermally reversible fashion.6–8 To date, much of the research into DNA coated colloids (DNACCs) has focused on sensing DNA sequences,9 assembling discrete aggregates,10 or forming colloidal crystals.11–13 While colloidal crystals are interesting as model systems for understanding atomic structures and for forming micro-assemblies, they may be unsuitable for forming larger crystals, since the long timescales necessary for achieving equilibrium structures appear to be impractical.
More recently, the ability to tune the interaction potentials of DNACCs has been used to form colloidal gels with characteristic length-scales through a kinetically-arrested spinodal decomposition mechanism.14–16 Unlike systems under thermodynamic equilibrium, these systems can be used to form macroscopic three-dimensional constructs with well-defined porous structures within seconds. This feature of DNACCs may be advantageous in large-scale applications. These gels have morphologies (length-scales) resembling those in natural systems such as bird feathers that display isotropic structural colours, which are also understood to form through spinodal decomposition.17 Here the spinodal decomposition of keratin in cells is believed to lead to quasi-ordered three dimensional structure consisting of proteins and air pockets of characteristic size after the cells dry.18
Recently, creating structural colours with synthetic colloidal systems has gained greater interest in part due to improved methods for synthesising and functionalizing colloids. For example, Takeoka et al. have demonstrated angle-independent structural colour using both soft19 and hard colloids.20 Manoharan and co-workers have formed materials with isotropic colour by condensing suspensions of core–shell particles using depletion forces21 and osmotic pressure.22 In these examples, the materials’ structure factor strongly interferes with the form factor of the colloidal building blocks.
Several strategies have been used to successfully coat a wide array of particles with DNA after the initial demonstration that gold nanoparticles could be coated using metal–thiol bonds. Physio-absorbed amphiphilic polymers have been used to coat both hydrophobic and hydrophilic nanoparticles23,24 with functional groups that allow for subsequent DNA functionalization. More recently click-chemistries have been used to functionalize oxide colloids with DNA using azide-anchors located directly on the surface of nanoparticles25 and on the free ends of polyethylene glycol (PEG) chains embedded in polystyrene micro-colloids in conjunction with surfactants.26
In this work, we take advantage of commercially available components to graft DNA onto silica colloids using exclusively covalent bonding (Fig. 1). 30 nm diameter silica colloids are coated with azide-functionalized PEG chains to which DNA is subsequently reacted, by using a simple two-step reaction carried out in an aqueous environment. We then show that dispersions (gas phase) of both the DNA-NPs and PEG-NPs can be used to form thermally reversible gels, a process that we follow using confocal microscopy. The microstructure of both the DNA-NP and PEG-NP gels is then studied with confocal microscopy and image analysis techniques. Furthermore, we present a X-ray nanotomography image of the DNA-NP gel in the aqueous state showing the morphology of the gel nanostructure. The image is the first demonstration of X-ray tomography on an aqueous sample with sub 100 nm resolution. We show how the optical scattering spectrum of the gels can be used to gain insight into the underlying nanostructure of the colloid-rich gel branches and colloid-free pores. The spectroscopy also demonstrates that the observed structural colour is decoupled from the colloids’ form factor. The phase transition in the PEG-NP samples is phenomenologically different from the cloud point transitions that have been observed in polymer coated nanoparticle systems that aggregate upon heating.27,28 To our knowledge, the observed melt transition has not been well documented in the literature and we discuss the driving forces for this transition.
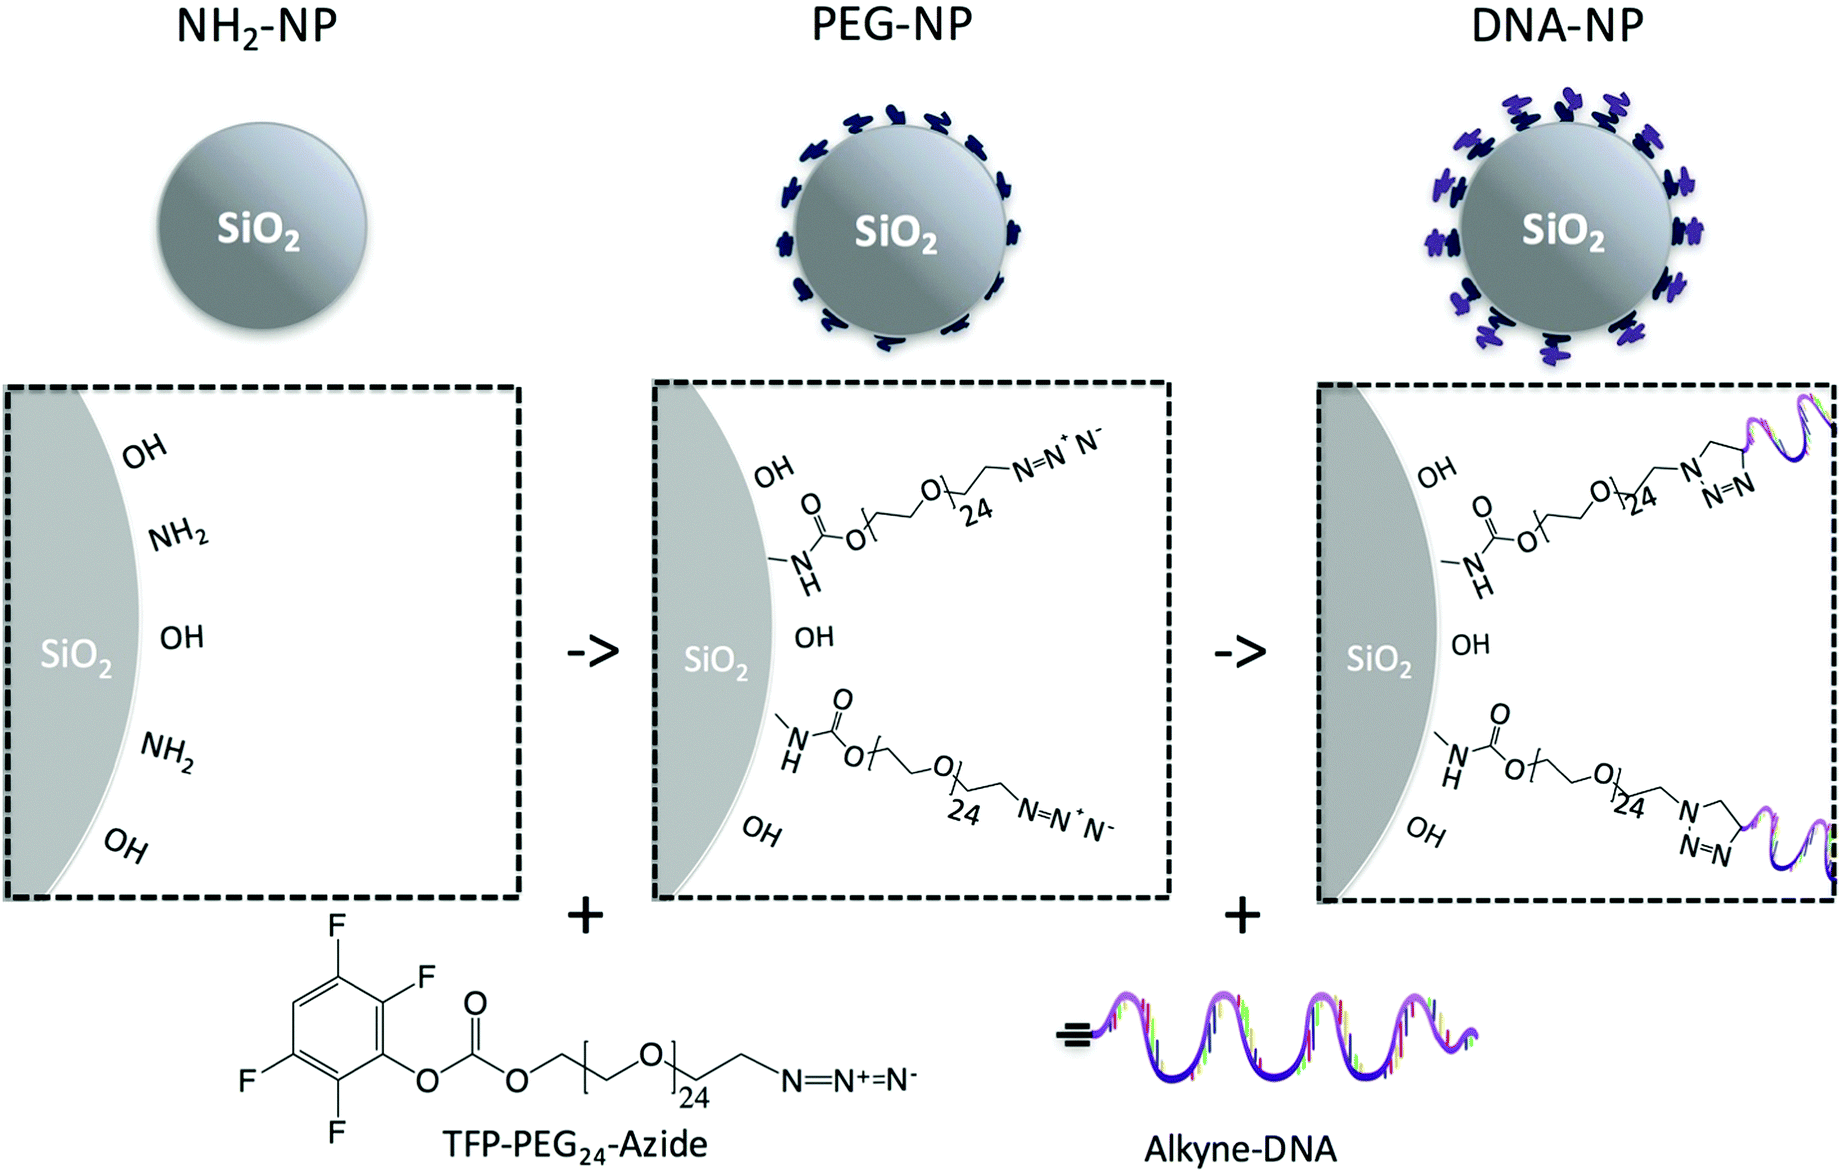 | ||
| Fig. 1 Cartoon depicting the two-step process for functionalizing amine-terminated silica nanoparticles (left). PEG (middle) and then DNA (right) were covalently linked in stepwise a processes. | ||
Experimental
Nanoparticle functionalization
Nominally 30 nm diameter silica colloids with a partially aminated surface (Micromod) were suspended in 10 mM phosphate buffer (PB, pH = 7.4) at a concentration of 2.5 mg ml−1 and sonicated for 15 minutes. 1 mg of the heterobifunctional PEG reagent with a tetrafluorophenyl (TFP) ester on one end of the PEG chain with 24 repeat units and an azide group at the other (TFP–PEG24–azide, Quanta Biodesign, with certified purity >90%, Fig. 1) in 10 μl of anhydrous DMSO (dimethyl sulfoxide) was then added per ml of the colloidal suspension and allowed to react overnight. The PEG functionalized nanoparticles were then washed by centrifugation three times in PB to remove excess reagent. The PEG reaction also was performed in 10 mM aqueous buffers of 2-(N-morpholino)ethanesulfonic acid (MES, pH = 6.0) and carbonate (pH = 9.0 and pH 10.0) as well as anhydrous DMSO with and without adding 5% triethylamine (TEA).The PEG-NP dispersions were then reacted with 50 nM of single-stranded (ss) DNA sequences, either A or A′, per 2.5 mg of NP. Both sequences consist of an alkyne group at the 5′ end followed by a 15T spacer and a 7 bases long binding motif (A = /5Hexynyl/TTT TTT TTT TTT TTT TTT GGT GCT G-3′; A′ = /5Hexynyl/TTT TTT TTT TTT TTT TTT CAG CAC C-3′; purchased from IDT). The melt temperature of the binding motif is Tm = 28 °C (10 mM PB and 100 mM NaCl). Copper sulfate (0.1 mM) and sodium acetate (5 mM) were used to catalyze the reaction. After 30 minutes, a concentrated buffer solution with 2 M sodium chloride was added to increase the salt concentration of the suspension to 150 mM and the reaction was left to proceed overnight. The DNA-NPs were then washed three times in PB to remove any unbound DNA from the solution. All chemicals were from Sigma Aldrich unless otherwise noted.
Nanoparticle characterization
Dynamic light scattering (DLS) and electrophoretic measurements (Malvern, Zetasizer ZS or ZSP) were used to monitor the nanoparticle conjugation process. The DLS and zeta-potential measurements were made in 10 mM PB with no added NaCl.A fluorescence assay was used to quantify the number of azide terminated PEG ligands available for the subsequent click reaction. A dibenzylcyclooctyne (DBCO) molecule with a red fluorescent dye (Jena Biosciences, DBCO-Sulfo-Cy5) was reacted with the azide functionality of PEG-NPs for 24 hours. The PEG-NPs were then sedimented from the solution using centrifugation and the fluorescence of supernatant was measured at 665 nm (Varian Cary Eclipse). The fluorescence of the supernatant was compared to a series of concentration standards to determine the dye concentration in solution. The dye concentration in solution was subtracted from the total dye concentration used and divided by the number of particles in solution to give the number of PEG ligands per particle.
A similar strategy was used to quantify the amount of DNA on each nanoparticle.29 Fluorescently tagged DNA complementary (/5Cy3/TTT TTT CAG CAC C, IDT) to the DNA bound to the nanoparticles was added to the DNA-functionalized nanoparticle-solution in 500 mM NaCl. The nanoparticles were then sedimented under centrifugation and the concentration of the DNA in the supernatant was subtracted from the total amount added to the nanoparticle solution by comparing to a series of standards as measured from the fluorescence at 565 nm.
Confocal microscopy and image analysis
Colloidal gels were formed by mixing concentrated solutions of green fluorescent colloids coated with either complementary DNA (A and A′, at a 1![[thin space (1/6-em)]](https://www.rsc.org/images/entities/char_2009.gif) :1 ratio) or PEG and 2 M NaCl to obtain colloidal gels with volume fractions ϕ = 1%, 2%, 5% and 10% in phosphate buffered saline (PBS, 10 mM PB and 100 mM NaCl). The suspensions were loaded into glass capillaries with rectangular cross-sections (0.2 mm × 4 mm, Vitrocom) and sealed with a two-component epoxy. The silica-nanoparticle gels were then imaged using an inverted laser confocal microscope (Leica TCS SP5). The samples were heated and cooled using a home-built Peltier heating stage. A 63× oil-immersion objective with a numerical aperture (NA) of 1.4 was used to image samples at room temperature, while a 40×, 0.75 NA air objective was used to image the heated samples to prevent damage to the immersion objective. Since immersion objectives also act as heat sinks, measurements with this objective were only made at room temperature.
:1 ratio) or PEG and 2 M NaCl to obtain colloidal gels with volume fractions ϕ = 1%, 2%, 5% and 10% in phosphate buffered saline (PBS, 10 mM PB and 100 mM NaCl). The suspensions were loaded into glass capillaries with rectangular cross-sections (0.2 mm × 4 mm, Vitrocom) and sealed with a two-component epoxy. The silica-nanoparticle gels were then imaged using an inverted laser confocal microscope (Leica TCS SP5). The samples were heated and cooled using a home-built Peltier heating stage. A 63× oil-immersion objective with a numerical aperture (NA) of 1.4 was used to image samples at room temperature, while a 40×, 0.75 NA air objective was used to image the heated samples to prevent damage to the immersion objective. Since immersion objectives also act as heat sinks, measurements with this objective were only made at room temperature.
To estimate the melt transition temperature of DNA-NP gels, a ϕ = 2% sample was heated from 25 °C in 10 °C steps to 75 °C. A sample was imaged after holding it for 15 minutes at each temperature to assure thermal equilibrium. The process was then repeated upon cooling. The procedure was also used for a ϕ = 2%, PEG-NP sample.
Samples of the DNA-NP and PEG-NP gels were homogenized in the colloidal gas phase at 70 °C for 1 hour and then cooled to room temperature at 2 °C min−1 and then imaged. The structure factor of the gel was calculated by taking the radial average of the Fourier transform of the gelled image intensity and dividing it by that of an image of freely dispersed colloids (gas phase), which we obtained from a sample without added NaCl.30 Real-space chord analysis, explained in the ESI,† was done by measuring the lengths of chords passing either through the gel branches or pores in the x and y directions, which where plotted as a histogram of the frequencies of each chord length. The histogram was fitted with a exp(−λ/r) dependence (where r is measured in both the x and y direction) to obtain the characteristic length scales, λ, of the colloid-rich and colloid free phases separately.14,31
Optical spectroscopy
To study the nanostructure of the gels, samples of non-fluorescent PEG-NP and DNA-NP gels were made at ϕ = 15%, 25% and 35% in PBS in capillaries with rectangular cross-sections (0.2 mm × 2 mm, Vitrocom). The concentrated NaCl solution was added to the capillary before adding the nanoparticles and the samples were allowed to equilibrate overnight, as the gelled samples were too viscous to pipette. The gels were heated above their melt temperature for an hour and then quenched to room temperature by placing them on a thick aluminum sheet. A capillary loaded with PBS was prepared as a reference. Samples of non-coated silica nanoparticle suspensions were prepared as controls.The reflection spectra of the samples were measured perpendicular to the capillary using a light microscope (Zeiss AX10, diagram in ESI†). A water immersion objective (Zeiss, 40×, NA = 0.75) was used to couple light into and out of the samples. A beam-splitter allowed for light to be collected simultaneously with a colour CMOS camera (IDS, UI-3580LE-C-HQ) and a spectrometer (Avantes, SensLine) through a 600 μm optical fiber (Avantes, FC-UV600-2-SR). The input of the fiber was aligned to ensure that light was collected from the center of the sample and in the same focal plane as the camera image. The reflected spectrum was taken from several different focal planes (z) and locations (x–y) inside the sample and were found to be invariant with position, suggesting that the samples were isotropic on the scale of our resolution. The spectral responses of the gels were referenced to a PBS filled capillary to minimize the effect of reflections from the glass capillary. The camera's colour balance was referenced to a white diffuser, certified reflectance standard (Labsphere, USRS-99-010 AS-01158-60).
X-ray nanotomography
X-ray nanotomography was performed at the nano-imaging beamline at the European Synchrotron Radiation Facility (ESRF, beamline ID16A-NI).32,33 A 35% DNA-NP gel was loaded into a Mark-style borosilicate capillary (0.3 μm inner diameter) and sealed with epoxy. Magnified phase contrast images of the sample were collected over 1800 angles at four detector distances and an X-ray energy of 17 keV. A phase retrieval algorithm, in conjunction with a tomographic reconstruction algorithm, were used to generate a three-dimensional image of the colloidal gel in the aqueous state, which will be shown in a separate publication. The full tomographic volume sampled was 71.7 μm × 71.7 μm × 71.7 μm (2048 pixels × 2048 pixels × 2048 pixels) with a pixel size of 35 nm. Here, we present a single two-dimensional cross-section extracted from the volume.Results
Nanoparticle functionalization and characterization
Amine-functionalised NPs were first functionalised with the heterobifunctional PEG reagent with the amine groups reacting with the TFP ester to covalently link the PEG chains to the NPs. In the second step, DNA was covalently attached to the PEG coating using the copper catalysed azide–alkyne Huisgen cycloaddition. The centrifugation and resuspension procedure after each functionalization step removed any residual polymers or ssDNA oligomers from the nanoparticle dispersions.Fig. 2 shows the results of the DLS and zeta-potential measurements after each reaction step. The hydrodynamic diameter of the colloids increased from 27 nm (NH2-NP) to 37 nm (PEG-NP), to 38 nm (DNA-NP). DLS measurements showed negligible aggregation after both reaction steps. The zeta-potential of the nanoparticles (−35 mV to −31 mV) became slightly more positive after the PEG reaction step and then became more negative again after the DNA attachment (−36 mV). Fluorescent assays showed that the areal density of PEG was approximately 1012 cm−2 (104 nm2 per oligomer) or 27 chains per 30 nm diameter colloid. The DNA coating density was found to be similar to that of the PEG coating density within experimental error (±5%). This finding suggests that all grafted PEG-azide ends were successfully functionalized with DNA via click chemistry.
 | ||
| Fig. 2 Dynamic light scattering (blue circles) and zeta-potential (red triangles) measurements of 30 nm diameter non-fluorescent silica nanoparticles performed in 10 mM PB, 0 M NaCl. | ||
The surface coating density corresponds to an approximate inter-anchor spacing of 10 nm, which is larger than the radius of gyration of the PEG chains (here Rg(PEG) ≈ 2.5 nm; see ESI†). The radius of gyration of the PEG chains is less than the average distance between PEG anchoring sites on the colloid surface (Fig. 3). This result suggests that the PEG chains are in a mushroom (un-stretched) regime rather than the “brush” (stretched) regime.34 Therefore, there are likely exposed areas on the silica surface (Fig. 3). This grafting density is approximately 2 times lower than what has been reached by silanization of silica colloids with azides and DBCO-DNA25 and an order of magnitude less than what has been achieved by coating colloids with azide functionalized amphiphilic polymers and DBCO-DNA.24
 | ||
| Fig. 3 Cartoon depicting PEG chains in a good solvent in (left). Attractive bridging interactions between PEG chains and the surface of the silica colloid potentially result in aggregation (right). Ellipsoids highlight the areas of bridging-interactions. | ||
We tested whether the PEG coating density, using our procedure, could be increased as a function of pH. At lower pH values, the hydrolysis rate of the TFP-ester decreases, allowing more time for the PEG chains to diffuse to the nanoparticle surface without a loss in reactivity. While at higher pH values more of the amine groups deprotonate, increasing the number of available surface reaction sites. For reactions in aqueous buffer solutions, the highest density of PEG coating was found to be in PB buffer (pH = 7.4) using the fluorescence assay. A ten-fold increase in the concentration of PEG in solution did not increase the coating density in PB. However, it was found that it was possible to increase the density of the PEG coating by approximately 50% using the mixture of anhydrous DMSO and TEA in ambient conditions. This suggests that the density of the coating could be improved using organic solvents and hydroscopic conditions (ESI,† Fig. S2). Nevertheless, the increase in grafting density was not sufficient to move the PEG chains from the mushroom to the brush regime, since this would require a coating at least twice the density we have achieved in this work. Therefore, the subsequent experiments were not repeated using nanoparticles coated in these conditions; instead we used the nanoparticles prepared in PB, since the procedure did not require solvent exchange.
Gel formation and phase transitions
Colloidal gels were formed by mixing solutions of green fluorescent colloids coated with either complementary DNA (A and A′) or PEG to obtain colloidal gels with volume fractions, ϕ = 1%, 2%, 5% and 10% in PBS. The melt transition temperature of the ϕ = 2%, DNA-NP gel was estimated by heating the sample from 25 °C to 75 °C and imaging it at 10 °C intervals (Fig. 4). A phase transition from the as prepared colloidal gel to the gas phase was observed between 55 °C and 65 °C. When the sample was cooled again below the melt temperature, a homogenized colloidal gel was formed. We note that although the melt transition of the DNA-NP was sampled every 10 °C, we expect the phase transition for the DNA-NP to occur over a few °C, due to the collective binding of the DNA strands.8,35 Indeed, for systems with very high DNA grafting densities, the transition can be as sharp as 1 °C.16,35 Observations of similar DNA-functionalized colloidal systems support our assumption that the melt temperature of DNA-NP gels is independent of volume fraction.14,36 Note that while the individual silica nanoparticles are homogeneously distributed throughout the sample above the systems’ melt temperature (Fig. 4, image at 65 °C), they will sediment slightly when they aggregate. Hence, we image the aggregated sample close to the bottom surface of the sample cell, where the local colloidal volume fraction will be higher (Fig. 4, image at 25 °C and 55 °C).16,34 However, the overall volume fraction integrated over the entire sample thickness will be 2%. Using a similar heating and imaging procedure, we were surprised to find that the ϕ = 2%, PEG-NP samples also underwent a thermally reversible melt transition, albeit at a lower temperature (between 45–55 °C; see Fig. S7 in the ESI†). | ||
| Fig. 4 Confocal micrographs of DNA-NP sample with ϕ = 2% starting at 25 °C, heated to 55 °C, 65 °C and subsequently returned to 25 °C. The gel transitions from the gel to the gas phase is between 55 °C and 65 °C. Scale bar is 20 μm for all micrographs. | ||
Confocal microscopy of gel microstructure
Confocal microscopy was used to study the gel microstructure down to the optical diffraction limit, with a pixel volume of approximately 200 nm × 200 nm × 500 nm. The intensity a pixel receives will be proportional to the number of colloids inside that volume, such that the underlying nanostructure is averaged over a pixel (Fig. 5). Fluorescent NP gels with 10% colloidal volume fractions, prepared by transferring the sample from the gas into the spinodal decomposition region by cooling them below the systems’ melting temperature, had features spanning only a couple of pixels and the microstructure could not be resolved with confidence. Nonetheless, the confocal images taken at lower colloidal volume fractions (ϕ = 1%, 2% and 5%) do give valuable insight into the gel microstructure that can be used to understand the gel branches. Note that ϕ refers to the silica content alone. We gain further insight into the gel nanostructure by measuring the gel's optical reflectivity in the next section. | ||
| Fig. 5 Confocal microscopy images and their respective structure factors, S(q), of DNA-NP and PEG-NP gels at ϕ = 1%, 2% and 5%. S(q) has been normalized to the maximum of the structure factor of each sample. The x-axis is a log-scale. All samples were measured at room temperature near the bottom surface of the capillary. Scale bar for all micrographs is 20 μm. The cartoon on the top right compares the length-scales of the colloids and the gel structure to the inherent resolution of confocal microscopy illustrating the limitation of the approach. | ||
As ϕ increases, the colloid-rich phase fills a greater area of the confocal images. The decrease in the micro-porosity with increasing ϕ is reflected numerically in both an increase in S(q) at higher wave-vectors and the decrease in the characteristic length scale of the pores extracted from chord analysis (Fig. 6). The characteristic length-scale of the colloid-rich phase remains constant with increased ϕ. Therefore, an increased ϕ leads to a greater number of micro-gel branches in the system rather than a thickening of the branches, as was previously demonstrated in simulation studies.3 The S(q) data has a broad peak, which is typical for the absence of long-range order.
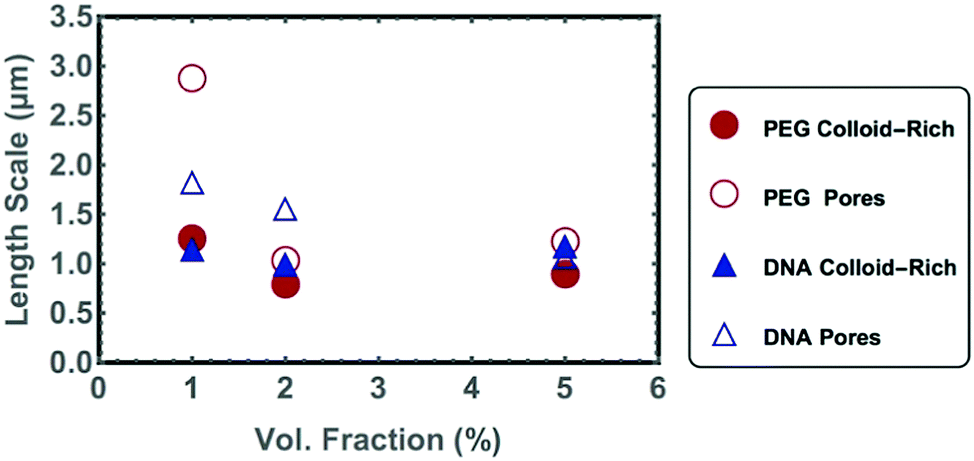 | ||
| Fig. 6 Characteristic length scales of gel pores and colloid rich phases as calculated using chord analysis of DNA-NP and PEG-NP gels at colloidal volume fractions, ϕ = 1%, 2% and 5%. | ||
Because the samples with low ϕ scattered only weakly, it was possible to image deep inside the samples. In fact, the imaging depth was limited only by the relatively short working distance of the immersion objective used and the wall thickness of the flat capillaries. Confocal stacks of images were taken up to 70 μm into the gel (videos in ESI†). Although the gel appeared homogenous in-plane at a given height in the sample, we also observe that the local colloidal volume fraction in the gel decreased as we imaged deeper into the gel. This is simply due to sedimentation of aggregates during gel formation. In the colloidal gas phase, the 30 nm diameter nanoparticles are homogenously distributed in all 3 dimensions, as the gravitational height of the particles is larger than the thickness of the capillary itself. However, when the particles aggregate their gravitational height decreases, promoting sedimentation. A similar effect was observed in a system of DNA-functionalized fluorinated colloids36 and suggests that the binding between the particles is sufficiently fast and strong to withstand the full collapse of the gel due to gravity. Nevertheless, the gel does appear to percolated throughout the capillary volume for values of ϕ down to 1%. Electronic percolation has also been observed in similar sized carbon particles with ϕ = 1%.37 An effective volume fraction of the gel cannot be calculated from the chord analysis at different depths into the gel, because it is unclear how the colloids pack inside of the confocal pixel volume. Nevertheless characteristic length-scales for the gel-rich and colloid-poor regions could be extracted using chord analysis (Table 1).
| ϕ [μm] | PEG-NP gels | DNA-NP gels | ||||
|---|---|---|---|---|---|---|
| 1% | 2% | 5% | 1% | 2% | 5% | |
| λ pore | 2.9 | 1.0 | 1.2 | 1.8 | 1.6 | 1.1 |
| λ gel | 1.3 | 0.8 | 0.9 | 1.2 | 1.0 | 1.2 |
| 2π/qmax | 1.2 | 1.8 | 1.4 | 1.4 | 1.9 | 1.6 |
Optical spectroscopy and the gel nanostructure
Both PEG-NP and DNA-NP gels showed a blue colour with an intensity that increased with an increased ϕ of colloids in the sample (Fig. 7). There is a peak in the reflectivity at approximately 385 nm. At shorter wavelengths, there is a relatively sharp decrease in reflectivity and at longer wavelengths, the reflectivity decreases more gradually and can be fitted by a λ−4 dependence. The uncoated silica nanoparticles showed a relatively flat response slightly lower in magnitude than the PBS reference. | ||
| Fig. 7 (top) Images taken in reflection from the centre 500 pixels × 500 pixels of the camera image (43.9 μm × 43.9 μm). (bottom) Corresponding reflectivity measurements of the PEG-NP (left) and DNA-NP gels (right) taken perpendicular to the gel samples referenced to a capillary filled with PBS. For comparison, the reflectivity curves taken from a suspension of uncoated silica nanoparticles and a 1/λ4 fit as a guide. | ||
X-Ray nanotomography
A two-dimensional slice taken from a section of the tomography image is shown in Fig. 8. The 35% DNA-NP gel was homogenous over the sample volume of the tomography. The pixel size of the image shown is 35 nm, allowing us to visualize the morphology of the colloid-rich (dark) and colloid-free phase (bright regions) in the aqueous sample. The diameter of individual colloids is similar to the pixel size of the tomography and therefore the position of individual colloids cannot be resolved with certainty. The tomography shows a clear phase separation of high-density (colloid-rich) and the low-density phase (colloid-pore) on the scale of a few pixels.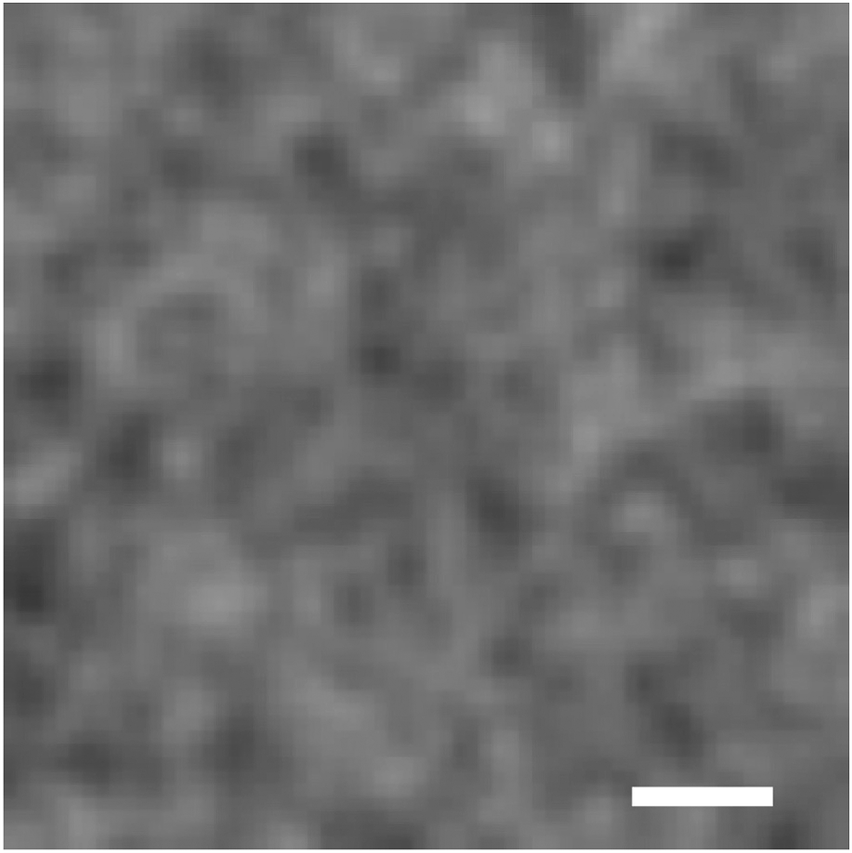 | ||
| Fig. 8 2D image of ϕ = 35%, DNA-NP gel taken using X-ray nanotomography. The high density phase (colloid-rich) is dark and the low density phase (colloid-free) is bright. Image shows phase separation of the gel on the nanoscale. The scale bar is 280 nm and the image is 64 pixels by 64 pixels. | ||
Discussion
Nanoparticle functionalization
Our functionalization strategy attempts to address the challenge of maintaining colloidal stability in the high salt environment necessary for allowing strongly charged DNA strands to diffuse close enough to a colloid's surface to react. In addition, we wanted to limit our reagents to commercially available components and reactions that could be performed in aqueous environments for simplicity and to increase the applicability of the approach to other materials. The PEG spacers helped to sterically stabilize the colloids and acted as an attachment point for further functionalization. The terminal azide provided a highly reactive group that is stable against hydrolysis, allowing for the excess PEG reagent to be washed away without loss of subsequent reactivity. By moving the reaction site away from the surface of the nanoparticle, the electrostatic interactions between the DNA and the nanoparticles surface become less important, reducing the need for optimizing the salting process commonly employed in DNA colloidal conjugates.38In the second step of our procedure, DNA was attached to the PEG coating using the copper catalysed azide–alkyne Huisgen cycloaddition. This reaction was chosen due to its fast kinetics, but other chemistries that are sufficiently resistant to hydrolysis could also be used. Copper ions have been shown to damage DNA through chain scission, crosslinking and oxidation,39,40 but any induced damage was not significant enough to be observed as an impediment in this work. The complete reaction of the azide groups on the PEG oligomers with the alkyne functionalized DNA was somewhat unexpected as additional ligands are often necessary to achieve 100% loading.41 The high yield of this reaction is potentially due to the large excess of the alkyne groups with respect to the azide groups.
The generality of this approach can be extended to nanoparticles composed of other materials due to the range of conjugation terminal functional groups that can be introduced to either end of PEG chains. These polymers can either be synthesized in the lab using established techniques or purchased from commercial sources.
The DLS and zeta-potential measurements provided a simple method for following the nanoparticle functionalization reactions. Although the measurements are simple to perform, both measurements have inherent uncertainty in the results, since they rely on fitting data. Silica colloids have a broad size distribution, especially below 100 nm, but since DLS measures an averaged hydrodynamic diameter, the measurement should reflect a shift in the size distribution. Nonetheless, the results should be taken with caution as such a small change in diameter cannot be resolved with absolute certainty.
We attribute the small decrease in the zeta potential of the nanoparticles after the PEG reaction step to an increase in the diameter of the nanoparticles after the coating, where the slip-plane of the solvation sphere is pushed further away from the surface of the nanoparticle.42 Neutralizing the amine groups on the surface would otherwise make the zeta-potential more negative at a pH of 7.4. We hypothesize that the small change in zeta potential is due to the relatively low density of the PEG coating and short length of the PEG chains. In previous work, we have observed that the zeta-potential of PEG coated colloids approaches zero with dense coatings of 5 kDa MW PEG chains,36 the chain lengths being five times longer than we use here. It also has been shown that the zeta-potential of silica colloids with physically absorbed PEG chains decreases with both increased molecular weight and the number of absorbed chains.43 The zeta-potential after DNA conjugation becomes more negative, which we attribute to the increase in surface charge due to the strongly charged backbone of the DNA oligomers.
Gel formation and structure
At the temperatures and salt conditions used here, water is a good solvent for PEG chains. Nonetheless, even in good solvent conditions, PEG chains have some propensity to adsorb to bare silica surfaces. In an earlier study, we have shown that bare silica beads stick to DNA-brushes with free ssDNA ends and to PEG chains at the pH and salt concentration used here.44 Such polymer to surface interactions or bridging attractions have been shown to lead to colloidal aggregation in certain conditions (Fig. 3).45,46In our PEG-NP system, we hypothesize that the free ends of the PEG chains bridge to the uncoated portions of adjacent silica colloids at low temperatures. When the sample is heated, the colloids become dispersed forming a colloidal gas phase simply because the increased thermal motion of the colloids is high enough to overcome the weakly attractive van der Waals interactions between the PEG chains and the bare colloid surfaces. This attraction will be only of the order of few kBT (here kB is the Boltzmann constant).47
In water, PEG chains have both a lower and upper critical solution temperature (LCST, UCST). Shay et al. showed that the critical temperature for PEG-NP aggregation can be almost 100 °C lower than the LCST of free PEG chains in solution, which is about 170 °C.27 A more recent numerical study suggests that the phase transition in colloidal suspensions with low-PEG grafting densities are most likely due to polymer bridging.48 The lower critical temperature of PEG-NPs can be further lowered by increasing the salt concentration in solution.28 In this context, note that our PEG-NP samples in 10 mM PB buffer and no added NaCl salt remained in the gas phase throughout the explored temperature range. In other relevant colloid–polymers systems the polymer chains were not grafted to the colloids.45,46 At low temperatures, these colloidal systems were prevented from reaching our observed transition. In cases where the polymers were strongly absorbed to the colloid surface, no colloidal gelation was observed due to sufficient steric stabilization.41 Alternatively, in systems where the polymers were not strongly absorbed to the colloids, the colloids did aggregate at low temperatures, but the transition was instead driven by depletion interactions,45 which we do not have in our system due to the absence of free polymers.
We plan to investigate the phase space for the observed gelation transition further in the PEG-NP through varying the PEG grafting density, salt concentration, pH and PEG molecular weight. Our system of silica colloids with low PEG-grafting densities offers an alternative approach to forming macroscopic colloidal assemblies and to study further polymer–colloid interactions.
In the DNA-NP system, the aggregation behavior has an additional contribution from the DNA hybridization energy, which provided a binding strength on the order of 10 kBT per AA′ pair.49 Despite the difference in binding mechanism between the PEG-NP and DNA-NP gels we observe only small differences between the measured S(q). This observation supports our hypothesis that the main driving force for aggregation in the PEG-NP system is the non-specific bridging interactions between the sparsely coated silica particles. However, the additional attraction provided by the DNA hybridization leads to a slightly narrower S(q) at higher volume fractions for the DNA-NPs. This is in agreement with the findings that strongly attracting colloids simply show more rapid kinetic arrest when quenched into the spinodal decomposition region3,14 than weaker short-ranged attractive interactions of less than a few kBT.47 It is also interesting to note that the cord analysis data (Table 1) suggest that the PEG-NP gels are more compact than the DNA-NP gels. In all three volume-fractions studied the average pore sizes are systematically larger and the gel arms smaller in the PEG-NP gels. This again supports our hypothesis that the weaker PEG–colloid attraction allows for rearrangements within the gel phase, so that the PEG-NP gel arms becomes more compact and thicker over time; this is not possible in DNA-NP gels where the increased attraction from the complementary DNA chains prevents the colloids from arranging into a lower free energy minimum.
The two relevant length scales for understanding the optical properties of the gels are those of the individual colloid-rich gel branches and the colloid-free pores. We expect the gels to scatter visible light when the dimensions (ar) of become similar to the wavelength of light (ar = λr/(2neff)). An effective index of refraction of the colloid-rich phase (n = 1.40) was calculated using the Maxwell–Garnett relation50 (ESI†) and assuming random close colloidal packing (ϕ = 63%),51 where the effective refractive index arises from a weighted average of the silica colloids (n = 1.45) and the buffer solution (n = 1.33). A random close-packed system represents the upper bound for the refractive index of the colloid-rich phase. This leads to a range of optically active feature sizes from approximately 143 nm for blue light (400 nm) to 250 nm for red light (700 nm). In previously published work,14 500 nm DNA coated polystyrene colloids were found to form gel branches with an average thickness corresponding to four colloidal diameters. Colloidal branches made of four 30 nm diameter colloids correspond to the lower bound of the predicted optically active feature size. Indeed, the X-ray nanotomography image (Fig. 8) shows gel branches of roughly 120 nm on average, supporting that the same scaling of structural arrangement holds for DNA-functionalized nanoparticles as was found for DNA-functionalized micron-sized colloids. We also note that the presented X-ray tomography image is the first of its kind for imaging aqueous samples with such a high spatial resolution.
The 1/λ4 dependence of the reflectivity is in good agreement with Raleigh–Gans theory, which assumes both a small refractive index difference between the scattering object and the surrounding media, and that ar is similar to the incident wavelength.52 The scattering of wavelengths throughout the visible spectrum can also be attributed to the variation in the gels’ short-range order. The spatial variation of the gels’ response can be seen in more detail in a 5 times enlargement of a selected camera image shown in Fig. 7 (ESI,† Fig. S6), which displays a variation in the gels’ local structure as a function of position. The sharp decrease in reflectivity at shorter wavelengths may be partially attributed to the absorption edge of silica and glass at shorter wavelengths.
The magnitude of the reflectivity increases at higher ϕ as the scattered intensity is proportional to the square of the volume of the scattering objects, while the shape of the reflectivity curves remains unchanged. We hypothesize that an increased ϕ leads to more branches forming in the gel, rather than an increase in the thickness of the gel branches. This hypothesis is consistent with the decrease in the gel micro-porosity with increased ϕ from confocal microscopy.
The stronger reflectivity of the PEG-NP gels could potentially be due to the weaker bridging attraction between the PEG coated nanoparticles, which do not have the additional term stemming from the DNA binding. The lower attraction may have allowed the PEG-NPs to rearrange into more compact gel arms with higher average refractive index than the fully arrested DNA-NP gels. After about a week, the PEG-NP began to locally reach their crystalline equilibrium state, (ESI,† Fig. S4). Such crystallization was not observed in the gels with DNA-binding, suggesting that the stronger attraction leads to more stable gels. As pointed out above, this weaker attraction also is responsible for the broader peak in S(q), showing that there is a larger distribution of micro-pores in the PEG-NP gels than in the DNA-NP gels at low ϕ. The decreased optical response of the uncoated nanoparticle control sample with respect to the reference is likely due to the increased refractive index of the nanoparticle suspension compared to the PBS reference, which reduces the magnitude of the reflections at the solution/capillary interface.
In the artificial systems generating structural colour discussed in the introduction, the structure factor is determined by the form factor of the colloids. Here, we can decouple the form factor of the colloidal building blocks from the nanoscale structure factor by starting from dense transparent colloidal suspensions that only scatter light when gelled. The transparency of the colloidal dispersions is a result of the negligible optical scattering cross-section of the colloids due to a combination of the colloids small diameter (λ ≫ d) and the low index contrast with the surrounding buffer solution as well as the low intrinsic optical absorption of silica. By decoupling the structure from the form factor, it may be possible in future work to access colours that are not easily generated in some other synthetic systems.53
The magnitude of the optical reflection spectra of the gels for all ϕ are less than 10% when referenced to the white diffuser, which is a more relevant reference for comparing our results to alternative approaches to generating structural colour (ESI,† Fig. S5). Colloidal gels formed using higher index materials could potentially increase the peak intensity of the reflectivity. In bird feathers, high-index contrast structures made from proteins and air have a reflectivity approaching 50%.18,54
The degree of the scattering coherence between the gel branches remains unclear, as confocal microscopy was not able to generate a real-space image of the distances between the gel branches. Obtaining high quality electron micrographs of the gel that would be comparable to those taken of bird feathers18,54 requires drying the gel, which may fundamentally alter the nanostructure. One possibility to retain the structure could be super-critical drying. Our attempt at in situ scanning electron microscopy of the gel did not allow for sufficient electronic contrast between the silica colloids and the aqueous background. We are currently preforming confocal microscopy studies on gels made from colloids with a range of diameters above the diffraction limit to study how the characteristic size of the gel pores and gel branches scale with the colloid diameter.
A more detailed tomographic study of the nanoparticle gels is planned, including samples with lower volume fractions. Small angle X-ray scattering measurements (SAXS) will also be performed to measure S(q) at the nanoscale and resolve the length-scales of the gel branches and gels pores with more confidence. Together, the X-ray nanotomography and SAXS should allow us to resolve the degree of the scattering coherence between the gel branches and to improve the understanding of light scattering in the nanoparticle gels.
Conclusions
We have developed colloidal gels with feature sizes of hundreds of nanometers using functionalized 30 nm silica colloids. The novel chemistry presented allows for DNA-functionalization of silica colloids using only aqueous conditions and covalent bonds unlike previous methods. This strategy could potentially be applied to a variety of materials systems due to the flexibility of functional groups that can be used in this approach. The PEG-NP gels present an opportunity to form materials using a simplified approach.The morphology of the nanoparticle gels can be tuned by changing the colloid volume fraction. As ϕ increases, the porosity of the gels decreases and leads to more gel branches. The gel branches preferentially reflect blue light leading to gels that display structural colour. As ϕ increases, the gel reflects more strongly, which we hypothesize is due to more gel branches being formed rather than a coarsening of the gels branches. The degree of scattering coherence remains a question that will be explored in future work. The magnitude of the optical reflectivity can potentially be improved using colloids with higher refractive indices and by engineering the interaction potentials of the colloids to increase the short-range order of the gel nanostructure.
Conflicts of interest
There are no conflicts to declare.Acknowledgements
EE, CPG and ZR thank the Winton Program for the Physics of Sustainability for financial support. CPG and ZR acknowledge support from the EU ERC FP7 programme via an advanced fellowship for CPG. We acknowledge the ESRF for providing beamtime (proposal SC-4594). We would like to thank Silvia Vignolini for invaluable discussions regarding the optical spectroscopy and interpretation, Giulia Guidetti and Roxanne Middleton for assisting with the optical spectroscopy and colour imaging setup and Yang Lan for helping to create the cartoon in Fig. 5.References
- V. Berger, O. Gauthier-Lafaye and E. Costard, J. Appl. Phys., 1997, 82, 60–64 CrossRef CAS.
- J. Y. Cheng, A. M. Mayes and C. A. Ross, Nat. Mater., 2004, 3, 823–828 CrossRef CAS PubMed.
- F. Varrato, L. Di Michele, M. Belushkin, N. Dorsaz, S. H. Nathan, E. Eiser and G. Foffi, Proc. Natl. Acad. Sci. U. S. A., 2012, 109, 19155–19160 CrossRef CAS PubMed.
- P. J. Lu, E. Zaccarelli, F. Ciulla, A. B. Schofield, F. Sciortino and D. A. Weitz, Nature, 2008, 453, 499–503 CrossRef CAS PubMed.
- Z. Emanuela, J. Phys.: Condens. Matter, 2007, 19, 323101 CrossRef.
- C. A. Mirkin, R. L. Letsinger, R. C. Mucic and J. J. Storhoff, Nature, 1996, 382, 607–609 CrossRef CAS PubMed.
- A. P. Alivisatos, K. P. Johnsson, X. Peng, T. E. Wilson, C. J. Loweth, M. P. Bruchez and P. G. Schultz, Nature, 1996, 382, 609–611 CrossRef CAS PubMed.
- N. Geerts and E. Eiser, Soft Matter, 2010, 6, 4647 RSC.
- S.-J. Park, T. A. Taton and C. A. Mirkin, Science, 2002, 295, 1503–1506 CrossRef CAS PubMed.
- W. Liu, J. Halverson, Y. Tian, A. V. Tkachenko and O. Gang, Nat. Chem., 2016, 8, 867–873 CrossRef CAS PubMed.
- D. Nykypanchuk, M. M. Maye, D. van der Lelie and O. Gang, Nature, 2008, 451, 549–552 CrossRef CAS PubMed.
- S. Y. Park, A. K. R. Lytton-Jean, B. Lee, S. Weigand, G. C. Schatz and C. A. Mirkin, Nature, 2008, 451, 553–556 CrossRef CAS PubMed.
- Y. Wang, Y. Wang, X. Zheng, É. Ducrot, J. S. Yodh, M. Weck and D. J. Pine, Nat. Commun., 2015, 6, 7253 CrossRef CAS PubMed.
- L. Di Michele, F. Varrato, J. Kotar, S. H. Nathan, G. Foffi and E. Eiser, Nat. Commun., 2013, 4, 2007 Search PubMed.
- N. Geerts, T. Schmatko and E. Eiser, Langmuir, 2008, 24, 5118–5123 CrossRef CAS PubMed.
- Z. Ruff, S. H. Nathan, R. R. Unwin, M. Zupkauskas, D. Joshi, G. P. C. Salmond, C. P. Grey and E. Eiser, Faraday Discuss., 2016, 186, 473–488 RSC.
- E. R. Dufresne, H. Noh, V. Saranathan, S. G. J. Mochrie, H. Cao and R. O. Prum, Soft Matter, 2009, 5, 1792–1795 RSC.
- R. O. Prum, R. H. Torres, S. Williamson and J. Dyck, Nature, 1998, 396, 28–29 CrossRef CAS.
- Y. Takeoka, M. Honda, T. Seki, M. Ishii and H. Nakamura, ACS Appl. Mater. Interfaces, 2009, 1, 982–986 CAS.
- M. Harun-Ur-Rashid, A. B. Imran, T. Seki, Y. Takeoka, M. Ishii and H. Nakamura, Trans. Mater. Res. Soc. Jpn., 2009, 34, 333–337 CrossRef.
- S. Magkiriadou, J.-G. Park, Y.-S. Kim and V. N. Manoharan, Opt. Mater. Express, 2012, 2, 1343–1352 CrossRef CAS.
- J.-G. Park, S.-H. Kim, S. Magkiriadou, T. M. Choi, Y.-S. Kim and V. N. Manoharan, Angew. Chem., Int. Ed., 2014, 53, 2899–2903 CrossRef CAS PubMed.
- Y. Zhang, F. Lu, K. G. Yager, D. van der Lelie and O. Gang, Nat. Nanotechnol., 2013, 8, 865–872 CrossRef CAS PubMed.
- C. Zhang, R. J. Macfarlane, K. L. Young, C. H. J. Choi, L. Hao, E. Auyeung, G. Liu, X. Zhou and C. A. Mirkin, Nat. Mater., 2013, 12, 741–746 CrossRef CAS PubMed.
- Y. Wang, Y. Wang, X. Zheng, É. Ducrot, M.-G. Lee, G.-R. Yi, M. Weck and D. J. Pine, J. Am. Chem. Soc., 2015, 137, 10760–10766 CrossRef CAS PubMed.
- J. S. Oh, Y. Wang, D. J. Pine and G.-R. Yi, Chem. Mater., 2015, 27, 8337–8344 CrossRef CAS.
- J. S. Shay, S. R. Raghavan and S. A. Khan, J. Rheol., 2001, 45, 913 CrossRef CAS.
- T. Gillich, C. Acikgöz, L. Isa, A. D. Schlüter, N. D. Spencer and M. Textor, ACS Nano, 2013, 7, 316–329 CrossRef CAS PubMed.
- D. Sun and O. Gang, J. Am. Chem. Soc., 2011, 133, 5252–5254 CrossRef CAS PubMed.
- G. Foffi, C. D. Michele, F. Sciortino and P. Tartaglia, Phys. Rev. Lett., 2005, 94, 078301 CrossRef CAS PubMed.
- P. Levitz and D. Tchoubar, J. Phys. I, 1992, 2, 771–790 CrossRef CAS.
- P. Cloetens, W. Ludwig, J. Baruchel, D. V. Dyck, J. V. Landuyt, J. P. Guigay and M. Schlenker, Appl. Phys. Lett., 1999, 75, 2912–2914 CrossRef CAS.
- R. Mokso, P. Cloetens, E. Maire, W. Ludwig and J.-Y. Buffière, Appl. Phys. Lett., 2007, 90, 144104 CrossRef.
- P. G. de Gennes, Macromolecules, 1980, 13, 1069–1075 CrossRef CAS.
- R. Jin, G. Wu, Z. Li, C. A. Mirkin and G. C. Schatz, J. Am. Chem. Soc., 2003, 125, 1643–1654 CrossRef CAS PubMed.
- M. Zupkauskas, Y. Lan, D. Joshi, Z. Ruff and E. Eiser, Chem. Sci., 2017, 8, 5559–5566 RSC.
- F. Y. Fan, W. H. Woodford, Z. Li, N. Baram, K. C. Smith, A. Helal, G. H. McKinley, W. C. Carter and Y. M. Chiang, Nano Lett., 2014, 14, 2210–2218 CrossRef CAS PubMed.
- S. J. Hurst, A. K. R. Lytton-Jean and C. A. Mirkin, Anal. Chem., 2006, 78, 8313–8318 CrossRef CAS PubMed.
- S. Thyagarajan, N. N. Murthy, A. A. Narducci Sarjeant, K. D. Karlin and S. E. Rokita, J. Am. Chem. Soc., 2006, 128, 7003–7008 CrossRef CAS PubMed.
- M. P. Cervantes-Cervantes, J. V. Calderón-Salinas, A. Albores and J. L. Muñoz-Sánchez, Biol. Trace Elem. Res., 2005, 103, 229–248 CrossRef CAS PubMed.
- Q. Wang, T. R. Chan, R. Hilgraf, V. V. Fokin, K. B. Sharpless and M. G. Finn, J. Am. Chem. Soc., 2003, 125, 3192–3193 CrossRef CAS PubMed.
- A. M'Pandou and B. Siffert, Colloids Surf., 1987, 24, 159–172 CrossRef.
- H. Liu and H. Xiao, Mater. Lett., 2008, 62, 870–873 CrossRef CAS.
- T. Yanagishima, L. Di Michele, J. Kotar and E. Eiser, Soft Matter, 2012, 8, 6792 RSC.
- L. Feng, B. Laderman, S. Sacanna and P. Chaikin, Nat. Mater., 2015, 14, 61–65 CrossRef CAS PubMed.
- L. Cohen-Tannoudji, E. Bertrand, L. Bressy, C. Goubault, J. Baudry, J. Klein, J.-F. Joanny and J. Bibette, Phys. Rev. Lett., 2005, 94, 038301 CrossRef PubMed.
- J. W. Swan, R. N. Zia and J. F. Brady, J. Rheol., 2014, 58, 1–41 CrossRef CAS.
- F. Xie, C. E. Woodward and J. Forsman, J. Phys. Chem. B, 2016, 120, 3969–3977 CrossRef CAS PubMed.
- J. SantaLucia, Proc. Natl. Acad. Sci. U. S. A., 1998, 95, 1460–1465 CrossRef CAS.
- J. C. M. Garnett, Philos. Trans. R. Soc. London, Ser. A, 1904, 203, 385–420 CrossRef CAS.
- C. Song, P. Wang and H. A. Makse, Nature, 2008, 453, 629–632 CrossRef CAS PubMed.
- H. van de Hulst, Light Scattering by small particles, 1981 Search PubMed.
- S. Magkiriadou, J.-G. Park, Y.-S. Kim and V. N. Manoharan, Phys. Rev. E: Stat., Nonlinear, Soft Matter Phys., 2014, 90, 062302 CrossRef PubMed.
- A. J. Parnell, A. L. Washington, O. O. Mykhaylyk, C. J. Hill, A. Bianco, S. L. Burg, A. J. C. Dennison, M. Snape, A. J. Cadby, A. Smith, S. Prevost, D. M. Whittaker, R. A. L. Jones, J. P. A. Fairclough and A. R. Parker, Sci. Rep., 2015, 5, 18317 CrossRef CAS PubMed.
Footnote |
| † Electronic supplementary information (ESI) available. See DOI: 10.1039/c7cp04835a |
| This journal is © the Owner Societies 2018 |