Influences of polarity and hydration cycles on imbibition hysteresis in silica nanochannels†
Shaina
Kelly
*ab,
Carlos
Torres-Verdín
 *a and
Matthew T.
Balhoff
a
aDepartment of Petroleum and Geosystems Engineering, The University of Texas at Austin, Austin, TX 78712, USA. E-mail: shaina.a.kelly@utexas.edu; cverdin@mail.utexas.edu
bContribution from the Center for Nano- and Molecular Science, The University of Texas at Austin, 102 E. 24th St., Austin, TX 78712, USA
First published on 14th November 2017
Abstract
Spontaneous liquid imbibition is a dominant mechanism for moving fluids in confinements with extremely high hydrodynamic resistance; i.e. nanopores. We demonstrate the impact of hydrophilicity and liquid polarity on nanoscale imbibition with dynamic measurements of the uptake of water–isopropanol (polar) and heptane (nonpolar) within 2D glass–silica nanochannels exposed to varied drying conditions and rehydration (rehydroxylation) cycles. The Lucas–Washburn equation, which does not consider interfacial fluidity effects, predicts that water–IPA and heptane should imbibe at similar speeds. However, we observed stymied and hysteretic water–IPA imbibition trends explained by extremely large contact line friction and increased effective viscosity, both surface chemistry-dependent, whereupon the results match a modified version of the Lucas–Washburn equation that accounts for dynamic wetting. In contrast, heptane imbibition, though still slower than the Lucas–Washburn equation prediction, was fairly insensitive to drying history and an order of magnitude faster than the polar mixture. The imbibition of aqueous solutions in analogous siliceous nanoporous materials and structures, ubiquitous in earth science and nanotechnology, may also be subject to hysteretic and large energy dissipation at contact lines and interfaces on account of hydrophilicity.
Introduction
Silica or silicon dioxide is (SiO2) one of the most abundant materials on Earth found naturally in its geologic crust (sedimentary rocks), sands, and plants and produced synthetically for the construction, glassware, microelectronics/lab-on-a-chip, food, and pharmaceutical industries. Consequently, the spontaneous uptake of liquid into silica capillaries/channels or porous silica is ubiquitous. This spontaneous liquid uptake, or imbibition, is a principal mechanism for liquid migration in confinements with extremely high hydrodynamic resistance, namely nanoscale pores and channels. Fluid transport in siliceous nanoporous materials is of engineering significance for energy, filtration, catalysis, and drug delivery applications;1 in particular, tight subsurface rocks2,3 controlled pore glass4–6 mesoporous silica7 and membranes,8 and miniaturized fluidic devices.9Liquids classically imbibe into microscale capillaries and porous media at a front length proportional to the square root of time, as first reported by Bell and Cameron in 1906.10 Lucas (1918)11 and Washburn (1921)12 found that the imbibition length is also dependent on surface tension, the liquid–solid contact angle, the capillary diameter, and liquid viscosity. However, in nanoscale capillaries heightened sensitivity to surface texture, confinement geometry (corners), and surface chemistry may generate a departure from Lucas–Washburn uptake speeds and dynamics;‡![[thin space (1/6-em)]](https://www.rsc.org/images/entities/char_2009.gif) 13,14 silica surfaces are negatively charged and particularly reactive and history-dependent.15,16 Furthermore, laboratory imbibition experiments are typically performed on unused materials and channels for the purpose of comparing data to analytical solutions (e.g. the Lucas–Washburn equation), but realistically most practical nanoporous materials are subjected to repeated use and/or cycles of fluid and temperature exposures, especially geologic materials. Silica and glass surface modifications in the presence of polar liquids include chemi- and physiadsorption, softening and molecule diffusion zones, and the inclusion of particulate adsorbates (fouling). Water adsorption in glass can generate ion-exchange with leachable surface ions leading to hydrolysis of the silica network and, as a result, surface corrosion.17 The surface conditions of glasses/silicas are thereby strongly history dependent.
13,14 silica surfaces are negatively charged and particularly reactive and history-dependent.15,16 Furthermore, laboratory imbibition experiments are typically performed on unused materials and channels for the purpose of comparing data to analytical solutions (e.g. the Lucas–Washburn equation), but realistically most practical nanoporous materials are subjected to repeated use and/or cycles of fluid and temperature exposures, especially geologic materials. Silica and glass surface modifications in the presence of polar liquids include chemi- and physiadsorption, softening and molecule diffusion zones, and the inclusion of particulate adsorbates (fouling). Water adsorption in glass can generate ion-exchange with leachable surface ions leading to hydrolysis of the silica network and, as a result, surface corrosion.17 The surface conditions of glasses/silicas are thereby strongly history dependent.
With regard to physiadsorption, adsorbed water film thicknesses at charged solid surfaces are reported on the order of several Angstroms to tens of nanometers18 and as a function of solid–liquid intermolecular forces.19 These films or hydration layers are hypothesized to exhibit long-range order/molecular structuring,20 increased viscosity18,21 and stability at temperatures and pressures outside of the liquid region of their corresponding bulk substance phase diagrams.22 When such films exist in the presence of bulk capillary water they are referred to as vicinal or boundary zones and have been reported as thick as 200 nm.23 Mixtures form boundary zones as well: binary adsorbate layered structures of water and n-propanol (an isomer of isopropanol) on silica studied at room temperature with attenuated total reflectance infrared spectroscopy (ATR-IR) and sum frequency generation (SFG) vibration spectroscopy have been measured to be as thick as 6.5 nm when the fraction of water was greater than 0.4.24,25 Despite decades of research into the existence and stability of these adsorbed films, there remains much controversy26 about their actual structure and their interaction with bulk fluid phases (as well as the electrical double layer in the case of aqueous solutions). The effect of the combined properties associated with vicinal and bulk capillary liquid on nanoconfined liquid transport remains a subject of research.
With regard to chemiadsorption, the concentrations of siloxanes (Si–O–Si) and silanols (Si–O–H) on a silica surface will determine the tendency of water molecules to bond to the surface and, as a result, directly influences hydrophilicity; surfaces with abundant siloxane groups are prone to be hydrophobic, while hydroxylation of these groups into silanol groups will render a surface hydrophilic. Furthermore, extended hydroxylation can lead to gel-like networks of protruding silanol and silicic acid “hairs”,16 increasing the hydrophilic surface area. For most glasses, dehydration of physically adsorbed water occurs between 150–200 °C and dehydroxylation (removal of silanols) occurs at ∼200 °C and greater.27 Dehydrated/dehydroxylated silica will be rehydrated upon dosing with water, though the literature suggests that complete rehydroxylation does not occur for surfaces with thermal histories above ∼400 °C.27,28 The rehydroxylation of a dehydroxylated silica surface follows first-order kinetics where the natural log of the concentration of silanols varies linearly with time.28 Longer thermal treatment times correspond to increased siloxane formation and slower rates of siloxane relaxation and silanol formation. As per statistical physics, we postulate that the distribution of chemi- and physiadsorption sites will show increased variation as nanoscale sampling window size decreases, such as the meniscus contact line of a two-dimensional (2D) nanochannel (submicron in both depth and width) as compared to a microchannel or a one-dimensional (1D) nanochannel (planar channel/aperture that is nanoscale only in depth).
Imbibition of water and other liquids is found to follow square root of time dynamics in 1D nanochannels29–33 though filling speeds are much slower than predicted and explanations for reduced uptake efficiency vary greatly. Some water imbibition studies in 1D silica nanochannels have observed a slight departure from square root of time dynamics and suggested the introduction of a loss term to account for evaporation, corner, or film flow.30 Water imbibition in mesoporous silica with pores <50 nm in diameter34 and water–ethanol mixture imbibition in sintered polystyrene nanoporous networks of various sizes35 have demonstrated non-square root of time dynamics. Deviation from square root of time to linear imbibition in nanoporous networks has also been reported for varying mixtures of ethanol–water.35 There has been far less experimental work on imbibition in 2D silica nanochannels where contact or wetting lines are much smaller than 1D nanochannels, or on imbibition hysteresis in such nanochannels. A study comparing water imbibition in various sizes of 1D and 2D nanochannels has shown that a significant increase in apparent viscosity was only seen in the 2D nanochannels and theorized this to be on account of an increased influence of hydration layers.36 The lab on a chip 2D nanochannels used in this work represent a pore size distribution of isolated nanoconfinements on the order of tens of nanometers in cross-sectional dimensions, as opposed to the sub 50 nm interconnected confinements investigated in the majority of hydrodynamics studies on mesoporous materials. The results of our previous 2D nanofluidics work13 displayed that liquid uptake in 2D glass-silica nanochannels can deviate from both Lucas–Washburn speeds and dynamics. Herein, we study the uptake dynamics of water–isopropanol (IPA) and heptane in 2D silica nanochannels with repeated liquid exposures (hydration cycles) and change the drying conditions between each experiment to probe hydration/hydroxylation effects. This manuscript advances the previous work13 with comparisons of the sensitivity of nonpolar and polar liquid imbibition to surface chemistry in 2D silica nanoconfinements and offers an explanation for non-Lucas–Washburn dynamics.
Methods
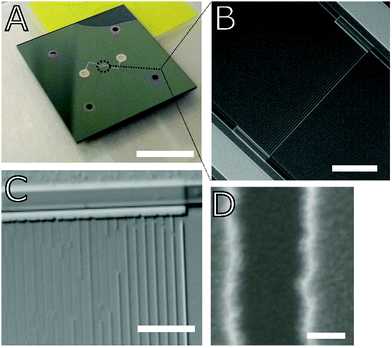
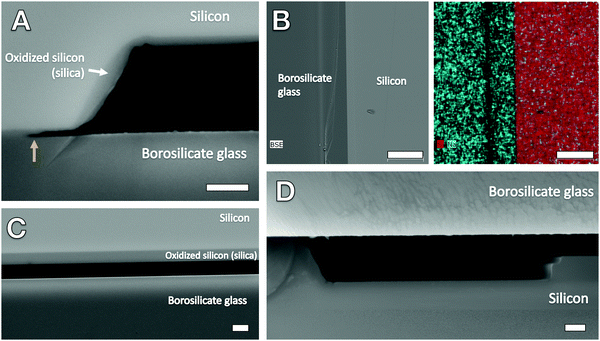
The lab-on-a-chip nanofluidic devices used in the experiments were composed of oxidized silicon (silica) bonded to 200 μm thick Pyrex glass and featured an array of 20 different-sized trapezoidal§ channels ranging in width from 30–500 nm and all 60 nm in depth and 250 μm in length; there were multiples of several of the nanochannel widths, including those 50 nm, 100 nm, and 200 nm in width. The nanochannels were fabricated using electron beam lithography and reactive ion etching, and the channels were hermetically sealed with anodic bonding; Fig. 2B shows a cross-sectional SEM view of the hermetic glass–silica bond. Two low aspect ratio microchannels, each with a respective inlet and outlet and 1 μm in depth, were situated on opposing sides of the nanochannel array to serve as fluid conduits (liquids were administered at inlets with a pipette) and reservoirs as well as in situ filters. The surface roughness generated from the reactive ion etching (RIE) process was measured in the microchannel portions of the chip using a Dektak 6M stylus profilometer; the RIE-induced roughness was found to be on the order of 1–3 nm, which is confirmed by the smoothness seen in the cross-sectional SEM views of the microchannel inlet and nanochannels (Fig. 2 and 1D, respectively). Fig. 1B and C displays reflected differential interference contrast (DIC) microscopy images of the nanochannel array. Additional details on fabrication and chip fluidic geometry are found in our previous publications that featured nanofluidic chips from the same fabrication batch.13,14We attempted to vary nanochannel surface chemistry by following complete liquid filling of the nanochannel arrays with isothermal drying for different periods of time in a vacuum oven (Isotemp Model 281A, Fisher Scientific) capable of reaching a maximum temperature of 280 °C. Drying temperatures of 150 °C, 190 °C, and 270–280 °C were tested to probe the dehydration threshold of physically adsorbed water (150–200 °C) and the dehydroxylation (removal of hydroxyl/silanol groups) threshold (>200 °C).27 Temperature (T), pressure (P), and drying time, Δtdry, were varied as listed in Tables SM1 and SM2 of the ESI† and the legends of Fig. 4 and 5. The wetted chips were placed in the vacuum oven within minutes of each imbibition experiment such that rehydration/rehydroxylation times were roughly consistent. Several experiments were also performed following room temperature and pressure drying conditions. For comparison, critical point drying (CPD), performed using a Tousimis Samdri 790, was also used as a drying mode before one of the imbibition experiments; in the CPD process, a chip was saturated with absolute ethanol then flushed with liquid CO2 and brought to the CO2 critical region of T > 40 °C and P > 8273 kPa.
A polar aqueous mixture of deionized (DI) water (Milli-Q, 18 MegaOhm)¶ and IPA (Fisher Scientific) in a mixture fraction of ywater = 0.60 (yIPA = 0.40) by volume and nonpolar heptane (Fisher Scientific) were used as imbibition fluids. DI water was mixed with IPA, a wetting agent, because water alone was plagued by contact-line pinning in the narrow microchannel entrances of the nanofluidic chips. The non-wetting fluid in all experiments was ambient air. Two previously unwetted nanofluidic chips were devoted for testing of water–IPA and heptane, respectively, labeled Chip A and Chip B. For calibration purposes, a heptane test was performed as one of the last experiments in Chip A, and a likewise experiment was run for water–IPA in Chip B. When not in use, the chips were stored in Gel-Pak holders or petri dishes within a Desi-Vac (Cole-Parmer) vacuum container with silica desiccant beads. To avoid fouling, the chips were only removed from their containers in a class 100 cleanroom environment. The “dry” state of the channels was imaged and logged before each imbibition experiment to determine if any trapped plugs were present; such plugs were only observed after room temperature and pressure drying. The results presented in this manuscript are from a total of 24 imbibition experiments (16 polar, 8 nonpolar).
Another variable to consider is the number of uses or imbibition cycles for each chip. Within the scope of this work, this variable is coupled with the variation of temperature and drying time. Drying times were not systematically varied, but are discrete and variegated, due to experimental logistics. Drying temperatures increased with hydration cycles. A subsequent experimental study should vary all of these parameters independently or focus solely on hydration cycles (this was not the prime focus of our experimental design, but became an emergent variable upon data analysis). Thus, relationships between the uptake time and hydration cycles (displayed in Fig. 5) are not straightforward or indicate a relative insensitivity to the ranges of T and Δtdry tested.
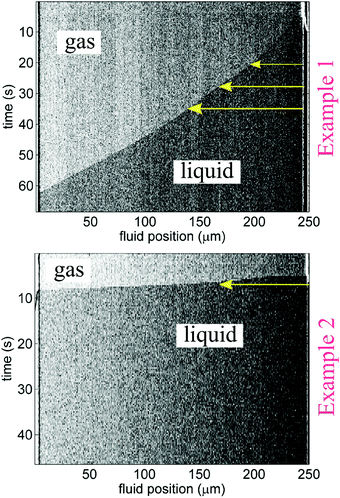
Imbibition was captured using a Zeiss Axioskop 2MAT microscope in reflected differential interference contrast (DIC) mode and a Zeiss AxioCam MRc 5 CCD camera. Length-versus-time imbibition profiles were extracted by analyzing changes in individual rows of channel-associated pixels with time (as shown in Fig. 3) by way of image analysis scripts (Matlab).13Fig. 1C displays that liquid plugs or fully wetted regions are detectable with DIC; adsorbed films and any corner flow appeared to be below detection limits. Visibility of imbibition fronts in the smaller nanochannels (recall, the smallest cross-section studied was 30 nm × 60 nm) varied among experiments; only clearly discernible dynamic front profiles, such as the ones shown in Fig. 3, were used for the plotted data in Fig. 4 and 5. The maximum frame rate (exposure-dependent) of the AxioCam MRc 5 that allowed sufficient exposure for nanochannel visualization was limited to approximately 3 frames per second (fps).|| Thus, for some of the imbibing fronts the CCD camera frame rate did not render enough data points to establish the curvature of the imbibition profile; as a result, Fig. 5 plots the imbibition results in terms of total time to traverse a nanochannel.
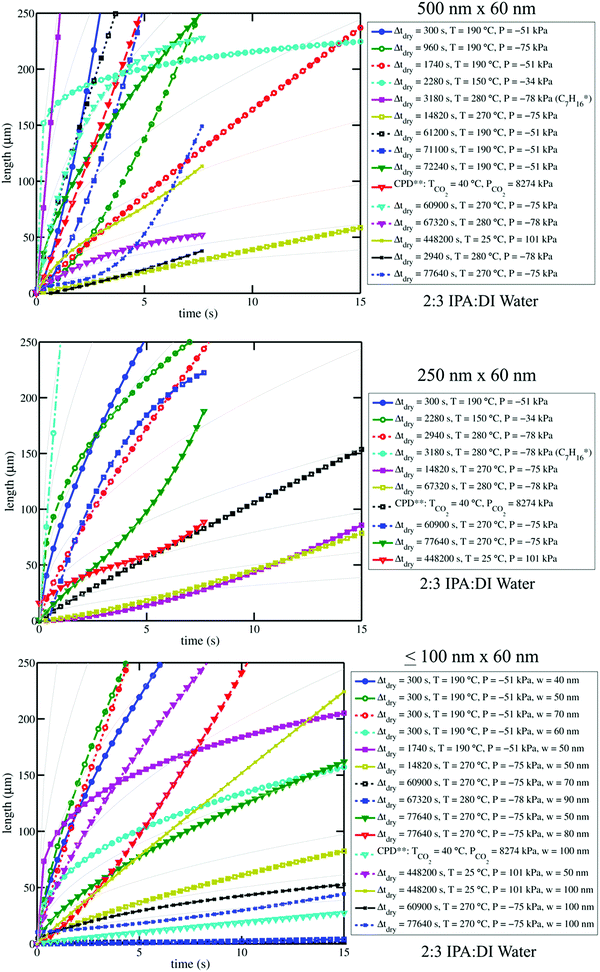 | ||
| Fig. 4 Plots of curves from water–IPA imbibition profiles (see Fig. 3) are shown for select channel sizes. Plot legends indicate the drying conditions associated with each curve. Pale solid background curves in the three plots indicate n = 0.5 power-law trends for arbitrary α-values in l(t) = αtn, which can be referenced to clarify the goodness (or poorness) of fit of the data to Lucas–Washburn dynamics. Log–log versions of these plots are available in the ESI;† differences in n-values are accentuated by log–log plots where the slope of the trends is equal to n. The variation among the imbibition curves makes it clear that water–IPA uptake is highly sensitive to treatment history. Legend notes: *Experiment performed with heptane in Chip A, for comparison. **Experiment performed after critical point drying. Vacuum pressures are given as negative gauge pressures where the zero reference is atmospheric pressure (101 kPa). The positive pressure values are absolute pressures. | ||
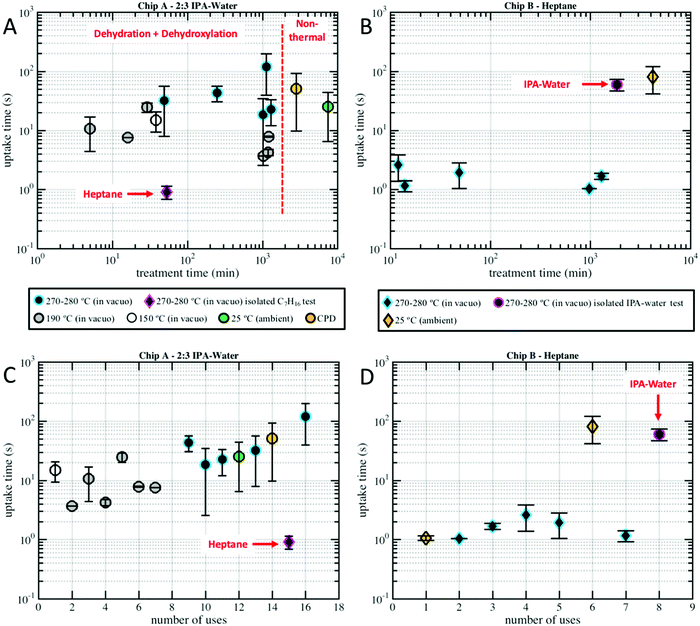 | ||
| Fig. 5 Uptake time, the amount of time it takes to fill the 250 μm long nanochannels is plotted versus (A) Chip A drying time, (B) Chip B drying time, (C) Chip A number of uses/imbibition cycles, and (D) Chip B number of uses/imbibition cycles for the varied drying temperatures indicated in the legend. Plot markers represent data means and error bars represent standard errors. Plot markers are colored by their drying conditions, typically vacuum oven, and are not grouped by nanochannel size (as shown in Fig. SM1 of the ESI† there was not a clear relationship between nanochannel width and uptake). Circular markers represent water–IPA, while diamond-shaped markers represent heptane. Note that in a few of the nanochannels heptane imbibed in less than one frame (0.3 s) and, thus, could not be measured and included in the dataset. | ||
Results and discussion
The governing equation for imbibition in a horizontal capillary tube is a nonlinear ordinary differential equation (ODE) derived from a conservation of momentum force balance and the Poiseuille relationship between the pressure gradient and velocity:37 | (1) |
 | (2a) |
 | (2b) |
 | (3) |
| Liquid | σ (mN m−1) | μ (mPa s) | θ (°) |
|---|---|---|---|
| Heptane | 20.14 | 0.38 | 0 |
| Water | 72.80 | 0.89 | ∼30 |
| Isopropanol | 22.30 | 1.96 | 0 |
On the microscale, non-Lucas–Washburn dynamics are theoretically and experimentally shown to be a product of axial variations along a channel with power-law exponents uniquely dependent on the specific geometry;39 for example, a transition from t0.5 (early times) to slower t0.25 (late times) dynamics is found with imbibition in sufficiently long conical channels around an axial distance equal to the opening radius divided by half of the cone opening angle.39 Within the 250 μm long nanochannels, a gradual change in the effective cross-sectional area for bulk flow along the length of the channel or a change in the properties at the meniscus contact line (and as a result, the dynamic contact angle and capillary pressure) will generate non-constant coefficient(s) (nonlinearity) in eqn (1), whereby eqn (2) becomes unsuitable.
From image stack data, detectible length-versus-time profiles of imbibing fronts were fit to a power law form: l(t) = αtn; n = 0.5 is Lucas–Washburn dynamics. Fig. 4 displays water–IPA imbibition curves in Chip A for different nanochannel sizes and pre-imbibition drying conditions (listed in the legend). The greatest number of data sets was collected in the 500 nm × 60 nm and 250 nm × 60 nm channels, which had the largest surface area and, thus, were the easiest to consistently visualize with DIC. Detectable imbibition profiles obtained for channels less than 100 nm wide are combined in one plot. Similar imbibition plots for other channel widths as well as log–log plots are included in the ESI.† The top two plots of Fig. 4 include data from the lone heptane imbibition experiment performed in Chip A for calibration purposes. The majority of the water–IPA data confirmed n-values near 1, or near-linear imbibition dynamics. Some of the data show n < 0.5 dynamics and in a few cases the imbibition curves are piecewise trends (amalgamated curves of different early- and late-time trends). Trends of n < 0.5 indicate a physical parameter, conventionally anticipated to be of constant value, which decreases the driving force or increases net resistance to imbibition with time. Trends of n > 0.5 indicate the converse.
Fig. 5 compares the imbibition data through the uptake time, the amount of time it took to fill the 250 μm long nanochannels. As has been established in our previous work,13 both heptane and water–IPA imbibed into the 250 μm long channels on the order of seconds, far slower than the corresponding Lucas–Washburn equation prediction, which forecasts filling on the order of milliseconds. Water–IPA exhibits notably varied uptake times, while heptane uptake times are at least one order of magnitude faster and fairly consistent (with the exception of the data that corresponds with ambient drying where heptane films likely remained in the nanochannels). Likewise, the heptane uptake error bars, which represent standard error of the data, are generally tighter than the water–IPA error bars. Water–IPA uptake times do not show a clear response to discrete changes in drying time and temperature, but do increase on average with hydration cycles. Again, the heptane imbibition experiments performed in Chip B are only displayed in terms of the total time for liquid to fill a nanochannel (Fig. 5) because CCD camera frame rate limitations did not consistently allow enough data points to accurately establish the curvature of heptane imbibition profiles. Thus, the adherence of heptane to Lucas–Washburn dynamics was not assessed with the experimental setup, though extracted heptane imbibition curves such as those seen in Fig. 4 also suggest linear dynamics.
Additionally, the divergence in water–IPA uptake data did not show a relationship with the 2D nanochannel width, as plotted in Fig. SM1 in the ESI.† Critical point drying did not increase the nanochannels’ capacity for uptake of polar liquids. When the nanochannels were dried under ambient conditions the uptake results especially varied between individual nanochannels (as indicated by the large error bars on these data markers in Fig. 5). It is presumed that for those experiments drying was incomplete and thin films were still present in some of these nanochannels.
The uptake calibration tests revealed that the mechanism that causes varied imbibition is liquid-dependent, not chip-dependent, and that heptane is insensitive to any surface modifications caused by water–IPA in the silica-glass nanochannels. Heptane imbibed into pre-wetted Chip A at approximately the same uptake time it imbibed into Chip B. Chip A had already been used for 14 water–IPA experiments before heptane was introduced (see Fig. 5C). Similarly, water–IPA imbibed into pre-wetted Chip B within the range of imbibition times for water–IPA in Chip A. Chip B had already been used for 7 heptane experiments before water–IPA was introduced (see Fig. 5D). Note that the last water–IPA experiment in Chip A after exposure to heptane exhibited particularly slow uptake times.
The calibration runs and variations in consecutive water–IPA trends establish that non-constant nanochannel cross-sectional geometries by fabrication, fouling, or residual films are unlikely, and that the anomalous imbibition data are due to a phenomenon that occurs during the imbibition process. For polar liquids, the phenomenon is history dependent (is subject to hysteresis), as it changes from experiment to experiment. This phenomenon is also time and/or spatially dependent, as it generates a non-square root of time dynamics. The non-Lucas–Washburn dynamics can potentially be accounted for by adding a loss term to the right side of eqn (2a).30 Front evaporation and corner flow40 can generate such a loss term. Both heptane and water–IPA are susceptible to corner flow and front evaporation; however, heptane has a higher vapor pressure than both IPA and water and is expected to evaporate faster which contradicts the data. Furthermore, front evaporation should be roughly constant in all of the water–IPA experiments, while other applicable phenomena such as corner flow and dynamic contact angles are functions of surface chemistry (wetting) conditions.
The results are best explained by contact line friction, as described by the molecular kinetic theory of wetting for dynamic contact angles37,41,42 where θ changes as a function of front velocity, dl/dt. The theory stipulates that high energy dissipation at the contact line formed by a meniscus generates a non-hydrodynamic resistance with units of Pa s like hydrodynamic viscosity. This macroscopic friction is dependent on the distribution (statistics) of individual molecular displacements that occur at the meniscus–solid interface. The greater the affinity of a fluid to a substrate (i.e. the greater the number of potential adsorption sites), the more energy is required for displacements, and the greater the contact line friction. Martic et al. derived a modified form of the Lucas–Washburn equation from eqn (1) that accounts for dynamic wetting:37
 | (4a) |
 | (4b) |
 | (4c) |
 | (4d) |
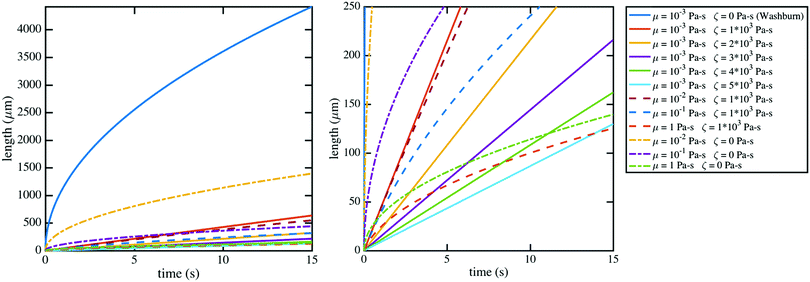 | ||
| Fig. 6 The modified Lucas–Washburn equation derived by Martic et al.37 is plotted for various values of contact line friction and effective viscosity which demonstrate that the resulting curves resemble the imbibition data (Fig. 4); the right plot bounds the theoretical curves by the length of the nanochannels, 250 μm, for comparison with Fig. 4. A 60 nm × 60 nm nanochannel is used in the calculations. The classical Lucas–Washburn prediction is the solid dark blue curve, markedly higher than the range of the data. | ||
Contact line friction is independent of the confinement size as per eqn (4d), but this description of ζ may break down in nanoconfinements; i.e., ζ may be particularly strong in the 2D silica nanochannels versus nano-slits and macroscopic droplet experiments because enclosed molecules are statistically more likely to interact with adsorption sites in confinements with increased surface area to volume ratios. In particular, intense energy dissipation may occur at nanochannel corners and these corner regions are a larger fraction of the overall wetting line in 2D nanochannels as opposed to 1D nanochannels. Finally, the cross-sectional areas and perimeters of some 2D nanochannels may be small enough that fluctuations of local per-area properties, constant in larger systems, can arise due to nonequilibrium statistical physics.43
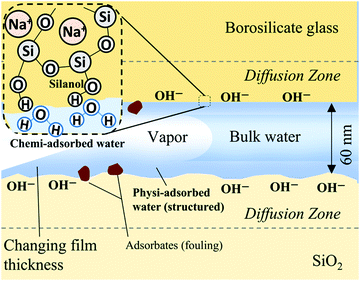
The results indicate that imbibition of both polar and nonpolar liquids in 2D silica nanochannels is subject to increased resistance, a combination of contact line friction and enhanced effective viscosity. In particular, the water–IPA data indicate that the surfaces of the 2D silica nanochannels undergo structural and chemical changes during interactions with water–IPA and that these changes, depicted in Fig. 7, increase contact line friction; i.e., changes include the time-dependent density of silanols, siloxanes, and rehydration kinetics.16 Recall, water–IPA uptake times roughly trend with the number of hydration cycles (see Fig. 5C), while uptake times stay fairly constant with imbibition cycles in the heptane tests (see Fig. 5D). Thus, silanol density and, correspondingly, the number of local adsorption sites likely increased with repeated imbibition cycles. Contrary to our initial hypothesis, within the scope of our experiments, silica surface chemistry was relatively insensitive to varied chip drying conditions in comparison to the number of hydration cycles.
The findings complement other studies on interfacial fluidity and the impact of hydrophilicity and/or polarity on the hydrodynamic “no slip” boundary condition. Experiments with bulk materials (Vycor glass)44–46 and molecular dynamics simulations47 have suggested strongly bound (immobile or highly viscous) layers of water molecules at silica walls and other hydrophilic surfaces44,48 and the need for a “negative slip length” to account for these immobile layers.49 Meniscus “freezing” in sub 10 nm diameter glass pores (Vycor) was also indirectly observed and attributed to a decrease in surface entropy at advancing menisci,46 and increases in the viscosity of nanoconfined water, as compared to bulk water, by several orders of magnitude have also been reported.48 In the case of hydrophobic or nonpolar interactions experiments with bulk materials (Vycor glass)45 and atomic force microscopy (AFM)48 as well as molecular dynamics simulations47,50 suggest the absence of immobile boundary layers and that a slip length is necessary to account for enhanced fluidity. This work in long 2D nanochannels evidences that differences in interfacial fluidity can still substantially impact hydrodynamics in relatively larger nanoconfinements, tens of nanometers wide as opposed to the sub 10 nm confinements studied in the majority of the aforementioned work. In addition, the results suggest that the discussed polarity-dependent imbibition resistance is hysteretic and can result in a non-square root of time behavior within the nanochannel lengths investigated.
Interestingly, numerous studies on liquid transport in carbon nanotubes have shown the converse of the imbibition resistance findings presented herein: carbon nanotube flow rates are orders of magnitude faster than predicted by Poiseuille flow and the Lucas–Washburn equation51–55 indicating near-frictionless transport at the carbon–liquid surface. This contrast further illuminates that solid–liquid interactions govern liquid flow in fully nanoscale confinements.
Conclusions
The experiments show that imbibition of both polar (water–IPA) and nonpolar (heptane) liquids in 2D silica nanochannels is subject to increased resistance as compared to the Lucas–Washburn equation; this resistance appears to be highly dependent on liquid polarity, whereby the conventional Lucas–Washburn equation is unsuitable. As per the Lucas–Washburn equation, heptane is predicted to imbibe faster than water–IPA by only a factor of ∼1.35. Water–IPA uptake resistance is found to increase with hydration cycles, corresponding to an increase in surface adsorption sites, and follow dynamic wetting physics. Meanwhile, heptane, relatively insensitive to adsorption sites, is found to imbibe consistently and at least one order of magnitude faster than polar water–IPA within the nanochannels. A modified form of the Lucas–Washburn equation which accounts for molecular kinetic theory of wetting matched the nonclassical imbibition data trends when values of contact line friction are as high as the order of 103 Pa-s, assuming bulk viscosity values; however, increased contact line friction is likely coupled with increased effective viscosity. The implications of the findings pertain to the role of hydrophilicity in nanoscale imbibition: conventionally, dehydroxylation is expected to decrease the wettability and uptake rate, but if hydroxylation increases contact line friction and effective viscosity in very small channels then, paradoxically, it too can decrease the uptake rate for polar fluids.The polar liquid imbibition trends and hysteresis imply that scientists should question the predictive capability of conventional imbibition models for aqueous fluid imbibition in natural and synthetic silica and oxide nanoscale systems that are approximate analogues of the nanochannels. Such environments include production and sequestration of fluids in hydraulically fractured subsurface nanoporous rocks, the functionality of nanoelectromechanical systems (NEMS) and biosensor devices, and fluid uptake and solute transport in mesoporous silica and nano-filtration membranes. In particular, relating thermal history and hydration cycles to the water uptake potential of nanoporous rocks through hydration/hydroxylation kinetics is particularly useful for the geosciences as a way to relate the burial histories of tight silica- and clay-rich formations to their imbibition potential.‡‡
Subsequent work toward updating imbibition analytical solutions should focus on understanding the nature of the observed increases in contact line friction and effective viscosity, such as quantifying the amount of physically adsorbed water and concentration of hydroxyl groups (perhaps with ionic conductance measurements), both functions of thermal and dehydration–hydration history. We also suggest investigations with controlled variations in nanochannel or nanopore surface roughness, pH, and ion concentration/EDL length in future works. Finally, fundamental studies using X-ray absorption spectroscopy techniques and molecular dynamics simulations are required to describe the coupling between molecular-scale surface reactions, the molecular structure of boundary layers, and nanoscale fluid dynamics as a function of nanopore and aqueous fluid properties.
Conflicts of interest
There are no conflicts to declare.Acknowledgements
This research was partially supported by the donors of the American Chemical Society Petroleum Research Fund (Grant #: 52817-ND9) and the Statoil Fellows Program at The University of Texas at Austin. This work is also supported by the University of Texas at Austin's Formation Evaluation Research Consortium, jointly sponsored by Anadarko, Aramco, Baker-Hughes, BG, BHP Billiton, BP, Chevron, COSL, ConocoPhillips, DEA Deutsche Erdoel AG, Det Norske, ENI, ExxonMobil, Halliburton, Hess, Maersk Oil, Paradigm, Petrobras, PTTEP, Repsol, Southwest Energy, Schlumberger, Shell, Statoil, Total, Weatherford, Wintershall and Woodside Petroleuem Limited. A note of special gratitude goes to NIL Technology for assistance with chip fabrication, the Welch Foundation for support of the facilities utilized in this work, Patrick Smith for assistance with SEM imaging, and Rafael Longoria and George Shubeita for introducing the authors to DIC microscopy. Carlos Torres-Verdín is grateful for the financial support provided by the Brian James Jennings Memorial Endowed Chair in Petroleum and Geosystems Engineering.References
- G. Q. Lu and X. S. Zhao, Nanoporous Materials: Science and Engineering, World Scientific, 2004 Search PubMed.
- N. Chakraborty, Z. T. Karpyn, S. Liu and H. Yoon, Permeability evolution of shale during spontaneous imbibition, J. Nat. Gas Sci. Eng., 2017, 38, 590–596 CrossRef.
- H. Roshan, M. S. Andersen, H. Rutlidge, C. E. Marjo and R. I. Acworth, Investigation of the kinetics of water uptake into partially saturated shales, Water Resour. Res., 2016, 52, 2420–2438 CrossRef.
- A. Vyalikh, T. Emmler, E. Gedat, I. Shenderovich, G. H. Findenegg, H.-H. Limbach and G. Buntkowsky, Evidence of microphase separation in controlled pore glasses, Solid State Nucl. Magn. Reson., 2005, 28, 117–124 CrossRef CAS PubMed.
- W. Limbut, P. Thavarungkul, P. Kanatharana, P. Asawatreratanakul, C. Limsakul and B. Wongkittisuksa, Comparative study of controlled pore glass, silica gel and Poraver® for the immobilization of urease to determine urea in a flow injection conductimetric biosensor system, Biosens. Bioelectron., 2004, 19, 813–821 CrossRef CAS PubMed.
- A. Grajkowski, J. Cieślak, J. S. Kauffman, R. J. Duff, S. Norris, D. I. Freedberg and S. L. Beaucage, Thermolytic Release of Covalently Linked DNA Oligonucleotides and Their Conjugates from Controlled-Pore Glass at Near Neutral pH, Bioconjugate Chem., 2008, 19, 1696–1706 CrossRef CAS PubMed.
- S. Gruener, H. E. Hermes, B. Schillinger, S. U. Egelhaaf and P. Huber, Capillary rise dynamics of liquid hydrocarbons in mesoporous silica as explored by gravimetry, optical and neutron imaging: Nano-rheology and determination of pore size distributions from the shape of imbibition fronts, Colloids Surf., A, 2016, 496, 13–27 CrossRef CAS.
- R. Urteaga, L. N. Acquaroli, R. R. Koropecki, A. Santos, M. Alba, J. Pallarès, L. F. Marsal and C. L. A. Berli, Optofluidic Characterization of Nanoporous Membranes, Langmuir, 2013, 29, 2784–2789 CrossRef CAS PubMed.
- M. Napoli, J. C. T. Eijkel and S. Pennathur, Nanofluidic technology for biomolecule applications: a critical review, Lab Chip, 2010, 10, 957–985 RSC.
- J. M. Bell and F. K. Cameron, The Flow of Liquids through Capillary Spaces, J. Phys. Chem., 1905, 10, 658–674 CrossRef.
- R. Lucas, Ueber das Zeitgesetz des kapillaren Aufstiegs von Flüssigkeiten, Kolloid-Z., 1918, 23, 15–22 CrossRef CAS.
- E. W. Washburn, The Dynamics of Capillary Flow, Phys. Rev., 1921, 17, 273–283 CrossRef.
- S. Kelly, M. T. Balhoff and C. Torres-Verdín, Quantification of Bulk Solution Limits for Liquid and Interfacial Transport in Nanoconfinements, Langmuir, 2015, 31, 2167–2179 CrossRef CAS PubMed.
- S. Kelly, C. Torres-Verdín and M. T. Balhoff, Anomalous liquid imbibition at the nanoscale: the critical role of interfacial deformations, Nanoscale, 2016, 8, 2751–2767 RSC.
- J.-P. Chapel, History-Dependent Hydration Forces Measured between Silica Surfaces, J. Colloid Interface Sci., 1994, 162, 517–519 CrossRef CAS.
- G. Vigil, Z. Xu, S. Steinberg and J. Israelachvili, Interactions of Silica Surfaces, J. Colloid Interface Sci., 1994, 165, 367–385 CrossRef CAS.
- R. A. Schaut and C. G. Pantano, Acid Interleave Coatings Inhibit Float-Glass Weathering, Corrosion, Am. Ceram. Soc. Bull., 2005, 44–49 CAS.
- F. M. Etzler and D. M. Fagundus, The extent of vicinal water: Implications from the density of water in silica pores, J. Colloid Interface Sci., 1987, 115, 513–519 CrossRef CAS.
- B. V. Derjaguin, N. V. Churaev and V. M. Muller, Surface Forces, Springer US, 1987, pp. 53–83 Search PubMed.
- W. Drost-Hansen, Strutcture of water near solid interfaces, Ind. Eng. Chem., 1969, 61, 10–47 CrossRef CAS.
- W. Drost-Hansen, Temperature effects on cell-functioning – a critical role for vicinal water, Cell. Mol. Biol. Noisy-Gd. Fr., 2001, 47, 865–883 CAS.
- P. S. Pershan and M. Schlossman, Liquid Surfaces and Interfaces: Synchrotron X-ray Methods, Cambridge University Press, 2012 Search PubMed.
- J. A. Schufle, C.-T. Huang and W. Drost-Hansen, Temperature dependence of surface conductance and a model of vicinal (interfacial) water, J. Colloid Interface Sci., 1976, 54, 184–202 CrossRef CAS.
- A. L. Barnette and S. H. Kim, Coadsorption of n-Propanol and Water on SiO2: Study of Thickness, Composition, and Structure of Binary Adsorbate Layer Using Attenuated Total Reflection Infrared (ATR-IR) and Sum Frequency Generation (SFG) Vibration Spectroscopy, J. Phys. Chem. C, 2012, 116, 9909–9916 CAS.
- A. L. Barnette and S. H. Kim, Attenuated Total Reflectance Infrared Spectroscopy Study of Hysteresis of Water and n-Alcohol Coadsorption on Silicon Oxide, Langmuir, 2012, 28, 15529–15536 CrossRef CAS PubMed.
- J. Clifford, in Waterin Disperse Systems, ed. F. Franks, Springer US, 1975, pp. 75–132 Search PubMed.
- L. T. Zhuravlev, The surface chemistry of amorphous silica. Zhuravlev model, Colloids Surf., A, 2000, 173, 1–38 CrossRef CAS.
- A. S. D’Souza and C. G. Pantano, Hydroxylation and Dehydroxylation Behavior of Silica Glass Fracture Surfaces, J. Am. Ceram. Soc., 2002, 85, 1499–1504 CrossRef.
- N. R. Tas, J. Haneveld, H. V. Jansen, M. Elwenspoek and A. van den Berg, Capillary filling speed of water in nanochannels, Appl. Phys. Lett., 2004, 85, 3274–3276 CrossRef CAS.
- J. Haneveld, N. R. Tas, N. Brunets, H. V. Jansen and M. Elwenspoek, Capillary filling of sub-10nm nanochannels, J. Appl. Phys., 2008, 104, 14309 CrossRef.
- J. M. Oh, T. Faez, S. de Beer and F. Mugele, Capillarity-driven dynamics of water–alcohol mixtures in nanofluidic channels, Microfluid. Nanofluid., 2010, 9, 123–129 CrossRef CAS.
- M. Yang, B.-Y. Cao, W. Wang, H.-M. Yun and B.-M. Chen, Experimental study on capillary filling in nanochannels, Chem. Phys. Lett., 2016, 662, 137–140 CrossRef CAS.
- A. Han, G. Mondin, N. G. Hegelbach, N. F. de Rooij and U. Staufer, Filling kinetics of liquids in nanochannels as narrow as 27 nm by capillary force, J. Colloid Interface Sci., 2006, 293, 151–157 CrossRef CAS PubMed.
- D. R. Ceratti, M. Faustini, C. Sinturel, M. Vayer, V. Dahirel, M. Jardat and D. Grosso, Critical effect of pore characteristics on capillary infiltration in mesoporous films, Nanoscale, 2015, 7, 5371–5382 RSC.
- D. Ben Jazia, L. Vonna, G. Schrodj, H. Bonnet, Y. Holl and H. Haidara, Imbibing drops of ethanol/water mixtures in model nanoporous networks with tunable pore structure: Deviation from square root to linear time regime imbibition kinetics, Colloids Surf., A, 2011, 384, 643–652 CrossRef CAS.
- L. Li, Y. Kazoe, K. Mawatari, Y. Sugii and T. Kitamori, Viscosity and Wetting Property of Water Confined in Extended Nanospace Simultaneously Measured from Highly-Pressurized Meniscus Motion, J. Phys. Chem. Lett., 2012, 3, 2447–2452 CrossRef CAS PubMed.
- G. Martic, F. Gentner, D. Seveno, D. Coulon, J. De Coninck and T. D. Blake, A Molecular Dynamics Simulation of Capillary Imbibition, Langmuir, 2002, 18, 7971–7976 CrossRef CAS.
- H. Bruus, Theoretical Microfluidics, OUP Oxford, 2008 Search PubMed.
- M. Reyssat, L. Courbin, E. Reyssat and H. A. Stone, Imbibition in geometries with axial variations, J. Fluid Mech., 2008, 615, 335–344 CrossRef.
- F. F. Ouali, G. McHale, H. Javed, C. Trabi, N. J. Shirtcliffe and M. I. Newton, Wetting considerations in capillary rise and imbibition in closed square tubes and open rectangular cross-section channels, Microfluid. Nanofluid., 2013, 15, 309–326 CrossRef CAS.
- T. D. Blake and J. M. Haynes, Kinetics of liquidliquid displacement, J. Colloid Interface Sci., 1969, 30, 421–423 CrossRef CAS.
- P. G. de Gennes, Wetting: statics and dynamics, Rev. Mod. Phys., 1985, 57, 827–863 Search PubMed.
- R. Klages, W. Just and C. Jarzynski, Nonequilibrium Statistical Physics of Small Systems: Fluctuation Relations and Beyond, Wiley, 2013 Search PubMed.
- S. Gruener, T. Hofmann, D. Wallacher, A. V. Kityk and P. Huber, Capillary rise of water in hydrophilic nanopores, Phys. Rev. E: Stat., Nonlinear, Soft Matter Phys., 2009, 79, 67301 CrossRef PubMed.
- S. Gruener, D. Wallacher, S. Greulich, M. Busch and P. Huber, Hydraulic transport across hydrophilic and hydrophobic nanopores: Flow experiments with water and n-hexane, Phys. Rev. E, 2016, 93, 13102 CrossRef PubMed.
- S. Gruener and P. Huber, Spontaneous Imbibition Dynamics of an n-Alkane in Nanopores: Evidence of Meniscus Freezing and Monolayer Sticking, Phys. Rev. Lett., 2009, 103, 174501 CrossRef PubMed.
- C. Sendner, D. Horinek, L. Bocquet and R. R. Netz, Interfacial Water at Hydrophobic and Hydrophilic Surfaces: Slip, Viscosity, and Diffusion, Langmuir, 2009, 25, 10768–10781 CrossRef CAS PubMed.
- D. Ortiz-young, H. Chiu, S. Kim, K. Voïtchovsky and E. Riedo, The interplay between apparent viscosity and wettability in nanoconfined water, Nat. Commun., 2013, 4, 2482 Search PubMed.
- O. Vincent, A. Szenicer and A. D. Stroock, Capillarity-driven flows at the continuum limit, Soft Matter, 2016, 12, 6656–6661 RSC.
- D. I. Dimitrov, A. Milchev and K. Binder, Capillary Rise in Nanopores: Molecular Dynamics Evidence for the Lucas–Washburn Equation, Phys. Rev. Lett., 2007, 99, 54501 CrossRef CAS PubMed.
- M. Majumder, N. Chopra, R. Andrews and B. J. Hinds, Nanoscale hydrodynamics: Enhanced flow in carbon nanotubes, Nature, 2005, 438, 44 CrossRef CAS PubMed.
- J. K. Holt, H. G. Park, Y. Wang, M. Stadermann, A. B. Artyukhin, C. P. Grigoropoulos, A. Noy and O. Bakajin, Fast Mass Transport Through Sub-2-Nanometer Carbon Nanotubes, Science, 2006, 312, 1034–1037 CrossRef CAS PubMed.
- S. Supple and N. Quirke, Rapid Imbibition of Fluids in Carbon Nanotubes, Phys. Rev. Lett., 2003, 90, 214501 CrossRef CAS PubMed.
- M. Whitby and N. Quirke, Fluid flow in carbon nanotubes and nanopipes, Nat. Nanotechnol., 2007, 2, 87–94 CrossRef CAS PubMed.
- D. Mattia and F. Calabrò, Explaining high flow rate of water in carbon nanotubes via solid–liquid molecular interactions, Microfluid. Nanofluid., 2012, 13, 125–130 CrossRef CAS.
Footnotes |
| † Electronic supplementary information (ESI) available. See DOI: 10.1039/c7cp05833k |
| ‡ Herein, “dynamics” refers to the power-law trend of the data. |
| § Nanochannel cross-sections are trapezoidal in shape due to a slight reactive ion etch-generated sidewall tapering (85° walls instead of 90° walls) and can be approximated as rectangular for which a greater number of analytical solutions are available. |
| ¶ Fresh Milli-Q water has a pH of 7, but its pH will slightly lower upon exposure to the atmosphere (CO2). |
| || We were granted temporary access to an inverted Nikon Ti microscope with reflected DIC microscopy mode and a CCD camera capable of >20 fps prior to the experiments discussed herein. An imbibition experiment with pure IPA on that microscope allowed confirmation of observed polar imbibition trends at a tenfold faster frame rate; these results are shown in Fig. SM8 of the ESI.† |
| ** Only the initial condition l(t = 0) = 0 is valid for this case. |
| †† Eqn (2) assumes that the flow is in the viscous regime and instantly resumes (or relaxes to) Poiseuille flow (quasi-steady state). |
| ‡‡ Imbibition studies on organic and carbonate surfaces or proxies for these surfaces would need to be performed for complete descriptions in geologic rocks. |
| This journal is © the Owner Societies 2018 |

