 Open Access Article
Creative Commons Attribution 3.0 Unported Licence
Seeing the invisible plasma with transient phonons in cuprous oxide†
Laszlo
Frazer
 *a,
Richard D.
Schaller
bc,
Kelvin B.
Chang
c,
Aleksandr
Chernatynskiy
d and
Kenneth R.
Poeppelmeier
ce
aSchool of Chemistry, UNSW Sydney, NSW 2052, Australia and Department of Chemistry, Temple University, 1901 N. 13th Street, Philadelphia, PA 19122, USA. E-mail: pccp@laszlofrazer.com; Tel: +1 61 401 648 058
bCenter for Nanoscale Materials, Argonne National Laboratory, 9700 South Cass Avenue, Building 440, Argonne, IL 60439, USA
cDepartment of Chemistry, Northwestern University, 2145 Sheridan Road, Evanston, Illinois 60208-3112, USA
dDepartment of Physics, Missouri University of Science and Technology, 117 Physics Building, Rolla, Missouri 65409-0640, USA
eChemical Sciences and Engineering Division, Argonne National Laboratory, 9700 South Cass Avenue, Argonne, Illinois 60439, USA
First published on 12th December 2016
Abstract
The emission of phonons from electron–hole plasma is the primary limit on the efficiency of photovoltaic devices operating above the bandgap. In cuprous oxide (Cu2O) there is no luminescence from electron–hole plasma. Therefore, we searched for optical phonons emitted by energetic charge carriers using phonon-to-exciton upconversion transitions. We found 14 meV phonons with a lifetime of 0.916 ± 0.008 ps and 79 meV phonons that are longer lived and overrepresented. It is surprising that the higher energy phonon has a longer lifetime.
1 Introduction
Cuprous oxide is a semiconductor with a high theoretical photovoltaic/photocatalytic efficiency, composed of abundant and nontoxic elements.1,2 The well-known Shockley–Queisser efficiency limit for a single junction solar cell assumes that all above-gap photons generate the same voltage owing to rapid thermalisation.3 Recently, first principles calculations have shown that the energy above the bandgap is lost primarily to phonon radiation and secondarily to charge carrier interactions.4 Here, we use time-resolved phonon-to-exciton5,6 transitions to detect phonon radiation from charge carriers.Charge carrier/phonon inelastic scattering can be examined by measuring carriers or by measuring phonons. For example, the depletion of energy from electron–hole plasma has been measured using time resolved luminescence in several materials.7–12 However, in cuprous oxide, both the 3d-like valence and the 4s-like13 conduction band have positive parity. Therefore, electron–hole plasma luminescence is forbidden and not observed. Plasma relaxation can be measured with surface electron photoemission14,15 and nanosecond scale cyclotron resonance.16 This led us to develop a bulk, femtosecond scale phonon measurement approach.
2 Experimental
2.1 Transient absorption
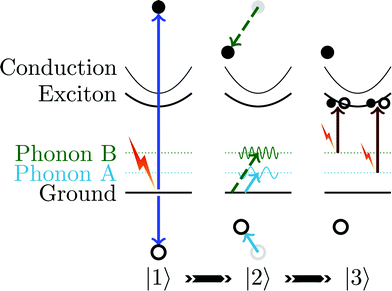
Transient absorption has been used to measure hot carrier lifetimes in bulk crystals of MoS2 (50 ps)17 and to detect hot carriers in bulk crystals of α-Fe2O3.18 It has also been applied to electron–hole recombination in bulk,19 which is a forbidden process in cuprous oxide. In cuprous oxide, mid-infrared transient absorption has been used for excitonic Lyman spectroscopy.20 Electron beam excitation, as opposed to optical excitation, has also been used.21 There are also numerous studies of nanomaterials such as ref. 22. To the best of our knowledge, this is the first report of time resolved measurements of phonon-to-exciton transitions.Here, we report the use of a pump pulse to produce an optically dark electron–hole plasma (|1〉) that results in emission of phonons by the carriers (|2〉). The carriers in the plasma may relax through a variety of bands.23 The absorbance is then measured to obtain the dynamics of the two phonon modes (|3〉). These three steps are illustrated in Fig. 1.
We used a regeneratively amplified 35 fs Ti:Sapphire laser. The amplifier output was split into pump and probe beams. The pump beam passed through a delay line. It was frequency doubled to 400 nm in a β-barium borate crystal. The fundamental was filtered out. The pump was chopped from 2 kHz to a 1 kHz repetition rate. 22 J m−2 were focused on to the sample in a spot with a diameter of 0.85 mm to 1/e.
This pump configuration can access transitions up 2.62 eV to the second conduction band that are dipole allowed and that lie above the four exciton series.23 The conduction bands near the surface were pumped with about 1032 electrons s−1 m−2 at the peak of each laser pulse. The peak pump irradiance is 1012 times typical sunlight irradiance.24 While the rate of nonthermal phonon upconversion to excitons is small in a typical cuprous oxide solar cell when compared to this experiment, the bath of thermal optical phonons is much larger. At ambient temperatures, about 100 meV of sub-bandgap absorption, which is driven by thermal phonon upconversion, contributes to the efficiency of the solar cell, assuming a thickness of 1 mm or more.6
The probe beam was converted to white light using self-phase-matching in a 2 mm thick sapphire. The fundamental was filtered out. The beam was tightly focused on the sample at a small angle to the pump beam and in the centre of the pump beam.
The cuprous oxide crystal was grown using our previously reported method for producing relatively large, phase-pure crystals with minimal point defects.25–28 For this experiment, the sample with [100] faces from ref. 29 was mounted on a sapphire in vacuum at a temperature of 3.2 K to reduce the thermal background.6,30 The crystal was oriented with the pump beam travelling in the [100] direction, which is normal to the surface. The pump beam's electric field was polarised parallel to [010].
The transmitted portion of the probe beam was collected in an Ultrafast Systems Helios spectrometer with 2 nm resolution. The resolution is not sufficient to observe the 1s orthoexciton polariton. Probe shots with and without the pump beam were recorded for various positions of the pump delay line to determine the time dependence of the phonon relaxation. The baseline measured when the probe arrived before the pump was subtracted from the data.
2.2 Ab initio methods
To better understand the measurements, we also performed first-principles calculations of the phonon lifetimes at the Γ-point. The band extrema are located at the Γ-point. Our phonon lifetime calculations assume anharmonicity as a perturbation to the harmonic problem; for the low temperatures considered in our experiments, this is well-obeyed approximation. This is further supported by the experimental lack of interaction between transient phonons in Fig. 4 as discussed below. Theoretical details in the context of inelastic neutron scattering can be found in ref. 31. Computations were performed using the software package PhonTS32 developed by one of the authors. Second and third order force constants necessary for this calculation were obtained from standard density functional calculations (DFT) within the local density approximation (LDA) using the finite displacement method. A supercell consisting of 2 × 2 × 2 primitive cells was used for the calculations with a 500 eV energy cutoff for the plainwave expansion of the electronic wavefunction and Γ-point sampling of the Brillouin zone. Past calculations have shown that anharmonic terms are relatively short ranged in semiconductors. Larger supercells are not required for these calculations.33,34 Calculations were performed with the Vienna Ab Initio Simulation Package (VASP).35–38 While hybrid functionals are required in order to obtain accurate electronic structure,39 phonon properties are sufficiently accurate at the LDA level.403 Results and discussion
3.1 Transient absorption analysis
We found that changes in the number of optical phonons present can be measured using so-called phonon to 1s orthoexciton transitions.6,45 The exciton series in question is called the ‘yellow’ series because it is the lowest lying set of electron–hole bound states.23 Since the phonon density of states is spectrally sharp,46,47 the structure of the transient absorbance A(E,t) as a function of energy depends on the phonon energy and the exciton density of states. According to Fermi's golden rule,6
 | (1) |
 | (2) |
![[thin space (1/6-em)]](https://www.rsc.org/images/entities/char_2009.gif) 894 data points (Fig. 2(a)), we found that τA = 0.916 ± 0.008 ps and τB = 31 ± 3 ps. The uncertainties account for random errors only. Validation of the error calculations is described in the ESI.† In other materials, phonon lifetimes are typically in the few picosecond range.48,49 Transitions involving additional phonons are not expected to be observed based on previous experimental results.6 Transition matrix elements for the various phonons that have not yet been observed participating in phonon-to-exciton transitions are an interesting area for potential future investigation.
894 data points (Fig. 2(a)), we found that τA = 0.916 ± 0.008 ps and τB = 31 ± 3 ps. The uncertainties account for random errors only. Validation of the error calculations is described in the ESI.† In other materials, phonon lifetimes are typically in the few picosecond range.48,49 Transitions involving additional phonons are not expected to be observed based on previous experimental results.6 Transition matrix elements for the various phonons that have not yet been observed participating in phonon-to-exciton transitions are an interesting area for potential future investigation.
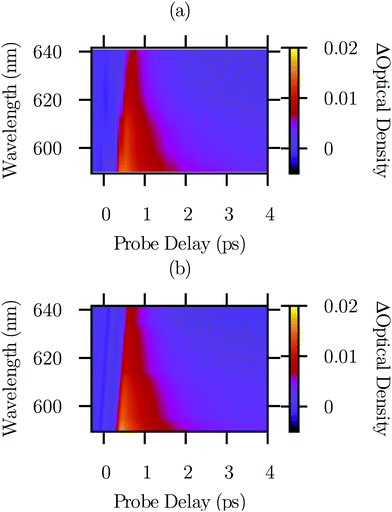 | ||
| Fig. 2 (a) Transient absorption, baseline subtracted and down sampled to a grid with a Gaussian kernel. (b) The complete model of the transient absorption data including our models of phonon production and phonon-to-exciton absorption transitions. The model (b) is intended to resemble the data (a). The model (b) is detailed in Section 3.1 and in the ESI.† | ||
Fig. S1(c) and (d) (ESI†) show the models of each of the phonon assisted transitions used to determine np(t). For these model parts, only the amplitude apnp(0) and lifetime τp were independent regression parameters; literature phonon and exciton energies were assumed because they are more precise.30,50Ref. 6, Fig. 4 provides particularly elegant time averaged data validating the spectral assignments we are reusing. The phonon spectrum is consistent between neutron, Raman, absorption, luminescence, and density functional theory methodologies.46
Above 2.085 eV (595 nm), we serendipitously found a feature corresponding to a superposition of phonon-to-exciton transitions with the exciton n > 1.13,51 It has a lifetime of 9.8 ± 0.5 ps and the same amplitude as the B to 1s transition. This portion of our model, which is treated mathematically the same way as processes A and B for simplicity, is shown in ESI,† Fig. S1(e). Above 2.15 eV, not enough light was transmitted to allow for measurements of transient absorption.
The total model, including time and wavelength dependence of the transient absorption, is shown in Fig. 2(b) to agree with the data in Fig. 2(a). A broader view of the complete model (f) and data (g) is shown in ESI,† Fig. S1. We excluded data for wavelengths greater than 640 nm from the analysis because they do not include the signals of interest.
3.2 Partition of energy into phonon modes: relative amplitudes of phonon state occupation
Based on the equipartition theorem, the steady state occupation of A should be about six times that of B. This is consistent with the relative strengths of the steady state A/B phonon-to-exciton absorption features.6,52,53 We conclude aA ≈ aB. In the transient absorption spectrum, however, aAnA(0)/(aBnB(0)) = 2.0 ± 0.3 ≪ 6, indicating that carriers release about a third as much energy in the form of phonon A as in the form of phonon B. Future electron–phonon scattering calculations4,54–57 may explain the distribution of emitted phonons and the phonon emission and absorption rates.57,583.3 Power dependence
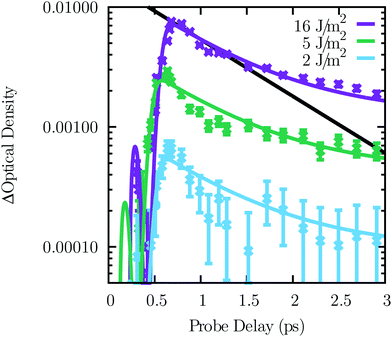
In order to test for density-dependent effects, we studied the dependence of the transient absorption on the excitation power. We did not observe any density-dependent effects, which might have included absorption of phonons by electron–hole plasma. The absorption dynamics at 600 nm for three laser excitation powers are shown in Fig. 3. This wavelength includes both the A and B phonon assisted transient absorption. A single exponential representing τA is drawn in solid black to show that the data are not a single exponential decay. The data are in reasonable agreement with the hypothesis that the phonon lifetimes are independent of the laser excitation power (Fig. 3 lines). There may be a dip in the lower power data around 1 ps.The creation of phonons is illustrated in Fig. 6(a). Phonon absorption is illustrated in Fig. 6(f). In our conditions, the phonon density is driven by conduction carriers, which create phonons, and phonon relaxation, as opposed to phonon absorption by conduction carriers, exciton–exciton annihilation, or phonon–phonon annihilation. The rates of these three excluded processes are dependent on the excitation power, but no power dependence is observed in Fig. 3. The excluded processes are power dependent because at low temperature they can only occur when two photoexcited states interact. In a highly doped semiconductor55,56,58,59 or a metal,57 absorption of phonons by carriers would dominate, even in the absence of photoinduced carriers.
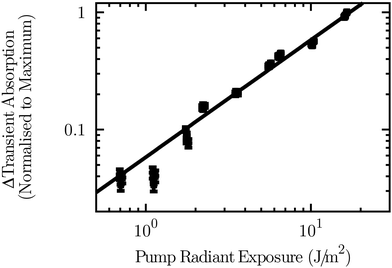
The phonon density should grow linearly with pump intensity. The amplitude of the transient absorption was determined versus laser power. All components of the model were assumed to scale proportionately. The linear relationship is confirmed in Fig. 4.
3.4 Origin of transient phonons: short-lived plasma and long-lived excitons
By selecting a high excitation energy (3 eV), we have caused the intraband and second-to-first conduction (or valence) band transitions to be the primary source of phonons. Of these four bands, only the second conduction band has negative parity, suggesting it plays an important role in the emission of negative parity phonons. Transitions to and between the exciton states in the four exciton series13,23,60,61 also contribute to phonon production. The energy breakdown of 3 eV is 30% conduction carrier relaxation (Fig. 6(a)), 5% yellow exciton formation/thermalisation (Fig. 6(e)), and 66% bandgap.Owing to the high density of states, conduction carriers primarily relax within the timescales studied here. Conduction carrier relaxation times are typically shorter than phonon lifetimes. This is the basis for hot phonon engineering.7,62 The carrier relaxation includes electron–hole annihilation and exciton formation that reduces the carrier number in a manner that is strongly density-dependent. In the future, in order to introduce additional phonon scattering processes, heavy doping could be used to add conduction carriers or higher temperatures could be used to add bath phonons. These potential future experiments will lead to additional complexity in the absorption spectrum.6,52,53
The rise time of the phonons caused by phonon emission from high energy electron–hole plasma is not observed nor do we expect it to be resolvable with currently available short-pulsed lasers. The complex process of exciton thermalisation, however, relies on phonon emission through strict selection rules.63 The thermalisation time can exceed the exciton lifetime at low temperatures.64 These slow phonon emission processes were not the target of this study. We expect they are too weak and too slow to contribute meaningfully to the data, which we interpret in terms of phonon lifetimes, not phonon excitation rates.
Exciton thermalisation by phonon emission, and its manipulation by strain, are crucial to exciton relaxation explosion63,64 and exciton/vacancy binding.65 All these processes can be repumped by inelastic exciton–exciton scattering.16,66–69
3.5 Potential additional backgrounds
Our interest is in the initial electron–hole plasma. We do not extrapolate the results beyond the 4 ps time window of the 113![[thin space (1/6-em)]](https://www.rsc.org/images/entities/char_2009.gif) 894 data points shown in Fig. 2. The signal to noise ratio for a single data point peaks at around 200.
894 data points shown in Fig. 2. The signal to noise ratio for a single data point peaks at around 200.
Owing to two kinds of known background, we did not collect data beyond 4 ps for the analysis of phonon-to-exciton transitions. First, some of the exciton relaxation routes are slow;70 as a result np was detectably greater than zero at the longest delay we had available (6 ns). Second, as shown in Fig. 5, there are oscillations in the transient absorption consistent with the known 43 GHz Brillouin mode of cuprous oxide.71,72 Similar coherent phonon oscillations, whose frequencies have a slight wavelength dependence arising from refractive index variation, have been observed in other materials.73–76 These two backgrounds contribute to the systematic error in the model. They are smaller than the phonon-to-exciton transition signal originating from the electron–hole plasma.
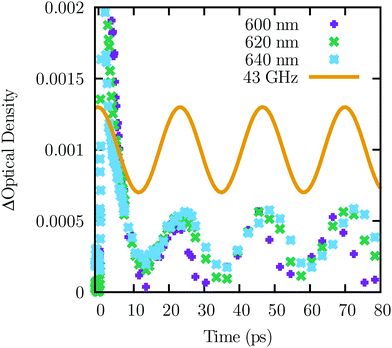 | ||
| Fig. 5 Low frequency phonons cause oscillations in the transient absorption. The curve shows the Brillouin frequency71,72 as a guide to the eye. The range of the initial transient is not shown. | ||
The electron–hole plasma may absorb the probe light. This process gets stronger at longer wavelengths and has been observed in the infrared in other materials.77 We did not find any evidence for this phenomenon.
3.6 Ab initio results
Our results for phonon frequencies are in good agreement with previous results, which have also shown the density of states.46 Computed lifetimes for all phonons at the Γ-point are presented in Table 1. The A phonon has a lifetime of 1.98 ps, in good agreement with experimental value. Interestingly, the 3Γ25+ phonon, which does not induce absorption,6,45 has a very long lifetime of 178 ps.| Phonon | E p (meV) | Computed τp (ps) | Measured τp (ps) |
|---|---|---|---|
| 3Γ25− | 8.4 | 23.8 | |
| 2Γ12− (A) | 9.5 | 1.98 | 0.916 ± 0.008 |
| 3Γ15− | 18.8 | 1.68 | |
| 3Γ15− | 20.0 | 1.11 | |
| 1Γ2− | 41.1 | 15.0 | |
| 3Γ25+ | 62.5 | 178 | |
| 3Γ15− (B) | 75.8 | 0.53 | 31 ± 3 |
| 3Γ15− | 78.1 | 0.69 |
The B phonon, however, has a much shorter calculated lifetime than measured lifetime. The disagreement suggests that the B phonon occupation is selectively repumped. One well-known mechanism of repumping from cold exciton states to hot carrier states is Auger recombination. Auger recombination is a density-dependent process, but the repumping of conduction carriers may or may not have a density dependent rate.78 It depends on the relative magnitude of density-dependent and density-independent decay of the underlying exciton states. Different measurements of Auger recombination are reviewed in ref. 79 and 80.
We note that B (but not A) phonons may be produced by potentially slow relaxation of carriers from about 54 meV above the bandgap to 2p excitons (binding energy 25 meV). We did not find any evidence for multiple timescales in the B signal, so if transitions to 2p excitons explain τB then they are the primary source of B phonons. This concept could be tested by measuring bleach of the 2p line in a thinner sample.13
4 Conclusions
We determined the lifetime and relative occupation of two phonon modes in the first picosecond after light absorption. These phonons were detected using absorptive transitions from the phonon state to the 1s orthoexciton state (Fig. 6(c)). Prior knowledge of the phonon and exciton density of states provides for assignment of the absorption bands.6,50,52,53 The higher energy mode has a surprisingly long lifetime.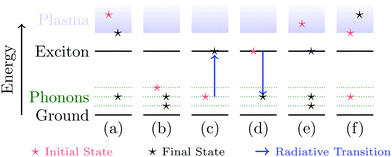 | ||
| Fig. 6 Simplified energy level diagrams for six different phonon scattering processes, with the initial and final states indicated. Process (a): emission of a phonon by the plasma of conduction carriers, which we used to set up our experiment. Process (b): relaxation of a phonon to lower energy phonon states, which is our interpretation of the lifetimes reported here. Process (c): phonon-to-exciton transitions used to perform the measurements. Process (d): phonon-assisted luminescence, which is well known.27,50 Process (e): exciton formation, which is in need of investigation and cannot be distinguished from process (a) in this experiment. Process (f): excitation of conduction carriers by a phonon. Process (f) is important at high carrier concentrations. Varying the excitation intensity to change the carrier concentration in the electron–hole plasma did not produce a detectable change in the dynamics, so we interpret our results in terms of process (b) rather than process (f). | ||
The phonons we measured originate from relaxation of free carriers towards the conduction band minimum (Fig. 6(a)). This relaxation process is an important factor that caps the high theoretical solar energy conversion efficiency of cuprous oxide, a high elemental abundance, nontoxic semiconductor.1,2 Phonon emission can remove all charge carrier energy that is above the bandgap. We have captured phononic waste heat and light that is usually transmitted. We stored the energy in excitons. If these additional excitons6 can be utilised in future photovoltaic devices,5 it will increase the efficiency of solar energy conversion.
Acknowledgements
L. F. acknowledges NSF DGE-0801685 and the Institute for Sustainability and Energy at Northwestern. Use of the Center for Nanoscale Materials was supported by the U.S. Department of Energy, Office of Science, Office of Basic Energy Sciences, under Contract No. DE-AC02-06CH11357. Crystal growth was supported by NSF DMR-1307698 and in part by Argonne National Laboratory under U.S. Department of Energy contract DE-AC36-08GO28308. We acknowledge the X-ray and OMM Facilities at the MRC of Northwestern, which are supported by NSF MRSEC program DMR-1121262.References
- L. Y. Isseroff and E. A. Carter, Chem. Mater., 2013, 25, 253–265 CrossRef CAS.
- W. Septina, S. Ikeda, M. A. Khan, T. Hirai, T. Harada, M. Matsumura and L. M. Peter, Electrochim. Acta, 2011, 56, 4882–4888 CrossRef CAS.
- W. Shockley and H. J. Queisser, J. Appl. Phys., 1961, 32, 510–519 CrossRef CAS.
- M. Bernardi, D. Vigil-Fowler, J. Lischner, J. B. Neaton and S. G. Louie, Phys. Rev. Lett., 2014, 112, 257402 CrossRef PubMed.
- J. R. Santos, M. I. Vasilevskiy and S. A. Filonovich, Phys. Rev. B: Condens. Matter Mater. Phys., 2008, 78, 245422 CrossRef.
- P. W. Baumeister, Phys. Rev., 1961, 121, 359 CrossRef CAS.
- Y. Zhang, M. J. Tayebjee, S. Smyth, M. Dvořák, X. Wen, H. Xia, M. Heilmann, Y. Liao, Z. Zhang and T. Williamson, et al. , Appl. Phys. Lett., 2016, 108, 131904 CrossRef.
- R. Clady, M. J. Tayebjee, P. Aliberti, D. König, N. J. Ekins-Daukes, G. J. Conibeer, T. W. Schmidt and M. A. Green, Prog. Photovoltaics, 2012, 20, 82–92 CAS.
- L. Hirst, M. Führer, D. J. Farrell, A. LeBris, J.-F. Guillemoles, M. J. Tayebjee, R. Clady, T. W. Schmidt, Y. Wang and M. Sugiyama, et al. , IEEE Photovoltaic Spec. Conf., 34th, 2011, 003302 Search PubMed.
- J. Ryan, R. Taylor, A. Turberfield, A. Maciel, J. Worlock, A. Gossard and W. Wiegmann, Phys. Rev. Lett., 1984, 53, 1841 CrossRef CAS.
- T. Elsaesser, J. Shah, L. Rota and P. Lugli, Phys. Rev. Lett., 1991, 66, 1757 CrossRef CAS PubMed.
- H. Yoshida, H. Saito, S. Shionoya and V. Timofeev, Solid State Commun., 1980, 33, 161–165 CrossRef CAS.
- T. Kazimierczuk, D. Fröhlich, S. Scheel, H. Stolz and M. Bayer, Nature, 2014, 514, 343–347 CrossRef CAS PubMed.
- T. Rohwer, S. Hellmann, M. Wiesenmayer, C. Sohrt, A. Stange, B. Slomski, A. Carr, Y. Liu, L. M. Avila and M. Kalläne, et al. , Nature, 2011, 471, 490–493 CrossRef CAS PubMed.
- J.-C. Deinert, D. Wegkamp, M. Meyer, C. Richter, M. Wolf and J. Stähler, Phys. Rev. Lett., 2014, 113, 057602 CrossRef PubMed.
- N. Naka, I. Akimoto, M. Shirai and K. Kan'no, Phys. Rev. B: Condens. Matter Mater. Phys., 2012, 85, 035209 CrossRef.
- N. Kumar, J. He, D. He, Y. Wang and H. Zhao, J. Appl. Phys., 2013, 113, 133702 CrossRef.
- A. G. Joly, J. R. Williams, S. A. Chambers, G. Xiong, W. P. Hess and D. M. Laman, J. Appl. Phys., 2006, 99, 053521 CrossRef.
- R. Katoh, M. Murai and A. Furube, Chem. Phys. Lett., 2008, 461, 238–241 CrossRef CAS.
- T. Tayagaki, A. Mysyrowicz and M. Kuwata-Gonokami, J. Phys. Soc. Jpn., 2005, 74, 1423–1426 CrossRef CAS.
- R. Fuller, R. Williams and M. Kabler, Phys. Rev. Lett., 1970, 25, 446 CrossRef CAS.
- M. A. Mahmoud, W. Qian and M. A. El-Sayed, Nano Lett., 2011, 11, 3285–3289 CrossRef CAS PubMed.
- J. Schmutzler, D. Fröhlich and M. Bayer, Phys. Rev. B: Condens. Matter Mater. Phys., 2013, 87, 245202 CrossRef.
- R. C. Temps and K. Coulson, Sol. Energy, 1977, 19, 179–184 CrossRef.
- K. B. Chang, L. Frazer, J. J. Schwartz, J. B. Ketterson and K. R. Poeppelmeier, Cryst. Growth Des., 2013, 13, 4914–4922 CAS.
- L. Frazer, K. B. Chang, K. R. Poeppelmeier and J. B. Ketterson, Sci. Technol. Adv. Mater., 2015, 16, 034901 CrossRef PubMed.
- L. Frazer, E. J. Lenferink, K. B. Chang, K. R. Poeppelmeier, N. P. Stern and J. B. Ketterson, J. Lumin., 2015, 159, 294–302 CrossRef CAS.
- L. Frazer, K. B. Chang, R. D. Schaller, K. R. Poeppelmeier and J. B. Ketterson, J. Lumin., 2017, 183, 281–290 CrossRef CAS.
- L. Frazer, K. B. Chang, K. R. Poeppelmeier and J. B. Ketterson, Phys. Rev. B: Condens. Matter Mater. Phys., 2014, 89, 245203 CrossRef.
- T. Ito and T. Masumi, J. Phys. Soc. Jpn., 1997, 66, 2185–2193 CrossRef CAS.
- A. A. Maradudin and A. E. Fein, Phys. Rev., 1962, 128, 2589–2608 CrossRef CAS.
- A. Chernatynskiy and S. R. Phillpot, Comput. Phys. Commun., 2015, 192, 196–204 CrossRef CAS.
- L. Lindsay, D. Broido and T. Reinecke, Phys. Rev. B: Condens. Matter Mater. Phys., 2013, 87, 165201 CrossRef.
- A. Chernatynskiy, J. E. Turney, A. J. McGaughey, C. H. Amon and S. R. Phillpot, J. Am. Ceram. Soc., 2011, 94, 3523–3531 CrossRef CAS.
- G. Kresse and J. Hafner, Phys. Rev. B: Condens. Matter Mater. Phys., 1993, 47, 558–561 CrossRef CAS.
- G. Kresse and J. Hafner, Phys. Rev. B: Condens. Matter Mater. Phys., 1994, 49, 14251–14269 CrossRef CAS.
- G. Kresse and J. Furthmüller, Phys. Rev. B: Condens. Matter Mater. Phys., 1996, 54, 11169–11186 CrossRef CAS.
- G. Kresse and J. Furthmüller, Comput. Mater. Sci., 1996, 6, 15–50 CrossRef CAS.
- L. Y. Isseroff and E. A. Carter, Phys. Rev. B: Condens. Matter Mater. Phys., 2012, 85, 235142 CrossRef.
- K.-P. Bohnen, R. Heid, L. Pintschovius, A. Soon and C. Stampfl, Phys. Rev. B: Condens. Matter Mater. Phys., 2009, 80, 134304 CrossRef.
- B. Dietzek, T. Pascher, V. Sundström and A. Yartsev, Laser Phys. Lett., 2007, 4, 38 CrossRef.
- S. Kovalenko, A. Dobryakov, J. Ruthmann and N. Ernsting, Phys. Rev. A: At., Mol., Opt. Phys., 1999, 59, 2369 CrossRef CAS.
- R. Elliott, Phys. Rev., 1961, 124, 340 CrossRef CAS.
- K. O'Hara, PhD thesis, University of Illinois at Urbana-Champaign, 1999.
- P. Y. Yu and Y. Shen, Phys. Rev. B: Condens. Matter Mater. Phys., 1975, 12, 1377 CrossRef CAS.
- P. A. Korzhavyi and B. Johansson, Literature review on the properties of cuprous oxide Cu2O and the process of copper oxidation, Swedish Nuclear Fuel and Waste Management Company, 2011 Search PubMed.
- M. Beg and S. Shapiro, Phys. Rev. B: Condens. Matter Mater. Phys., 1976, 13, 1728 CrossRef CAS.
- R. Alfano and S. Shapiro, Phys. Rev. Lett., 1971, 26, 1247 CrossRef CAS.
- F. Vallee, Phys. Rev. B: Condens. Matter Mater. Phys., 1994, 49, 2460 CrossRef CAS.
- Y. Petroff, P. Yu and Y. Shen, Phys. Rev. B: Condens. Matter Mater. Phys., 1975, 12, 2488 CrossRef CAS.
- C. Uihlein, D. Fröhlich and R. Kenklies, Phys. Rev. B: Condens. Matter Mater. Phys., 1981, 23, 2731 CrossRef CAS.
- T. Itoh and S.-I. Narita, J. Phys. Soc. Jpn., 1975, 39, 140–147 CrossRef CAS.
- T. Itoh and S.-I. Narita, J. Phys. Soc. Jpn., 1975, 39, 132–139 CrossRef CAS.
- H. Kawai, G. Giorgi, A. Marini and K. Yamashita, Nano Lett., 2015, 15, 3103–3108 CrossRef CAS PubMed.
- B. Liao, J. Zhou, B. Qiu, M. S. Dresselhaus and G. Chen, Phys. Rev. B: Condens. Matter Mater. Phys., 2015, 91, 235419 CrossRef.
- N. Tandon, J. Albrecht and L. Ram-Mohan, J. Appl. Phys., 2015, 118, 045713 CrossRef.
- Y. Wang, Z. Lu and X. Ruan, J. Appl. Phys., 2016, 119, 225109 CrossRef.
- B. Liao, B. Qiu, J. Zhou, S. Huberman, K. Esfarjani and G. Chen, Phys. Rev. Lett., 2015, 114, 115901 CrossRef PubMed.
- M. Bernardi, D. Vigil-Fowler, C. S. Ong, J. B. Neaton and S. G. Louie, Proc. Natl. Acad. Sci. U. S. A., 2015, 112, 5291–5296 CrossRef CAS PubMed.
- R. Forman, W. Brower Jr and H. Parker, Phys. Lett. A, 1971, 36, 395–396 CrossRef CAS.
- K. Yoshioka and M. Kuwata-Gonokami, Phys. Rev. B: Condens. Matter Mater. Phys., 2006, 73, 081202 CrossRef.
- P. Scott and C. Jeffries, Phys. Rev., 1962, 127, 32 CrossRef CAS.
- K. Yoshioka, Y. Morita, K. Fukuoka and M. Kuwata-Gonokami, Phys. Rev. B: Condens. Matter Mater. Phys., 2013, 88, 041201 CrossRef.
- K. Yoshioka, E. Chae and M. Kuwata-Gonokami, Nat. Commun., 2011, 2, 328 CrossRef.
- S. Koirala, M. Takahata, Y. Hazama, N. Naka and K. Tanaka, J. Lumin., 2014, 155, 65–69 CrossRef CAS.
- D. Snoke and G. Kavoulakis, Rep. Prog. Phys., 2014, 77, 116501 CrossRef PubMed.
- S. Mani, J. Jang and J. Ketterson, Phys. Rev. B: Condens. Matter Mater. Phys., 2010, 82, 113203 CrossRef.
- J. Jang and J. Wolfe, Phys. Rev. B: Condens. Matter Mater. Phys., 2005, 72, 241201 CrossRef.
- L. Frazer, R. D. Schaller and J. Ketterson, Solid State Commun., 2013, 170, 34–38 CrossRef.
- A. Mysyrowicz, D. Hulin and A. Antonetti, Phys. Rev. Lett., 1979, 43, 1123 CrossRef CAS.
- V. So, J. Sipe, M. Fukui and G. Stegeman, J. Phys. C: Solid State Phys., 1981, 14, 4487 CrossRef CAS.
- V. So, M. Fukui, P. Thomas and G. Stegeman, J. Phys. C: Solid State Phys., 1981, 14, 4505 CrossRef CAS.
- W. Liu, W. Xie, W. Guo, D. Xu, T. Hu, T. Ma, H. Yuan, Y. Wu, H. Zhao and X. Shen, et al. , Phys. Rev. B: Condens. Matter Mater. Phys., 2014, 89, 201201 CrossRef.
- K. Ishioka, M. Hase, M. Kitajima and H. Petek, Appl. Phys. Lett., 2006, 89, 231916 CrossRef.
- G. Cho, W. Kütt and H. Kurz, Phys. Rev. Lett., 1990, 65, 764 CrossRef CAS PubMed.
- M. Hase, M. Katsuragawa, A. M. Constantinescu and H. Petek, Nat. Photonics, 2012, 6, 243–247 CrossRef CAS.
- J. I. Pankove, Optical Processes in Semiconductors, Prentice-Hall, Englewood Cliffs, New Jersey, 1971 Search PubMed.
- N. Naka, I. Akimoto and M. Shirai, Phys. Status Solidi B, 2013, 250, 1773–1776 CrossRef CAS.
- J. P. Wolfe and J. I. Jang, New J. Phys., 2014, 16, 123048 CrossRef.
- S. Sobkowiak, D. Semkat and H. Stolz, Phys. Rev. B: Condens. Matter Mater. Phys., 2015, 91, 075209 CrossRef.
Footnote |
| † Electronic supplementary information (ESI) available: One figure providing a graphical breakdown of the analysis of transient absorption in cuprous oxide and a document describing the amplitudes of the model components and tests of the standard error calculations. See DOI: 10.1039/c6cp06532e |
| This journal is © the Owner Societies 2017 |

