Highly thermally conductive graphene-based electrodes for supercapacitors with excellent heat dissipation ability†
Bo
Zhao
ab,
Xian-Zhu
Fu
 *ac,
Rong
Sun
*a and
Ching-Ping
Wong
d
aShenzhen Institutes of Advanced Technology, Chinese Academy of Sciences, Shenzhen 518055, P. R. China. E-mail: rong.sun@siat.ac.cn
bDepartment of Solid State Sciences, Ghent University, Krijgslaan 281 S1, Gent 9000, Belgium
cCollege of Materials Science and Engineering, Shenzhen University, Shenzhen 518055, P. R. China. E-mail: xz.fu@szu.edu.cn
dSchool of Materials Science and Engineering, Georgia Institute of Technology, Atlanta, GA 30332, USA
First published on 20th October 2017
Abstract
Efficient heat dissipation is a crucial issue for electrochemical energy storage devices like supercapacitors. A large amount of heat is generated during the charging and discharging processes, especially at high current densities. This significantly accelerates capacity fading and serious safety problems such as explosions might occur for energy storage devices, and it can also cause human discomfort and even skin burns for wearable electronic or implantable electronic devices if the heat does not dissipate efficiently. In this contribution, highly thermally conductive electrodes based on graphene–MnO2 films are developed, which demonstrate high thermal conductivity of 613.5 W m−1 K−1 relative to that of 1.1 W m−1 K−1 of the traditional MnO2 slurry electrodes. The high thermal conductivity film electrode-based supercapacitor not only exhibits excellent heat dissipation ability during the charging and discharging processes, which is beneficial for the thermal management of supercapacitor devices, but also good cycling performance and excellent rate capacity for a high specific capacity of about 218.8 F g−1 at a high current density of 10 A g−1.
1. Introduction
Efficient heat dissipation is a crucial issue for electrochemical energy storage devices like supercapacitors and batteries.1–7 When being charged and discharged, a large amount of heat is generated during the current flow through the internal resistance of the devices, especially for high power and large scale devices.8–11 If the heat cannot dissipate efficiently, it significantly accelerates capacity fading; furthermore, serious safety problems, such as explosions, might happen for high-power energy storage devices, and can also cause human discomfort or even skin burns for wearable electronic or implantable electronic devices.12–15The development of highly thermally conductive electrodes is an essential direct approach toward proper thermal management of supercapacitors. The high thermal conductivity electrode could dissipate in situ the heat generated in the process of charging and discharging, which would prevent the electrode temperature from getting too high. Conventional electrodes are fabricated by mixing the active materials with carbon black conductive agents and polymer binders. The polymer binder and carbon black usually have very low thermal conductivity of less than 0.2 and 1 W m−1 K−1, respectively, which results in conventional electrodes with a low thermal conductivity of 0.1–2 W m−1 K−1.16,17 The thermal conductivity of two-dimensional graphene is estimated to be ∼5300 W m−1 K−1.18 Graphene-based paper-like film materials, with chemically derived graphene or functionalized graphene as the basic building blocks, have exhibited great potential as next-generation lateral heat spreaders in recent reports.19–22
Herein, we developed a highly thermally conductive graphene–MnO2 (GN–MnO2) film as the electrodes for all-solid-state supercapacitors (ASSSs). MnO2 is considered to be among the most competitive electrode active materials for supercapacitors thanks to its high theoretical specific capacitance (1370 F g−1), environmental benignity, natural abundance, and low cost. The combination of MnO2 nanoparticles and graphene not only improved the conductivity but also kept the capacity from fading. The freestanding GN–MnO2 films are fabricated through vacuum filtration of graphene oxide and MnO2 solution, and then via high-temperature thermal reduction. The GN–MnO2 film demonstrates high thermal conductivity of 613.5 W m−1 K−1 and the resulting symmetrical ASSSs showed good flexibility, and a high specific capacity of about 218.8 F g−1 at a high current density of 10 A g−1. Infrared images recorded the thermal changes during the charging and discharging process, showing that the high thermal conductivity of the GN–MnO2 film electrode indeed effectively dissipated the heat, which is beneficial for the thermal management of energy devices.
2. Experimental section
2.1 Preparation of MnO2 nanoparticles
MnO2 nanoparticles were prepared using a solution-based ultrasonic process by redox reactions. Typically, 0.6 g of potassium permanganate (KMnO4) and 1.5 g of manganese sulfate (MnSO4·H2O) were dissolved in 250 mL of deionized water. Then the KMnO4 solution was added into the MnSO4 solution slowly with stirring, and the obtained solution was ultrasonicated using a KQ-600kDE Digital Ultrasonic cleaning device (600 W, 80% amplitude) for 2 h. Finally, the resultant precipitates were centrifuged then washed with water and ethanol several times, and dried at 60 °C for 6 h in a vacuum oven.2.2 Preparation of GN–MnO2 film
GO was synthesized from graphite powder based on modified Hummers' method. Typically, 2 g of graphite powder (100 mesh, from Alfa Aesar Reagent Co., Ltd, USA) and 2 g of NaNO3 were mixed with 92 mL of H2SO4 (wt 98%); the mixture was kept at 0–3 °C in an ice bath and stirred until homogeneous. Then, 12 g of KMnO4 was added slowly in batches to keep within 3 °C and moderately stirred magnetically for 3–5 h. Subsequently, the reaction system was transferred to a 37 °C water bath and stirred for about 2 h, forming a thick paste. Then, 160 mL of distilled water was added slowly to the solution, and the solution was stirred for 30 min at 95 °C. The mixture was further diluted with 400 mL of distilled water, then 12 mL of H2O2 (wt 30%) was added. The solution was vacuum filtered and washed with HCl (V![[thin space (1/6-em)]](https://www.rsc.org/images/entities/char_2009.gif) :
:![[thin space (1/6-em)]](https://www.rsc.org/images/entities/char_2009.gif) V, 1
V, 1![[thin space (1/6-em)]](https://www.rsc.org/images/entities/char_2009.gif) :
:![[thin space (1/6-em)]](https://www.rsc.org/images/entities/char_2009.gif) 10) and distilled water to neutralize. The concentration of the prepared graphene oxide solution was about 5 mg mL−1. Then, 20 mL of APS-modified MnO2 nanoparticle dispersion (0.5 mg mL−1) was added into 200 mL of GO suspension (0.2 mg mL−1) under mild mechanical stirring to render the sphere's surface positively charged. The solution was vacuum filtered to obtain the GO–MnO2 film. The GO–MnO2 film was hot pressed at 150 °C for 5 h, followed by thermal treatment at 300 °C for 0.5 h and 900 °C for 1 h in argon. The GN–MnO2 film was thus obtained.
10) and distilled water to neutralize. The concentration of the prepared graphene oxide solution was about 5 mg mL−1. Then, 20 mL of APS-modified MnO2 nanoparticle dispersion (0.5 mg mL−1) was added into 200 mL of GO suspension (0.2 mg mL−1) under mild mechanical stirring to render the sphere's surface positively charged. The solution was vacuum filtered to obtain the GO–MnO2 film. The GO–MnO2 film was hot pressed at 150 °C for 5 h, followed by thermal treatment at 300 °C for 0.5 h and 900 °C for 1 h in argon. The GN–MnO2 film was thus obtained.
For comparison, GN film was prepared using the same method without MnO2 nanoparticles. The traditional MnO2 slurry working electrode for supercapacitors was prepared by mixing the MnO2 nanoparticles active material (80 wt%) with carbon black (10 wt%) and PTFE (10 wt%) in isopropanol. The slurry of the mixture was rolled to a thickness of ∼100 mm on copper foil and left to dry in an oven at 80 °C for 24 h. Then, the film was cut into a suitable shape. This traditional electrode was named MnO2 slurry.
2.3 Fabrication of flexible all-solid-state supercapacitors
All-solid-state symmetric supercapacitors were assembled with poly(vinyl alcohol) (PVA)/Na2SO4 serving as the separator and electrolyte between two GN–MnO2 films facing each other with copper tape adhered to one edge of the device by silver plastic to improve the electrical contact. The solid gel electrolyte was prepared as follows: 2 g of Na2SO4 and 3 g of PVA powder were dissolved in 60 mL of deionized water with vigorous stirring at 90 °C until it became clear and transparent. In order to eliminate bubbles generated during the dissolution, the solution was stirred slowly for 2 h at room temperature until no precipitation was apparent. Subsequently, both GN–MnO2 film electrodes were soaked in PVA/Na2SO4 gel electrolyte for 5 min and then allowed to solidify at 50 °C for 10 min. Finally, the device was successfully prepared by assembling two electrodes together and leaving overnight until the electrolyte was solidified. The GN film and MnO2 slurry electrode-based ASSSs devices were prepared with the same process.2.4 Material characterizations
The sample morphology was assessed using an FEI Nova NanoSEM 450 field emission scanning electron microscopy (SEM). Raman spectra were collected using a confocal Lab RAM HR800 spectrometer (Horiba JobinYvon, FR). X-ray photoelectron spectroscopy (XPS) analyses were carried out and atomic percentages were collected on an XPS spectrometer (PHI-1800, Japan) with Al Kα radiation (λ = 8.34 Å) as the excitation source. The binding energy was calibrated using the C 1s photoelectron peak at 284.6 eV as the reference.An FLIR T335 infrared camera was further used to record the thermal transport performances of the GN–MnO2 film, GN film and MnO2 slurry, and the temperature profiles at the length-line of the samples were calculated by the FLIR quick plot reporter. In the experiments, both top and bottom surfaces attached to the heat source were coated with a thin layer of thermal grease to reduce interface resistance and ensure the same temperature for the samples. The electrical properties of the graphene paper were measured by a four-probe method with an Agilent semiconductor parameter analyzer B1500A.
The thermal diffusivity coefficient (D) of the GN–MnO2 film was measured by laser flash thermal analyzer (LFA467/2-2 lnSb NanoFlash). The specific heat (Cp) of the GN–MnO2 film was measured by differential scanning calorimeter (DSC, 200F3). The density (ρ) was calculated according to the formula ρ = m/V. A 25.4 mm diameter film disk was punched out for the in-plane thermal diffusivity measurement. The thickness (h) of the GN–MnO2 film was measured with SEM. The volume (V) was obtained according to the formula V = πr2h = 3.14 × 12.72 × h = 506.45 × h. The thermal conductivity (λ) was calculated from λ = DCpρ.
2.5 Electrochemical measurements
All the electrochemical measurements, including CV measurements, galvanostatic charge/discharge and EIS tests with a frequency loop from 100 kHz to 10 mHz at the amplitude of the sinusoidal voltage of 10 mV, were carried out on an electrochemical workstation (Zennium Zahner, Germany). The specific capacitance can be calculated using the formula: Cm = (IΔt)/(mΔV), where Cm (F g−1) is the specific capacitance of the electrode, I (A) is the charge/discharge current, Δt (s) is the discharge time, ΔV (V) is the potential window and m (g) is the mass of the active materials.3. Results and discussion
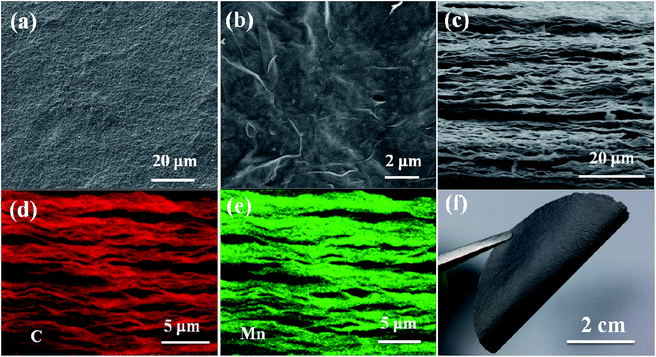
GN–MnO2 film electrodes were fabricated by thermal annealing of graphene oxide–MnO2 (GO–MnO2) films obtained through vacuum filtration of an MnO2@GO suspension. The preparation and morphology of the MnO2 nanoparticles and MnO2@GO are shown in Fig. S1 and S2.† The morphology and microstructure of the GN–MnO2 film were observed by SEM, as shown in Fig. 1. The surface of the GN–MnO2 film is flat and slightly wrinkled, with no large bulges or depressions. There are some small spots distributed on the surface, which indicates the existence of MnO2 nanoparticles (Fig. 1a and b). Fig. 1f shows that the GN–MnO2 film could be easily bent by 180° without destruction, indicating its excellent flexibility. The good mechanical properties of the GN–MnO2 film might be attributed to the restoration of graphene sheets with the elimination of oxygen groups, decreased interlayer spacing and enhanced interlayer contact during thermal annealing.23,24 The excellent flexibility could be beneficial for applications in flexible devices. The cross-sectional images of the GN–MnO2 film are shown in Fig. 1c. The fracture edges of the film reveal a well-aligned layer-by-layer nanostructure of the graphene sheets, which is similar to the structure of pure GN film, shown in Fig. S3.† The close contact between the aligned graphene layers could minimize the barrier for phonon and electron transfer, thereby improving the thermal and electrical properties.25,26 The cross-sectional image also displays that MnO2 nanoparticles are interspersed into the interlayers of the graphene sheets and in return graphene layers are obviously distinguished from MnO2 nanoparticles disrupting the layer continuity. In addition, graphene nanosheets and MnO2 nanoparticles were well linked together, MnO2 nanoparticles were embedded in graphene matrix structure, and in return the existence of graphene nanosheets decreased the agglomeration of MnO2 nanoparticles.27,28 The energy dispersive X-ray spectroscopy (EDS) mappings of the cross section of GN–MnO2 film also confirmed that the C and Mn elements distributed over the entire section (Fig. 1d and e). In addition, the EDS mapping of Mn element and the corresponding map sum spectrum for the surface and bottom side of GN–MnO2 film were also investigated. As shown in Fig. S4,† the distribution and content of Mn were similar at 51.2 wt% for the surface and 53.2 wt% for the bottom side, which is consistent with that of the cross section.The as-prepared GN–MnO2 films and GN films were further characterized by Raman and X-ray photoelectron spectroscopy (XPS). Two obvious peaks are observed in the Raman spectra for both GN and GN–MnO2 film: the D band at ∼1361 cm−1 corresponds to sp3 defects, which might be favorable to prove its hydrophilicity and increase the interactions between MnO2 and the substrates, and the G band around ∼1580 cm−1 corresponds to the phonon mode in-plane vibration of sp2 carbon atoms, which indicates the quality of the graphene (Fig. 2a).29,30 Furthermore, the ID/IG ratio of the GN–MnO2 film (∼1.03) is similar to that of the GN film (∼1.02), indicating that the introduction of MnO2 nanoparticles had no effects on the structure of the GN film substrate and the good conductivity could be well maintained.31,32 It is worth mentioning that, for GN–MnO2 film, additional peaks at ∼560 cm−1 exist, which could be assigned to Mn–O vibrations (Ag) perpendicular to the direction of the MnO6 octahedral double chains of MnO2, providing further evidence for the presence of MnO2.33
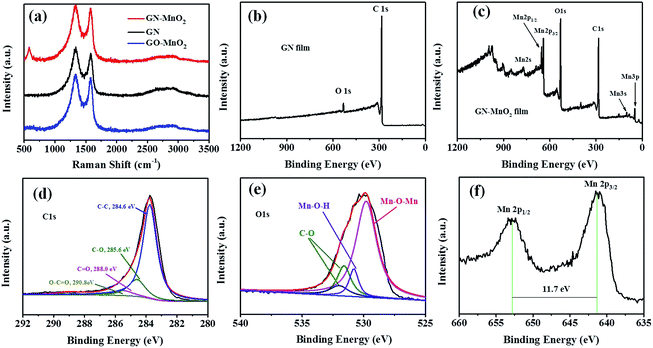 | ||
| Fig. 2 (a) Raman patterns of GN film, GO–MnO2 and GN–MnO2 film, full-survey-scan XPS spectra of (b) GN film and (c) GN–MnO2 film, and high-resolution XPS spectra of (d) C 1s, (e) O 1s and (f) Mn 2p. | ||
Moreover, the XPS survey spectrum of the GN–MnO2 composite also confirmed the presence of Mn, C and O elements (Fig. 2c) compared to the XPS survey of the bare GN film (Fig. 2b). Among them, the element of C (Fig. 2d) should come from the graphene substrate, disclosing the presence of 6.02 atom% of C–OH (285.6 eV), 0.64 atom% of C![[double bond, length as m-dash]](https://www.rsc.org/images/entities/char_e001.gif) O (288.0 eV) and 1.89 atom% of O
O (288.0 eV) and 1.89 atom% of O![[double bond, length as m-dash]](https://www.rsc.org/images/entities/char_e001.gif) C–O (290.8 eV) functional groups; the C
C–O (290.8 eV) functional groups; the C![[double bond, length as m-dash]](https://www.rsc.org/images/entities/char_e001.gif) C compound has a dominant presence of about 91.45%, suggesting a C/O ratio of 10.2. In addition, the O 1s spectrum was also analyzed. In Fig. 2e, three peaks appearing at 529.7, 531.2, and 532.5 eV were assigned to anhydrous manganese oxides (Mn–O–Mn), hydrated manganese oxides (Mn–O–H), and residual structure water (H–O–H), respectively. Based on the analysis of the O 1s XPS spectrum, the valence of Mn was estimated to be 3.7, which is in good agreement with the result of the Mn 3s spectrum. The Mn 2p XPS spectrum (Fig. 2f) shows two signals at 644.8 eV and 656.6 eV with a spin energy separation of 11.7 eV, indicating that the predominant Mn oxidation state was a valence state of t4.33,34 All the above results demonstrate that MnO2 nanoparticles have been successfully combined with GN film to form a uniform GN–MnO2 film. The XPS results also show that the MnO2 content of the GN–MnO2 film is about 51.2 wt%.
C compound has a dominant presence of about 91.45%, suggesting a C/O ratio of 10.2. In addition, the O 1s spectrum was also analyzed. In Fig. 2e, three peaks appearing at 529.7, 531.2, and 532.5 eV were assigned to anhydrous manganese oxides (Mn–O–Mn), hydrated manganese oxides (Mn–O–H), and residual structure water (H–O–H), respectively. Based on the analysis of the O 1s XPS spectrum, the valence of Mn was estimated to be 3.7, which is in good agreement with the result of the Mn 3s spectrum. The Mn 2p XPS spectrum (Fig. 2f) shows two signals at 644.8 eV and 656.6 eV with a spin energy separation of 11.7 eV, indicating that the predominant Mn oxidation state was a valence state of t4.33,34 All the above results demonstrate that MnO2 nanoparticles have been successfully combined with GN film to form a uniform GN–MnO2 film. The XPS results also show that the MnO2 content of the GN–MnO2 film is about 51.2 wt%.
The thermal conductivity of the film electrodes was determined using laser flash techniques. A traditional slurry electrode was also fabricated by coating a mixed slurry of MnO2 powders, polymer PVDF binder and carbon black conductive agents onto a copper foil current collector (MnO2 slurry) for comparison of the thermal conductivity. Fig. 3a lists the thermal conductivity of the examined electrodes. The polymer- and carbon black-free GN film and GN–MnO2 film electrodes with an excellent graphene nanosheets layer-by-layer arrayed structure demonstrate significantly higher thermal conductivity of 796.3 and 613.5 W m−1 K−1 compared to the thermal conductivity of 1.1 W m−1 K−1 of the MnO2 slurry electrode with polymer binder and carbon black. The introduction of MnO2 nanoparticles reduced the thermal conductivity of the GN film to a certain degree, due to the bad thermal conductivity of MnO2.35 However, the graphene nanosheets form thermally conductive network channels, which guarantee the high thermal conductivity of the GN–MnO2 film. From the point view of the MnO2 slurry, the traditional MnO2 slurry-formed electrode could not easily achieve high thermal conductivity owing to the existence of a low thermally conductive polymer binder PVDF, carbon black conductive agent, and the absence of an aligned structure. The thermal transport performances of the GN film, the GN–MnO2 film and the traditional MnO2 slurry were also compared by keeping one side of the sample bars on the same temperature area of the hot plate and then measuring the temperature distribution along the bars with an infrared camera (Fig. 3b). The heat transfer was much faster in the GN film and GN–MnO2 film than that in the traditional MnO2 slurry. This means that the GN–MnO2 film could dissipate the heat better than the traditional MnO2 slurry, indicating that the highly thermally conductive electrodes can efficiently dissipate the heat produced in the charge and discharge processes in energy devices such as supercapacitors and batteries. This is very important for the safety of energy devices.
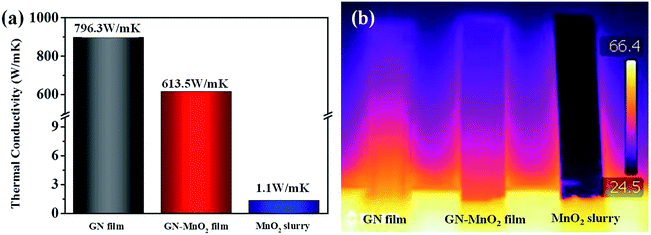 | ||
| Fig. 3 (a) Histogram of in-plane thermal conductivity and (b) infrared thermal imaging attached to the 70 °C heating source (units: °C) for the GN film, GN–MnO2 film and MnO2 slurry samples. | ||
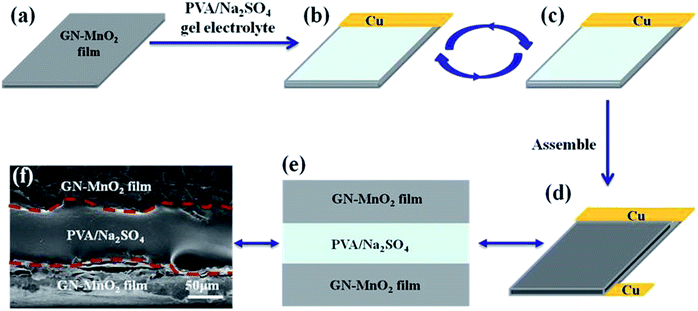
The schematic illustration in Fig. 4 displays the fabrication of flexible solid state supercapacitors with GN–MnO2 films as electrodes and poly(vinyl alcohol)/Na2SO4 (PVA/Na2SO4) as the gel electrolyte. The use of a gel electrolyte avoids harmful leakage of liquid electrolyte and additional binding materials. To guarantee the conductivity between the two GN–MnO2 film electrodes, the PVA/Na2SO4 gel electrolyte is sandwiched between two *as-prepared GN–MnO2 films. The copper tapes are adhered by silver plastic to one edge of each GN–MnO2 film to enhance the conductivity of the contact sides when testing electrochemical properties.36 The whole assembly process was carried out under ambient conditions. Fig. 4f clearly demonstrates that there is indeed a sandwich structure between the two GN–MnO2 film electrodes and the gel electrolyte, and the interfaces are distinct, which indicates the successful fabrication of the flexible solid state supercapacitors.
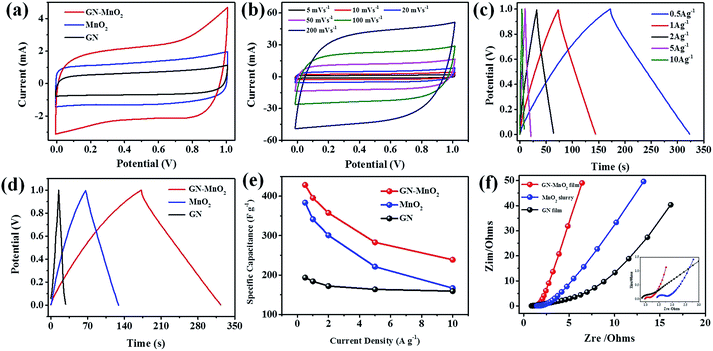
The electrochemical performance of the GN–MnO2 supercapacitors was first evaluated by cyclic voltammetry (CV). Fig. 5a shows the CV curves of the GN–MnO2 film, GN film and MnO2 slurry composites at a scan rate of 5 mV s−1 in PVA/Na2SO4 gel electrolyte. Compared to that of the GN film, the CV curves of the pure MnO2 slurry and the GN–MnO2 are relatively rectangular in shape without obvious redox peaks and exhibit near mirror-image current response on voltage reversal, meaning they have ideal capacitive behaviour. In addition, the introduction of graphene results in the integral area of the GN–MnO2 film electrode being much larger than that of the MnO2 slurry electrode. The GN–MnO2 film electrode retains a relatively rectangular shape in the scan rate range from 5 to 200 mV s−1, demonstrating excellent high-rate performance (Fig. 5b). Galvanostatic charging/discharging (GCD) measurements were performed at various current densities from 0.5 to 10 A g−1. As shown in Fig. 5c, all the curves were highly linear and symmetrical with a slight curvature at various current densities, indicating the pseudocapacitive contribution along with the double layer contribution and excellent electrochemical reversibility and charge–discharge properties.37 Moreover, the IR drops on all curves were similar and not obvious, even at 10 A g−1, indicating little overall resistance and excellent capacitive properties of this hybrid material of GN and MnO2. The GCD of the GN film and MnO2 slurry electrodes at a current density of 0.5 A g−1 was also carried out between 0 to 1.0 V in PVA/Na2SO4 gel electrolyte (Fig. 5d). On the basis of the charge/discharge curve, the specific capacitance (Cs) can be calculated using the equation:38,39
The electrochemical impedance spectroscopy (EIS) of the GN–MnO2 film, GN film and MnO2 slurry-based solid state supercapacitors was carried out in a frequency range from 100 kHz to 100 mHz at open circuit potential with an AC perturbation of 5 mV; the Nyquist plots are shown in Fig. 5f. The impedance spectra are almost similar in form with an arc in the higher frequency region and a spike in the lower frequency region, indicating nearly ideal capacitive behaviour.41,42 The Nyquist plots of the GN–MnO2 film electrode are located between those of the MnO2 slurry and GN film electrodes, supporting the existence of a synergistic effect between MnO2 nanoparticles and graphene nanosheets. At very high frequencies, the intercept at the real part (Zim) represents a combination of the ionic resistance of the electrolyte, the intrinsic resistance of substrate, and the contact resistance at the active material/current collector interface (Re). The Re can be calculated by extrapolation of the semicircle on the real impedance axis to be about 0.5, 0.9 and 1.4 Ω for the GN film, GN–MnO2 film and MnO2 slurry electrodes, respectively. The Re of the GN–MnO2 film electrode is larger than that of GN film electrode while smaller than that of the MnO2 slurry, suggesting that the ion conductivity of the GN–MnO2 film electrode is improved by the addition graphene nanosheets to MnO2 nanoparticles. The diameter of the high-frequency arc reflects the charge transfer resistance (Rct), which is caused by the faradaic reactions and the double-layer capacitance on the grain surface; the result was consistent with the Re. In other words, it is confirmed that the charge transfer reaction in the GN–MnO2 film obtained by the typical filtration-directed self-assembly method is faster, which is ascribed to the layered structure for providing the electrolyte transport channel and preventing the aggregation of graphene nanosheets and MnO2 nanoparticles.
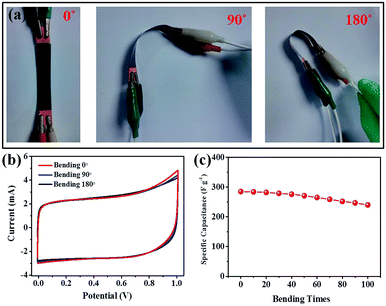
Flexibility and a variable working window are crucial for modern portable and wearable energy storage devices. Therefore, the CV curves for the GN–MnO2 film-based solid state supercapacitors were used to study the aforementioned requirement. As shown in Fig. 6, almost the same capacitive behaviour was observed at different bending angles of 0°, 90° and 180°, and a slight decrease was seen with increasing bending time at a current density of 0.5 A g−1, demonstrating the excellent flexibility and stability of the devices.43,44
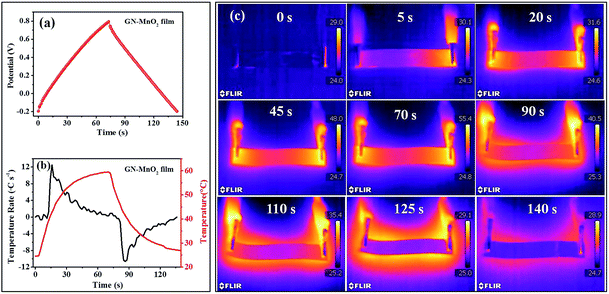
To investigate the heat dissipation ability, an infrared thermal imager was used to record the temperature changes of the GN–MnO2 film solid state supercapacitor during the charging and discharging processes. Fig. 7a shows one cycle of a GCD curve of the GN–MnO2 film solid state supercapacitor at a current density of 1 A g−1. Fig. 7b shows the temperature change (red line) and heating/cooling rate by integrating the temperature changes (black line) during this process. Fig. 7c displays infrared thermal images obtained at different times from 0 to 140 s. As shown in Fig. 7b, during the start of the charging stage the temperature increases very quickly, reaching a rate of 12.6 °C s−1, then the rate of increase tends to slow and become steady until the temperature reaches the peak of 55.4 °C, which takes about 70 s. The infrared thermal images recorded the charging process at 0, 5, 20, 45 and 70 s. At 0 s the charging had not started so there was no thermal generation, then with the extension of the charging time the GN–MnO2 film solid state capacitor tends to get brighter in the infrared thermal imager, suggesting that the temperature is increasing, resulting from the accumulation of more and more heat. The GN–MnO2 film supercapacitors begin to discharge when the set maximum voltage of 1.0 V is reached. During the initial stage of discharging the temperature drops sharply: the cooling rate could reach 11.8 °C s−1. After the peak, the cooling rate also tends to slow until reaching room temperature. During the discharging process, an important and interesting phenomenon could be observed; taking the infrared thermal image at 90 s as an example, the image vividly shows that the device itself indicates a dark background while the surrounding of the device is brighter, forming a dark inside and luminous outside in contrasting scenes. It suggests that the temperature of the electrode is much lower than that of the surroundings. The heat is removed to the surroundings but gathers around the device owing to the low thermal conductivity of air (∼0.02 W m−1 K−1).12,45 As electrodes for solid state supercapacitors, the GN–MnO2 film electrode could effectively dissipate the heat generated during the charge/discharge process owing to its high thermal conductivity.
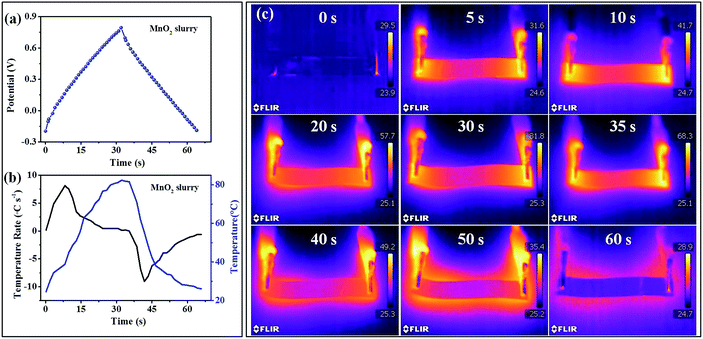
To illustrate the advantages of the GN–MnO2 film with high thermal conductivity, a comparison of a traditional MnO2 slurry electrode supercapacitor under the same conditions was done. Fig. 8a shows one cycle GCD curve of the MnO2 slurry electrode supercapacitor. The time-dependent temperature profile (blue line) and temperature rate (black line) display that the MnO2 slurry electrode has a relatively slow rate of increase with a maximum value of 8.1 °C s−1, which is much slower than that of the GN–MnO2 film electrode (11.8 °C s−1) (Fig. 8b and c). While the temperature continued to rise until the peak of 81.8 °C, it is much higher than the 55.4 °C for the GN–MnO2 film supercapacitor. When discharging, the cooling rate of the device is also slower than that of the GN–MnO2 film supercapacitor. This sharp contrast shows that the low thermal conductive (1.1 W m−1 K−1) traditional MnO2 slurry electrode supercapacitor could not dissipate the heat as effectively as the highly thermal GN–MnO2 film electrode supercapacitor.
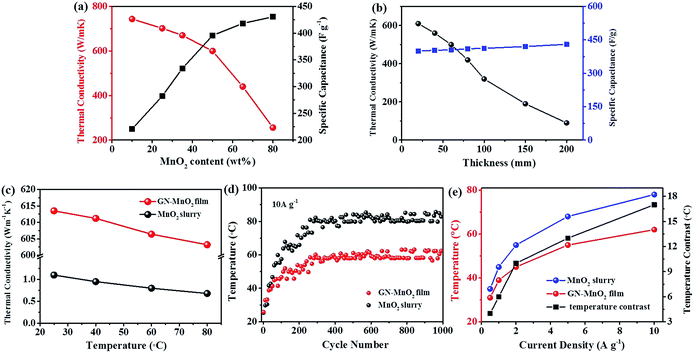
To investigate the different MnO2 loading content for potential practical applications, graphene film decorated with 10, 25, 35, 50, 65 and 80 wt% MnO2 nanoparticles was also filtered to fabricate film electrodes. The thermal conductivity was 743.5, 701.8, 670.2, 613.5, 442.6, and 256.7 W m−1 K−1, and the specific capacitance at a current density of 1 A g−1 was 220.7, 282.4, 334.2, 395.7, 418.3 and 430.6 F g−1 for the GN–MnO2 films with contents of 10, 25, 35, 50, 65 and 80 wt% MnO2, respectively. The mechanical behaviour dropped dramatically from 2.9 GPa to 0.5 GPa as the content of MnO2 increased (Table 1). MnO2 is a typical metal oxide with low thermal and electrical conductivity so with the increasing content of MnO2 the thermal conductivity of the GN–MnO2 film rapidly reduced, which is clearly shown in Fig. 9a. In terms of electrochemical performance, the active material of MnO2 nanoparticles play the main role in the GN–MnO2 film's electrochemical capacity, so the higher the content of MnO2 the higher the capacity. However, there is a conflicting conclusion that the more the MnO2 content, the lower the thermal conductivity of GN–MnO2. There is also an obvious inflection point in Fig. 9a: the thermal conductivity reduces gently as the MnO2 content is less than 50 wt% and decreases sharply after 50 wt% MnO2 content, while for the capacity it shows the opposite trend. Considering the two factors, maintaining high capacity while providing high thermal conductivity, the 50 wt% MnO2 content GN–MnO2 film electrode was chosen for the supercapacitors.
| MnO2 content (wt%) | 10 | 25 | 35 | 50 | 65 | 80 |
|---|---|---|---|---|---|---|
| Young's modulus (GPa) | 2.9 | 2.4 | 1.8 | 1.3 | 0.8 | 0.5 |
| Thermal conductivity (W m−1 K−1) | 743.5 | 701.8 | 670.2 | 613.5 | 442.6 | 256.7 |
| Specific capacitance at 1 A g−1 (F g−1) | 220.7 | 282.4 | 334.2 | 395.7 | 418.3 | 430.6 |
We also investigated several GN–MnO2 film samples with different thicknesses of 20, 40, 60, 80, 100, 150 and 200 μm in terms of thermal conductivity and specific capacitance. As shown in Fig. 9b, with increasing thickness the thermal conductivity dropped dramatically, while the specific capacitance stayed at almost the same level, which indicates that the thickness of the film greatly affects the heat dissipation but has no obvious effect on the specific capacitance. Therefore, in order to investigate the good heat dissipation of GN–MnO2 as electrode, we chose 20 μm film thickness as the research target in the manuscript.
The thermal conductivity of the GN–MnO2 film and MnO2 slurry were measured at different temperatures, as shown in Fig. 9c. The thermal conductivity decreases slightly with increasing temperature; this slight change does not produce uncontrollable changes in heat conduction, so it could be considered within the scope of the deviation. Fig. 9d shows the temperature changes of the GN–MnO2 film and MnO2 slurry-based ASSSs with charge–discharge cycling at a high current density of 10 A g−1. The temperature continues to rise at the beginning of the cycles until it reaches a steady level. For GN–MnO2 film electrode supercapacitor, the temperature reaches a steady level of about 62.6 °C after 250 cycles, while for the MnO2 slurry electrode, the temperature achieves a stable value of about 80.9 °C after 310 cycles. The high thermal conductivity GN–MnO2 film electrode supercapacitor reaches a stable temperature first and the temperature of 18 °C is relatively lower than that of the MnO2 slurry electrode supercapacitor. Fig. 9e shows the stable state temperature at each different current density. The stable temperature was 31.2, 39.4, 45.1, 55.7 and 62.6 °C for the GN–MnO2 film supercapacitors, and 35.7, 46.3, 56.1, 68.5, and 80.9 °C for the MnO2 slurry supercapacitors at current densities of 0.5, 1, 2, 5 and 10 A g−1, respectively. The temperature of the GN–MnO2 film electrode supercapacitor was much lower than that of MnO2 slurry electrode supercapacitor at all stages. With the increasing of the current density from 0.5 to 10 A g−1, the temperature contrast of GN–MnO2 film and MnO2 slurry also increases, indicating that the GN–MnO2 film electrode supercapacitors exhibit better heat dissipation ability than the traditional slurry electrode supercapacitors, especially at higher current density and power density. The most competitive advantages of supercapacitors are the extremely high current density and power density. Thus, the high thermal conductivity and heat dissipation ability are very important for supercapacitors.
4. Conclusions
GN–MnO2 film electrodes were prepared by vacuum filtration of GO–MnO2 solution and then thermal treatment. The GN–MnO2 film electrodes demonstrate high thermal conductivity of 613.5 W m−1 K−1 compared to the thermal conductivity of 1.1 W m−1 K−1 of the traditional polymer binder and carbon black with MnO2 slurry electrodes. The GN–MnO2 film electrodes exhibit good cycling performance and excellent rate capacity for a high specific capacity of about 218.8 F g−1 at a high current density of 10 A g−1. Furthermore, GN–MnO2 film electrode-based flexible solid state supercapacitors display excellent heat dissipation ability during charging and discharging processes, which is beneficial for the thermal management of supercapacitor devices.Conflicts of interest
There are no conflicts to declare.Acknowledgements
This work was financially supported by the National Key R&D Project from the Minister of Science and Technology of China (2016YFA0202702), the National Natural Science Foundation of China (No. 21203236), Guangdong Provincial Key Laboratory (2014B030301014), Shenzhen Peacock Plan (KQCX2015033117354154) and Shenzhen basic research plan (JCYJ20160229195455154).References
- I. Gur, K. Sawyer and R. Prasher, Science, 2012, 335, 1454–1455 CrossRef PubMed.
- B. Koo, P. Goli, A. V. Sumant, P. C. dos Santos Claro, T. Rajh, C. S. Johnson, A. A. Balandin and E. V. Shevchenko, ACS Nano, 2014, 8, 7202–7207 CrossRef CAS PubMed.
- M. S. Wu, K. H. Liu, Y. Y. Wang and C. C. Wan, J. Power Sources, 2002, 109, 160–166 CrossRef CAS.
- B. Zhao, L. Jiang, X. Zeng, K. Zhang, M. M. F. Yuen, J. B. Xu, X. Z. Fu, R. Sun and C. P. Wong, J. Mater. Chem. A, 2016, 4, 14595–14604 CAS.
- X. M. Xu and R. He, J. Power Sources, 2013, 240, 33–41 CrossRef CAS.
- H. Y. Hwang, Y. S. Chen and J. S. Chen, Adv. Mech. Eng., 2015, 7, 204131 CrossRef.
- Y. Zhang, G. Zhang, W. Wu and W. Liang, Heat Mass Transfer, 2014, 50, 887–893 CrossRef CAS.
- F. Falakzaadeh and R. Mehryar, J. Electron. Mater., 2017, 46, 64–72 CrossRef CAS.
- R. Zhao, S. Zhang, J. Liu and J. Gu, J. Power Sources, 2015, 299, 557–577 CrossRef CAS.
- J. Schleeh, J. Mateos, I. Iniguez-de-la-Torre, N. Wadefalk, P. A. Nilsson, J. Grahn and A. J. Minnich, Nat. Mater., 2015, 14, 187–192 CrossRef CAS PubMed.
- H. Park, Nat. Mater., 2007, 6, 330–331 CrossRef CAS PubMed.
- M. Loeblein, S. H. Tsang, M. Pawlik, E. J. R. Phua, H. Yong, X. W. Zhang, C. L. Gan and E. H. T. Teo, ACS Nano, 2017, 11, 2033–2044 CrossRef CAS PubMed.
- K. Uetani, S. Ata, S. Tomonoh, T. Yamada, M. Yumura and K. Hata, Adv. Mater., 2014, 26, 5857–5862 CrossRef CAS PubMed.
- H. Wang, A. S. Tazebay, G. Yang, H. T. Lin, W. Choi and C. Yu, Carbon, 2016, 106, 152–157 CrossRef CAS.
- E. Kim, H. W. Shim, S. Unithrattil, Y. H. Kim, H. Choi, K.-J. Ahn, J. S. Kwak, S. Kim, H. Yoon and W. Bin Im, ACS Nano, 2016, 10, 238–245 CrossRef CAS PubMed.
- L. Fransson, T. Eriksson, K. Edström, T. Gustafsson and J. O. Thomas, J. Power Sources, 2001, 101, 1–9 CrossRef CAS.
- K. Hu and D. D. L. Chung, Carbon, 2011, 49, 1075–1086 CrossRef CAS.
- K. S. Novoselov, A. K. Geim, S. V. Morozov, D. Jiang, Y. Zhang, S. V. Dubonos, I. V. Grigorieva and A. A. Firsov, Science, 2004, 306, 666–669 CrossRef CAS PubMed.
- H. P. Cong, X. C. Ren, P. Wang and S. H. Yu, Energy Environ. Sci., 2013, 6, 1185–1191 CAS.
- J. D. Renteria, S. Ramirez, H. Malekpour, B. Alonso, A. Centeno, A. Zurutuza, A. I. Cocemasov, D. L. Nika and A. A. Balandin, Adv. Funct. Mater., 2015, 25, 4664–4672 CrossRef CAS.
- N. J. Song, C. M. Chen, C. Lu, Z. Liu, Q. Q. Kong and R. Cai, J. Mater. Chem. A, 2014, 2, 16563–16568 CAS.
- B. Xu, S. Yue, Z. Sui, X. Zhang, S. Hou, G. Cao and Y. Yang, Energy Environ. Sci., 2011, 4, 2826–2830 CAS.
- Y. Huang, H. Hu, Y. Huang, M. Zhu, W. Meng, C. Liu, Z. Pei, C. Hao, Z. Wang and C. Zhi, ACS Nano, 2015, 9, 4766–4775 CrossRef CAS PubMed.
- Y. Huang, M. Zhu, Z. Pei, Q. Xue, Y. Huang and C. Zhi, J. Mater. Chem. A, 2016, 4, 1290–1297 CAS.
- C.-H. Park, F. Giustino, M. L. Cohen and S. G. Louie, Nano Lett., 2008, 8, 4229–4233 CrossRef CAS PubMed.
- J. Shang, T. Yu, J. Lin and G. G. Gurzadyan, ACS Nano, 2011, 5, 3278–3283 CrossRef CAS PubMed.
- J. Ge, H. B. Yao, W. Hu, X. F. Yu, Y. X. Yan, L. B. Mao, H. H. Li, S.-S. Li and S. H. Yu, Nano Energy, 2013, 2, 505–513 CrossRef CAS.
- G. A. Ferrero, M. Sevilla and A. B. Fuertes, Sustainable Energy Fuels, 2017, 1, 127–137 CAS.
- H. Budde, N. Coca-Lopez, X. Shi, R. Ciesielski, A. Lombardo, D. Yoon, A. C. Ferrari and A. Hartschuh, ACS Nano, 2016, 10, 1756–1763 CrossRef CAS PubMed.
- H. Gao, F. Xiao, C. B. Ching and H. Duan, ACS Appl. Mater. Interfaces, 2012, 4, 7020–7026 CAS.
- J. Deng, L. Chen, Y. Sun, M. Ma and L. Fu, Carbon, 2015, 92, 177–184 CrossRef CAS.
- Z. Pan, Y. Qiu, J. Yang, F. Ye, Y. Xu, X. Zhang, M. Liu and Y. Zhang, Nano Energy, 2016, 26, 610–619 CrossRef CAS.
- N. Yu, H. Yin, W. Zhang, Y. Liu, Z. Tang and M.-Q. Zhu, Adv. Energy Mater., 2016, 6, 1501458 CrossRef.
- Y. Sun, Y. Cheng, K. He, A. Zhou and H. Duan, RSC Adv., 2015, 5, 10178–10186 RSC.
- R. R. Petersen, J. Konig and Y. Yue, J. Non-Cryst. Solids, 2015, 425, 74–82 CrossRef CAS.
- C. Hao, B. Yang, F. Wen, J. Xiang, L. Li, W. Wang, Z. Zeng, B. Xu, Z. Zhao, Z. Liu and Y. Tian, Adv. Mater., 2016, 28, 3194–3201 CrossRef CAS PubMed.
- Y. Sun, Z. Fang, C. Wang, K. R. R. M. Ariyawansha, A. Zhou and H. Duan, Nanoscale, 2015, 7, 7790–7801 RSC.
- Q. Wang, J. Yan and Z. Fan, Energy Environ. Sci., 2016, 9, 729–762 CAS.
- H. Lu and X. S. Zhao, Sustainable Energy Fuels, 2017, 1, 1265–1281 CAS.
- Z. Su, C. Yang, B. Xie, Z. Lin, Z. Zhang, J. Liu, B. Li, F. Kang and C. P. Wong, Energy Environ. Sci., 2014, 7, 2652–2659 CAS.
- S. Bach, J. P. Pereira-Ramos and P. Willmann, Electrochim. Acta, 2011, 56, 10016–10022 CrossRef CAS.
- E. Ferg, C. Rossouw and P. Loyson, J. Power Sources, 2013, 226, 299–305 CrossRef CAS.
- M. Yousaf, H. T. H. Shi, Y. Wang, Y. Chen, Z. Ma, A. Cao, H. E. Naguib and R. P. S. Han, Adv. Energy Mater., 2016, 6, 1600490 CrossRef.
- K. Jost, D. Stenger, C. R. Perez, J. K. McDonough, K. Lian, Y. Gogotsi and G. Dion, Energy Environ. Sci., 2013, 6, 2698–2705 CAS.
- D. Suh, C. M. Moon, D. Kim and S. Baik, Adv. Mater., 2016, 28, 7220–7227 CrossRef CAS PubMed.
Footnote |
| † Electronic supplementary information (ESI) available: The additional information including preparation of MnO2 nanoparticles and morphology characterizations, preparation of GN–MnO2 film and the digital image of the GN–MnO2 film, and different magnifications of GN film. The EDS mapping of Mn element and the corresponding map sum spectrum for the surface and bottom side of GN–MnO2 film. See DOI: 10.1039/c7se00399d |
| This journal is © The Royal Society of Chemistry 2017 |

