Continuous microfluidic synthesis of colloidal ultrasmall gold nanoparticles: in situ study of the early reaction stages and application for catalysis†
Ghazal
Tofighi
 a,
Henning
Lichtenberg
ab,
Jan
Pesek
a,
Thomas L.
Sheppard
a,
Henning
Lichtenberg
ab,
Jan
Pesek
a,
Thomas L.
Sheppard
 ab,
Wu
Wang
c,
Ludger
Schöttner
d,
Günter
Rinke
e,
Roland
Dittmeyer
e and
Jan-Dierk
Grunwaldt
 *ab
*ab
aInstitute for Chemical Technology and Polymer Chemistry (ITCP), Karlsruhe Institute of Technology (KIT), D-76131 Karlsruhe, Germany. E-mail: grunwaldt@kit.edu
bInstitute of Catalysis Research and Technology (IKFT), Karlsruhe Institute of Technology (KIT), D-76344 Eggenstein-Leopoldshafen, Germany
cInstitute of Nanotechnology (INT), Karlsruhe Institute of Technology (KIT), D-76344 Eggenstein-Leopoldshafen, Germany
dInstitute of Functional Interfaces (IFG), Karlsruhe Institute of Technology (KIT), D-76344 Eggenstein-Leopoldshafen, Germany
eInstitute for Micro Process Engineering (IMVT), Karlsruhe Institute of Technology (KIT), D-76344 Eggenstein-Leopoldshafen, Germany
First published on 13th September 2017
Abstract
A continuous microfluidic setup was developed to study colloidal synthesis of gold nanoparticles using tetrachloroauric acid as precursor, sodium borohydride as reducing agent and PVP as stabilizer. The setup consists of pressurized vessels that allow pulsation-free flow of reactants and a microfluidic chip with integrated micromixers essential for efficient mixing with small mixing time (2 ms) followed by a meandering microchannel. The microfluidic chip enables recording X-ray absorption spectra (XAS) in situ at different positions along the microchannel at high flow rates approaching turbulent mixing conditions and thus to correlate reaction time with changes in the nanoparticle structure. Significant contributions of oxidized gold could be observed after the first 6 ms of the reaction, whereas after 10 ms principally all gold appeared to be in a metallic state. The nanoparticles obtained were characterized ex situ by various complementary techniques. The resulting nanoparticles had average diameter of 1.0 nm and narrow size distributions compared with those produced in a batch reactor. Depositing the nanoparticles on TiO2 resulted in catalysts with two different Au loadings (0.7 and 1.7 wt% Au/TiO2) which exhibited good CO oxidation activity.
Introduction
For the design of highly efficient gold based catalysts and gas-sensors, colloidal gold nanoparticles (Au NPs) deposited on metal oxide supports are promising candidates.1–8 One of the most straightforward routes to Au NP formation is chemical reduction, in which the Au ions obtained from a precursor are reduced to metallic Au entities, which subsequently join together to form nuclei. Coalescence of nuclei results in nanoparticle formation.8–13 In early works, Tsubota et al.14 reported that about 5 nm large gold colloids were not active for CO oxidation, whereas smaller particles showed considerable activity. Grunwaldt et al.8 found that particles of 2 nm size prepared by tetrakis(hydroxymethyl)phosphonium chloride (THPC) in an alkaline solution and deposited on titania or zirconia were highly active for CO oxidation. Hence, simple methods for the preparation of ultrasmall (1–3 nm)15 Au NPs are of wide interest in the field of gold catalysis.For optimized rational design of nanostructured functional materials, it is particularly important to separate the nucleation and growth steps from each other in order to gain control over diffusive growth, and to tailor the particle size and shape as well as physical and chemical properties.16,17 Significant progress in this field resulted from interdisciplinary efforts of the reaction chemistry and chemical engineering community. In comparison to conventional continuous stirred batch reactors, production of nanoparticles in a continuous flow using microfluidic reactors has emerged as a promising method, offering several benefits such as fast mixing, easy process handling, high mass and heat transport and process parameters within a wide range of operating conditions.18–20 Microfluidic reactors also allow relatively simple application of spectroscopic or diffraction measurements, offering deeper insight into the different stages of NP formation, and control over the intermediate process occurring during synthesis.21–24 These benefits have stimulated increasing competition in the field of fabrication technology of microfluidic chips, e.g. with respect to design and selection of chip materials (such as silicon, glass and plastic), precise preparation of channel structures and surfaces, mass production, time and cost.25–27
In order to optimize NP synthesis in microfluidic reactors, the effects of different parameters (e.g. flow rate, concentration ratio of precursors, pH, etc.) on nanomaterial properties resulting from structure, particle size and size distribution, morphology and interparticle interactions should be closely investigated.15,28–31 This highlights the necessity for in situ and operando studies and the combination of complementary characterization techniques.22–24,32 In a recent work, in situ transmission electron microscopy (TEM) was applied to investigate the dynamics of the nucleation of Au nanoclusters from supersaturated aqueous solutions and Au3+ ions were reduced to Au0 by the high-energy electron beam instead of using a reducing agent. This method revealed that spinodal decomposition of the homogeneous Au solution (starting point at 3 s) formed a mixture of gold-rich and a gold-poor liquid phase at 9.2 s, which at 11.3 s turned into amorphous Au nanoclusters and finally into crystalline gold nuclei (at 15.4 s).33
The state of the art in time-resolved studies of Au NP nucleation and growth using reducing agents is structural characterization of the produced NPs by small angle X-ray scattering (SAXS) and X-ray absorption near edge structure (XANES) in a reaction time window down to 100 ms after mixing the reactants, as demonstrated by Abécassis et al.21,24 and Polte et al.9 in a stopped-flow and continuous flow, respectively. For the first time, Abécassis et al. investigated the formation of Au NPs in situ with SAXS and XANES with 100 ms time resolution. The Au NPs were produced during reduction of AuCl3 with tetrabutylammonium borohydride (TBAB) and didodecyldimethylammonium bromide (DDAB) as surfactant in toluene, with turbulent mixing and a stopped-flow setup. The XANES results indicated the presence of Au(I) at 104 ms after mixing which was gradually reduced to Au(0). Moreover, they showed that the kinetics of the reduction reaction strongly depend on the ligands and temperature.24 By recording SAXS data in an observation window from 100 ms to 136 s and XANES spectra recorded 200 ms after mixing the reactants, Polte et al.9 showed that reduction of the Au(III) precursor by NaBH4 was complete at some point below 200 ms in a continuous flow using a static mixer. These reports indicate the necessity of investigations with even better time resolution, which does not only require faster recording times but also efficient mixing in such a short time scale. Hence, this requires to bring knowledge from microfluidics and chemical engineering together with spectroscopic studies and application in catalysis.
This study describes experiments using a novel microfluidic device34 with efficient micromixers to achieve a small mixing time and specifically designed for preparing small colloidal noble metal particles and at the same time allowing in situ X-ray absorption spectroscopy (XAS) investigations of the early stages (2 to 20 ms) of fast reduction reactions. Here NaBH4 was used to synthesize ultrasmall Au NPs (1.0 ± 0.4 nm) stabilized with polyvinylpyrrolidone (PVP) under flow conditions approaching turbulent mixing and plug flow. The NPs produced in this study were further characterized by various techniques and subjected to CO oxidation tests to demonstrate their potential application in catalysis.
Materials and methods
Materials
Tetrachloroauric acid (HAuCl4·3H2O; ≥99.9% purity), sodium borohydride (NaBH4; 99.99% purity), polyvinylpyrrolidone (PVP; (C6H9ON)x with an average molecular weight of 40 kDa), tetrakis(hydroxymethyl)phosphonium chloride (THPC; 80% in H2O), sodium hydroxide (NaOH) and sulphuric acid (H2SO4; 95% solution) were received from Sigma-Aldrich and used without further purification. High surface area titania (CristalACTIV™, anatase; >99% purity; 370 m2 g−1 surface area) was used as support. The microchannel walls were coated with Ombrello, a commercially available water repellent received from Autoteilemann GmbH.Continuous microfluidic setup
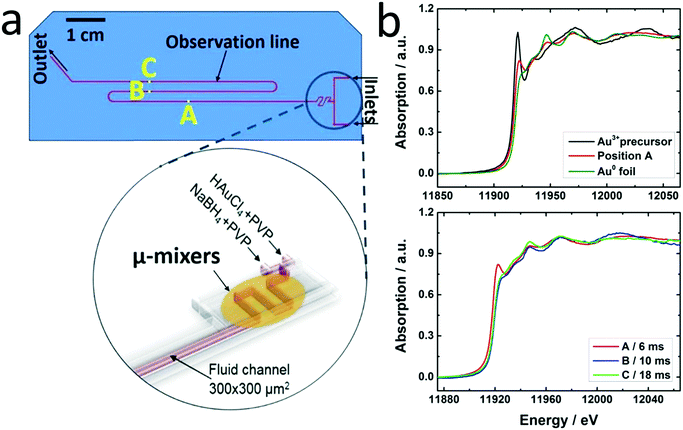
The principal setup is shown in Fig. 1 and 2. The reactants stored in ca. 4 L stainless steel corrosion-resistant vessels (polyethylene inner surface for gold vessel) were pressurized by N2 and delivered to the microfluidic chip. All chemicals involved were handled in a closed system and pumped from the source through the microreactor to the exhaust container in a controlled way. Separate flowmeters were used for gold precursor and reducing agent solution (ENDRESS+HAUSER promag H with polyvinylidene fluoride inert parts and promass A models) to avoid decomposition of the precursors prior to entering the microreactor. Needle valves (IDEX and Swagelok) allowed for precise adjustment of each reactant flow individually. For safety, a fast shut down control system was installed and the entire setup housed in poly (methyl methacrylate) (PMMA). The microfluidic reactor was fabricated in collaboration with GeSiM GmbH and the Institute of Semiconductors and Microsystems at Technische Universität Dresden (IHM TUD). It is made of Si-bonded glass and was specifically designed for X-ray based in situ characterization using spectroscopic and scattering techniques. It consists of 3 cyclone micromixers (based on a concept developed in collaboration between KIT-ITCP and KIT-IMVT)35 followed by a meandering microchannel (300 × 300 μm2) serving as the observation line. In the observation area, the thickness of the chip was reduced to 800 μm by Si etching (300 μm Si, 300 μm fluid channel and 200 μm glass) for X-ray-based experiments. The fluid delivery rack and the microfluidic chip can be used up to a pressure of 15 bars. This allows monitoring the Au NP formation using a total flow rate of 2.6 L h−1 after about 2 ms dead time due to the mixing (cf. ESI†).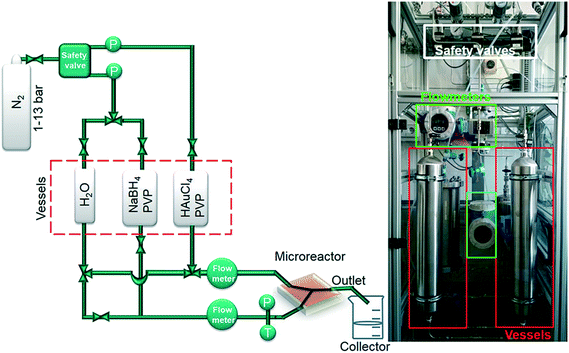 | ||
| Fig. 1 Schematic of microfluidic setup for fast continuous flow synthesis of PVP-stabilized Au NPs (P: pressure transducer, T: temperature sensor). | ||
Prior to NP synthesis experiments, the microreactor channel walls were coated with Ombrello, which was injected by syringe tubing into the inlets of the microfluidic chip after it was treated in an oxygen plasma chamber36 (50% power, 0.2 mbar and 2 min). In the next step, the chip was baked at 65 °C for 20 min. This well-established method was performed to minimize Au deposition by electrostatically repelling the PVP-stabilized Au NPs from the hydrophobic channel surfaces.37
Microfluidic synthesis of Au:PVP NPs reduced by NaBH4
The preparation procedure of reactant solutions was adopted from Tsunoyama et al.,29 however, the concentration of reactant solutions was optimized for this specific microreactor with defined flow rates. 1.8 g Au precursor and 0.85 g NaBH4 were dissolved separately each in 750 mL distilled water. To each of these two solutions 10 g PVP was added as stabilizer. Gold precursor and reducing agent solutions were poured into separate vessels (Fig. 1). Nitrogen pressure of ca. 13 bar was used to push the reactant solutions in the channels to achieve a total flow rate of 2.6 L h−1. The products were collected in a stirred round-bottom flask, which was placed in an ice/water bath. The microfluidic chip was flushed first with aqua regia and then with water before each synthesis.Batch synthesis of Au NPs reduced by NaBH4 and THPC/NaOH
The same ratio of Au![[thin space (1/6-em)]](https://www.rsc.org/images/entities/char_2009.gif) :
:![[thin space (1/6-em)]](https://www.rsc.org/images/entities/char_2009.gif) NaBH4 used for the microfluidic synthesis of NPs was applied for batch synthesis, i.e. 59.3 mg gold precursor and 333.3 mg PVP were dissolved in 120 mL distilled water. 28.3 mg NaBH4 and 333.3 mg PVP were dissolved in 30 mL distilled water and added to gold precursor solution being stirred rapidly at room temperature. The fast reduction reaction was observed through a color change from light yellow to dark brown.
NaBH4 used for the microfluidic synthesis of NPs was applied for batch synthesis, i.e. 59.3 mg gold precursor and 333.3 mg PVP were dissolved in 120 mL distilled water. 28.3 mg NaBH4 and 333.3 mg PVP were dissolved in 30 mL distilled water and added to gold precursor solution being stirred rapidly at room temperature. The fast reduction reaction was observed through a color change from light yellow to dark brown.
As a second method, a procedure was adopted from Duff et al.38 The reducing agent THPC is a short-chain compound which acts both as a reductant and an ionic stabilizer in aqueous solutions.39 First 1.5 mL of sodium hydroxide (0.2 M) was added to 46 mL of distilled water, while mixing in a round-bottom flask on top of a magnetic stirrer running at 500 rpm. 1.2 mL of 80% THPC was diluted in distilled water to 100 mL. Then 1.0 mL of this diluted THPC was added to the NaOH solution. After 2 min of stirring, 1.2 mL of 43 mM gold precursor was added to the solution and a fast reaction was observed through a color change from light yellow to dark brown.
Immobilization of Au NPs on TiO2
For immobilizing the Au NPs on titania support, the PVP-stabilized Au NP solution produced in the microreactor was added to a suspension of 1 g titania in 80 mL water acidified with 6 mL H2SO4 solution (0.2 M) while stirring at room temperature. After adsorption of the gold colloids on the support, the suspension was centrifuged three times (4500 rpm, 10 min each) and washed with water. Subsequently, the material was dried at 70 °C overnight. A sample of this material was calcined at 300 °C for 90 min, while the remaining material was directly characterized and used for CO oxidation tests (uncalcined samples). This method was used to prepare catalytic materials with different Au loading (0.7 and 1.7 wt%) on TiO2.Characterization of Au nanoparticles and solid materials
![[thin space (1/6-em)]](https://www.rsc.org/images/entities/char_2009.gif) 919 eV) were recorded at room temperature in fluorescence mode at SuperXAS beamline of the Swiss Light Source (SLS) synchrotron radiation source (electron energy 2.4 GeV) using a Si (111) double-crystal monochromator (focused beamsize: 150 × 100 μm2) and a 5 element SDD detector (SGX Sensortech). A single spectrum was acquired from 11.81 to 12.08 keV every 4 min. The data were analyzed using the Athena interface of the IFEFFIT software package.40
919 eV) were recorded at room temperature in fluorescence mode at SuperXAS beamline of the Swiss Light Source (SLS) synchrotron radiation source (electron energy 2.4 GeV) using a Si (111) double-crystal monochromator (focused beamsize: 150 × 100 μm2) and a 5 element SDD detector (SGX Sensortech). A single spectrum was acquired from 11.81 to 12.08 keV every 4 min. The data were analyzed using the Athena interface of the IFEFFIT software package.40
![[thin space (1/6-em)]](https://www.rsc.org/images/entities/char_2009.gif) 000 h−1, CO feed rate: 5.1 × 10⁻⁷ mol s−1 gcat−1). The gas mixture contained 1000 ppm CO and 1000 ppm O2 diluted with nitrogen and dried by a cold trap (dry ice/isopropanol). Reaction products were analyzed using a URAS 26 CO/CO2 analyzer. Prior to the testing, catalysts were dried in N2 flow for 2 h to remove water.
000 h−1, CO feed rate: 5.1 × 10⁻⁷ mol s−1 gcat−1). The gas mixture contained 1000 ppm CO and 1000 ppm O2 diluted with nitrogen and dried by a cold trap (dry ice/isopropanol). Reaction products were analyzed using a URAS 26 CO/CO2 analyzer. Prior to the testing, catalysts were dried in N2 flow for 2 h to remove water.
Results and discussion
Investigation of gold colloid formation in the microfluidic reactor
A novel microfluidic setup was designed based on a previous prototype34 in order to provide pulsation-free flow at high flow rates for the synthesis of NPs (Fig. 1). The reactants in vessels were pressurized by N2 and delivered to three cyclone micromixers integrated in a microfluidic chip made of silicon-bonded glass for rapid and thorough mixing (details, cf. Materials and methods section). High flow rates through the small channels (300 × 300 μm2) were achieved by pressurizing the vessels and fine adjusted with the aid of needle valves. The fluid delivery rack uses corrosion and pressure resistant (up to 15 bars) parts (details, cf. Materials and methods), designed to handle high flow rates of reactants up to a Reynolds number of 2400 in order to approach turbulent mixing.34,42,43 Rapid lateral mixing ensures high time resolution and plug flow behavior of the channel flow. Consequently, this setup allows precise correlation of reaction time and X-ray beam position along the channel to enhance time resolution, therefore allowing accurate determination of the residence time of Au NPs in the reaction channel (further fluid mechanical properties are summarized in the ESI,† Fig. S1, Table S1 and S2). The present setup and conditions were designed for achieving a total flow rate of 2.6 L h−1 (1.3 L h−1 for each reactant flow), a pressure drop of about 9 bar inside the microchannel, a deadtime of <2 ms in the micromixers (details in Fig. S2†) and residence time of about 20 ms in the microchannel. The flow conditions were simulated by computational fluid dynamics (CFD) to optimize homogeneous mixing of the reactants using cyclone micromixers.34The microfluidic silicon chip was sandwiched inside a stainless steel support frame with access to two reactant inlets, one product outlet and an X-ray transparent Si/glass observation window. Afterwards, the chip was mounted on the sample stage in such a way that a focused X-ray beam could be aimed at different positions along the microchannel downstream from the micromixers (Fig. 2a). Mapping the oxidation states of gold in solution by XAS in the microfluidic device with a microfocused beam allows the reduction reaction of Au NPs formed during the first 20 ms of the reaction to be followed. Au-L3 fluorescence mapping to locate the channel and identify measurement positions was initially performed by injecting only Au precursor solution into the channel. During NP synthesis experiments the total flow rate of reactants (HAuCl4/PVP and NaBH4/PVP solutions) was adjusted to about 2.6 L h−1 to approach turbulent lateral mixing; in this way lateral concentration gradients could be minimized and plug flow behavior of the system was approached. In situ XAS was applied to monitor the reaction progress in this continuous rapid flow by probing at different positions along the channel (details in Fig. S3†) to observe the oxidation states of Au during reduction. The measured spectra in Fig. 2b clearly show a significant contribution of oxidized Au after the first 6 ms of the reaction, whereas after ca. 10 ms reduction of Au was complete. Note that the mixing of the reactants prior to the observation channel was optimized (cf. Materials and methods and Fig. S2†) so that such short reactions could be monitored. The mixing time was also considered in correlating reaction times to locations where XAS spectra were recorded. Hence, these results show that the reduction of Au3+ by NaBH4 in the presence of PVP proceeds within a fast time frame of 10 ms.
This is the first study of Au NP formation in a microfluidic device within such a narrow time window. Polte et al.9 recorded SAXS and XANES data of Au NPs 100 ms and 200 ms after the beginning of the reaction, respectively. They concluded that reduction of Au3+ with NaBH4 was complete at some earlier time, and focused on the nucleation and growth processes occurring at a later stage. Abécassis et al.24 followed the synthesis of Au NPs during reduction of AuCl3 in an organic solvent (toluene) by a milder reducing agent (TBAB) in situ using SAXS and XANES with 100 ms time resolution. At 104 ms after mixing they observed Au+ which was gradually reduced to Au0. Our setup allows investigation of early stages of such fast reactions and thereby a new insight into reduction and nucleation during NP formation in a microfluidic device.
Comparison of the gold colloids produced in the microfluidic reactor and batch reactor
The Au:PVP NPs synthesized in the microfluidic reactor were investigated with UV-vis spectroscopy and compared with Au NPs using the same Au![[thin space (1/6-em)]](https://www.rsc.org/images/entities/char_2009.gif) :
:![[thin space (1/6-em)]](https://www.rsc.org/images/entities/char_2009.gif) PVP
PVP![[thin space (1/6-em)]](https://www.rsc.org/images/entities/char_2009.gif) :
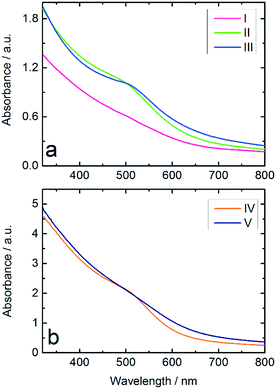
:![[thin space (1/6-em)]](https://www.rsc.org/images/entities/char_2009.gif) NaBH4 ratio and Au NPs produced from THPC/NaOH, both produced in the batch reactor. The results in Fig. 3a show a stronger suppression of the surface plasmon resonance (SPR) band in the spectrum of Au:PVP NPs produced in the microfluidic reactor compared to those prepared in batch reactor, which indicates formation of smaller NPs. According to literature,8,29,44 suppression of the SPR has been observed for ultrasmall Au NPs with diameters below 3 nm, in which surface scattering is the dominant factor. These results illustrate the advantages of microfluidic synthesis compared to batch synthesis, indicating that homogeneous mixing of the reactants had already been achieved before the rapid reduction occurred.
NaBH4 ratio and Au NPs produced from THPC/NaOH, both produced in the batch reactor. The results in Fig. 3a show a stronger suppression of the surface plasmon resonance (SPR) band in the spectrum of Au:PVP NPs produced in the microfluidic reactor compared to those prepared in batch reactor, which indicates formation of smaller NPs. According to literature,8,29,44 suppression of the SPR has been observed for ultrasmall Au NPs with diameters below 3 nm, in which surface scattering is the dominant factor. These results illustrate the advantages of microfluidic synthesis compared to batch synthesis, indicating that homogeneous mixing of the reactants had already been achieved before the rapid reduction occurred.
The hydrophobic wall surfaces effectively inhibited Au deposition in the channels. However, in order to investigate the effect of the Ombrello-coated channel walls on the synthesis, the Au NPs produced in uncoated and coated channels were compared by UV-vis. The results indicate Au NPs with smaller diameters compared to the particles formed in the uncoated channel (Fig. 3b).
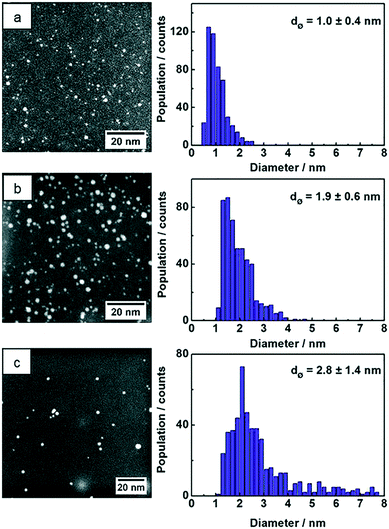
STEM images of the three samples show NPs with spherical shape and the particle size statistics were measured from hundreds of Au NPs and plotted as histograms (Fig. 4). The Au:PVP NPs produced in the microfluidic reactor show ultrasmall particle size with 1.0 nm average diameter, whereas the average size of Au:PVP NPs produced in batch reactor using NaBH4 increased to 1.9 nm. The particle size distribution was also slightly broader in case of the Au:PVP NPs produced in the batch reactor. These results are comparable to those in literature. Tsunoyama et al.5,29,45 achieved NPs produced in microreactor with the average NP size of 1.3 nm and a slightly narrower size distribution compared to those produced in batch. Au NPs synthesized in batch by THPC/NaOH has the broadest size distribution with average diameters of 2.8 nm compared to the previous two samples. However, it was also reported that strict cleanliness of the beakers (pre-washed with aqua regia) and freshly dissolved reactants lead to smaller NP size (<2.5 nm) and narrower size distribution.8,46
Au NPs produced in microfluidic reactor deposited on TiO2
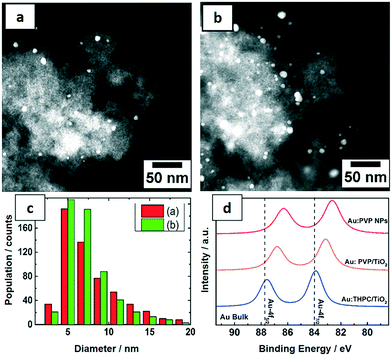
The PVP-stabilized Au NPs from the microfluidic reactor were deposited on TiO2 with 0.7 and 1.7 wt% Au loading for catalytic tests. The morphology and distribution of supported Au NPs were characterized by STEM (Fig. 5a–c). Size distributions were obtained by measuring the diameters of about 600 particles yielding an average particle size of around 7.5 nm. The Au NPs were homogeneously distributed on the support and both catalysts show similar particle size distribution from the corresponding histogram. Notably a significant increase in size of Au NPs was observed following deposition on titania. Pre-treatment of the titania under different conditions, the method used to deposit Au NPs on the support and post-synthetic treatment conditions (e.g. calcination) are all known to result in different Au–TiO2 interaction. In this case, it is proposed that a weak interaction increased the mobility of Au NPs, leading to some level of aggregation.47In order to understand the electronic structures of Au NPs produced with different reducing agents and stabilizers, the uncalcined NPs were investigated by XPS. The close up XPS scans of the Au 4f doublets in Fig. 5d show a peak shift to lower binding energies for Au:PVP NPs and also for Au:PVP/TiO2 samples, but not for Au NPs reduced by THPC. This shift can be related to the electron transfer between the ligand and gold. The Au 4f5/2 and Au 4f7/2 orbitals in bulk state appear at 87.7 and 84 eV, respectively. However, in Au:PVP NPs these peaks appeared at 86.3 and 82.6 eV, respectively. This indicates that the surfaces of the Au NPs are negatively charged. According to literature,45 this effect is attributed to the electron donating nature of PVP to gold surfaces. This shift to lower binding energies was smaller for Au:PVP/TiO2 samples compared to unsupported Au:PVP.
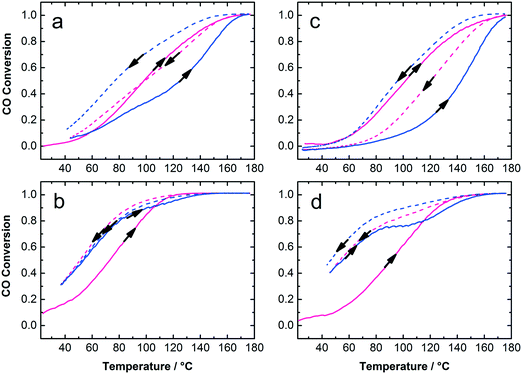
The Au:PVP/TiO2 with 0.7 and 1.7 wt% gold loading exhibited high activity for CO oxidation in calcined and uncalcined states considering their rather large Au NP size on titania and the presence of organic surfactants on the catalyst surface (Fig. 6). It is clear that lower Au loading (0.7 wt%) and calcined catalysts show the highest activity among these samples. To some extent removal of PVP from Au NPs and sintering of particles due to calcination could play different and competitive roles in the activity of the catalysts. The calcination temperature, Au NP size, moisture and finally the strength of Au–TiO2 interaction, which depends on the preparation method, are important parameters in catalytic activity. Strong Au–TiO2 interaction leads to a high number of effective active sites in the perimeter interface of Au and TiO2 resulting in higher activity in CO oxidation conversion.14,48,49 In this study, the mechanical mixing applied to adsorb colloidal Au on the support resulted in well-distributed Au NPs on titania but also in bigger NP sizes compared to the initial NP size in the colloids. Nevertheless, under such circumstances as low Au loading (0.7 and 1.7 wt%) with 7.5 nm mean particle size on titania and the presence of PVP, the catalytic activity of the samples in CO oxidation is acceptable. Table 1 summarizes the particle sizes of the colloidal Au NPs as well as particle sizes, surface areas and catalytic properties of the Au/TiO2 catalysts.
| Sample | State | Synthesis method | d Au (nm) TEM | SA (m2 g−1) BET | T 1/2 (°C) | |
|---|---|---|---|---|---|---|
| 1st cycle | 2nd cycle | |||||
| Au:PVP NPs | Colloid | μ-Reactor | 1.8 ± 0.5 | |||
| Au:PVP NPs | Colloid | Batch reactor | 1.9 ± 0.6 | |||
| Au:THPC NPs | Colloid | Batch reactor | 2.8 ± 1.4 | |||
| 0.7 wt% Au:PVP/TiO2 | Uncalcined | Au-μ-reactor | 7.9 ± 3.9 | 317 | 98 | 125 |
| Calcined | Au-μ-reactor | 73 | 53 | |||
| 1.7 wt% Au:PVP/TiO2 | Uncalcined | Au-μ-reactor | 7.3 ± 3.0 | 317 | 102 | 143 |
| Calcined | Au-μ-reactor | 91 | 55 | |||
| TiO2 | Uncalcined | 329 | ||||
| Calcined | 208 | |||||
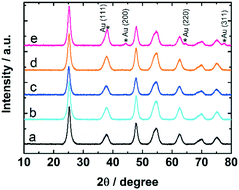
The samples were studied with XRD before and after calcination at 300 °C and CO oxidation tests. The diffractograms confirm the presence of anatase phase of titania. The Au reflections8,50 were not detected in uncalcined 0.7 and 1.7 wt% Au:PVP/TiO2 catalysts. However, after calcination they appeared in the diffractogram of 1.7 wt% Au:PVP/TiO2 catalyst (Fig. 7), caused by sintering due to higher gold concentration in this sample. This could explain the lower activity in CO oxidation of 1.7 wt% Au:PVP/TiO2 catalyst after calcination compared to 0.7 wt% Au:PVP/TiO2.
Conclusions
A new setup was presented for microfluidic synthesis of ultrasmall nanoparticles with narrow size distribution in fast continuous flow at high Reynolds numbers up to 2400 and for in situ spatially and time resolved studies of early stage kinetics of fast reactions. The special micromixers integrated in the chip allow decreasing the mixing time to less than 2 ms. This setup was used to investigate the formation of Au NPs during reduction of the Au3+ precursor by NaBH4 in the presence of PVP using in situ XAS but can also be applied to other spectroscopic and scattering techniques. Monitoring the reaction progress under continuous flow by recording XAS spectra at different positions along the microchannel with a focused X-ray beam revealed that up to 6 ms there is still a significant contribution of Au in oxidized state. The reduction to Au0 was complete within the first 10 ms of this fast reaction.The Au:PVP nanoparticles produced in the microfluidic chip were characterized by complementary techniques (UV-vis, TEM, XPS and XRD) and compared to Au:PVP NPs and Au/THPC NPs synthesized in batch. The average size of Au:PVP NPs from microfluidic synthesis was 1.0 ± 0.4 nm with a narrower size distribution which also showed a stronger suppression of the SPR band in UV-vis spectra. In agreement with earlier studies, the addition of PVP as stabilizer transferred negative electric charges to Au surfaces, which decreases the binding energies of Au 4f.
Au:PVP NPs produced in microfluidic chip were also deposited on TiO2. The resulting catalytic materials were quite active for CO oxidation. The calcined 0.7 wt% Au:PVP/TiO2 sample was more active under the same conditions compared to the corresponding uncalcined catalysts with higher Au loading. According to XRD, the 1.7 wt% Au:PVP/TiO2 sample calcined at 300 °C underwent sintering. The results of this study indicate that the supported Au NPs produced from this microfluidic setup are not only attractive for in situ studies of NP formation but may also be promising candidates for catalytic and sensing applications.
Conflicts of interest
There are no conflicts to declare.Acknowledgements
The Virtual Institute VI-403 “In situ Nano Imaging of Biological and Chemical Processes”, the BMBF (projects 05K10VK1, 05K13VK2) and KIT are gratefully acknowledged for financial support. We thank Dr. Andreas Jahn (IHM TUD) and Dr. Steffen Howitz (GeSiM) for constructing the microfluidic chips. In addition, we would like to appreciate the Karlsruhe Nano Micro Facility (KNMF), a Helmholtz research infrastructure at KIT for providing STEM-EDX and ICP-OES measurements and also Angela Beilmann (ITCP) for BET measurements. Special thanks to Dr. Angela Ewinger, Anke Urban, Sabine Heideker, Achim Wenka, Dr. Andreas Kölbl (IMVT) and Dr. Georg Hofmann (ITCP) for the fruitful discussions regarding fluid mechanics. Also many thanks to Mohammad Vakili (University of Hamburg) for valuable advice on hydrophobic channel coating, and to Dr. Michael Hirtz (INT) for his support regarding functionalization of microchannel walls. Finally, we thank SLS (SuperXAS beamline) for providing beamtime, in particular Dr. Maarten Nachtegaal (PSI) and Dr. Sabrina Müller (ITCP) for their help and technical support during XAS experiments.References
- S. Wang, Y. Zhao, J. Huang, Y. Wang, F. Kong, S. Wu, S. Zhang and W. Huang, Vacuum, 2006, 81, 394–397 CrossRef CAS
.
- X.-Q. Deng, B. Zhu, X.-S. Li, J.-L. Liu, X. Zhu and A.-M. Zhu, Appl. Catal., B, 2016, 188, 48–55 CrossRef CAS
.
- N. Tahmasebi and S. M. Mahdavi, Appl. Surf. Sci., 2015, 355, 884–890 CrossRef CAS
.
- L. Abahmane, A. Knauer, J. M. Köhler and G. A. Groß, Chem. Eng. J., 2011, 167, 519–526 CrossRef CAS
.
- H. Tsunoyama, H. Sakurai, N. Ichikuni, Y. Negishi and T. Tsukuda, Langmuir, 2004, 20, 11293–11296 CrossRef CAS PubMed
.
- F. Xu, Y. Yao, D. Bai, R. Xu, J. Mei, D. Wu, Z. Gao and K. Jiang, J. Colloid Interface Sci., 2015, 458, 194–199 CrossRef CAS PubMed
.
- D. Degler, S. Rank, S. Mueller, H. W. Pereira de Carvalho, J.-D. Grunwaldt, U. Weimar and N. Barsan, ACS Sens., 2016, 1, 1322–1329 CrossRef CAS
.
- J.-D. Grunwaldt, C. Kiener, C. Wögerbauer and A. Baiker, J. Catal., 1999, 181, 223–232 CrossRef CAS
.
- J. Polte, R. Erler, A. F. Thunemann, S. Sokolov, T. T. Ahner, K. Rademann, F. Emmerling and R. Kraehnert, ACS Nano, 2010, 4, 1076–1082 CrossRef CAS PubMed
.
- M. Luty-Błocho, K. Fitzner, V. Hessel, P. Löb, M. Maskos, D. Metzke, K. Pacławski and M. Wojnicki, Chem. Eng. J., 2011, 171, 279–290 CrossRef
.
- K. Pacławski, B. Streszewski, W. Jaworski, M. Luty-Błocho and K. Fitzner, Colloids Surf., A, 2012, 413, 208–215 CrossRef
.
- P. Zhao, N. Li and D. Astruc, Coord. Chem. Rev., 2013, 257, 638–665 CrossRef CAS
.
- I. Ojea-Jiménez, F. M. Romero, N. G. Bastús and V. Puntes, J. Phys. Chem. C, 2010, 114, 1800–1804 Search PubMed
.
- S. Tsubota, T. Nakamura, K. Tanaka and M. Haruta, Catal. Lett., 1998, 56, 131–135 CrossRef CAS
.
- B. H. Kim, M. J. Hackett, J. Park and T. Hyeon, Chem. Mater., 2013, 26, 59–71 CrossRef
.
- M. T. Rahman and E. V. Rebrov, Processes, 2014, 2, 466–493 CrossRef
.
- J. I. Park, A. Saffari, S. Kumar, A. Günther and E. Kumacheva, Annu. Rev. Mater. Res., 2010, 40, 415–443 CrossRef CAS
.
- A. Günther and K. F. Jensen, Lab Chip, 2006, 6, 1487–1503 RSC
.
- G. M. Whitesides, Nature, 2006, 442, 368–373 CrossRef CAS PubMed
.
- M. Luty-Błocho, M. Wojnicki, K. Pacławski and K. Fitzner, Chem. Eng. J., 2013, 226, 46–51 CrossRef
.
- B. Abécassis, F. Testard, O. Spalla and P. Barboux, Nano Lett., 2007, 7, 1723–1727 CrossRef PubMed
.
- K. Sai Krishna, C. V. Navin, S. Biswas, V. Singh, K. Ham, G. L. Bovenkamp, C. S. Theegala, J. T. Miller, J. J. Spivey and C. S. Kumar, J. Am. Chem. Soc., 2013, 135, 5450–5456 CrossRef CAS PubMed
.
- T. Yao, Z. Sun, Y. Li, Z. Pan, H. Wei, Y. Xie, M. Nomura, Y. Niwa, W. Yan and Z. Wu, J. Am. Chem. Soc., 2010, 132, 7696–7701 CrossRef CAS PubMed
.
- B. Abécassis, F. Testard, Q. Kong, B. Francois and O. Spalla, Langmuir, 2010, 26, 13847–13854 CrossRef PubMed
.
- C. Liu, Adv. Mater., 2007, 19, 3783–3790 CrossRef CAS
.
- C. Hu, S. Lin, W. Li, H. Sun, Y. Chen, C.-W. Chan, C.-H. Leung, D.-L. Ma, H. Wu and K. Ren, Lab Chip, 2016, 16, 3909–3918 RSC
.
- T. Kirner, J. Albert, M. Günther, G. Mayer, K. Reinhäckel and J. Köhler, Chem. Eng. J., 2004, 101, 65–74 CrossRef CAS
.
- J. Wagner and J. Köhler, Nano Lett., 2005, 5, 685–691 CrossRef CAS PubMed
.
- H. Tsunoyama, N. Ichikuni and T. Tsukuda, Langmuir, 2008, 24, 11327–11330 CrossRef CAS PubMed
.
- T. Ishizaka, A. Ishigaki, H. Kawanami, A. Suzuki and T. M. Suzuki, J. Colloid Interface Sci., 2012, 367, 135–138 CrossRef CAS PubMed
.
- S. Watanabe, T. Hiratsuka, Y. Asahi, A. Tanaka, K. Mae and M. T. Miyahara, Part. Part. Syst. Charact., 2015, 32, 234–242 CrossRef CAS
.
- R. Ishida, S. Hayashi, S. Yamazoe, K. Kato and T. Tsukuda, J. Phys. Chem. Lett., 2017, 8, 2368–2372 CrossRef CAS PubMed
.
- D. Loh, S. Sen, M. Bosman, S. F. Tan, J. Zhong, C. A. Nijhuis, P. Král, P. Matsudaira and U. Mirsaidov, Nat. Chem., 2016, 9, 77–82 Search PubMed
.
- G. Hofmann, G. Tofighi, G. Rinke, S. Baier, A. Ewinger, A. Urban, A. Wenka, S. Heideker, A. Jahn, R. Dittmeyer and J.-D. Grunwaldt, J. Phys.: Conf. Ser., 2016, 712, 012072 CrossRef
.
- A. Kölbl, M. Kraut and A. Wenka, Chem. Eng. J., 2011, 167, 444–454 CrossRef
.
- J. Thiele, M. Windbergs, A. R. Abate, M. Trebbin, H. C. Shum, S. Förster and D. A. Weitz, Lab Chip, 2011, 11, 2362–2368 RSC
.
- L. Mazutis, J. Gilbert, W. L. Ung, D. A. Weitz, A. D. Griffiths and J. A. Heyman, Nat. Protoc., 2013, 8, 870–891 CrossRef CAS PubMed
.
- D. G. Duff, A. Baiker and P. P. Edwards, Langmuir, 1993, 9, 2301–2309 CrossRef CAS
.
- J. L. Hueso, V. Sebastián, Á. Mayoral, L. Usón, M. Arruebo and J. Santamaría, RSC Adv., 2013, 3, 10427–10433 RSC
.
- B. Ravel and M. Newville, J. Synchrotron Radiat., 2005, 12, 537–541 CrossRef CAS PubMed
.
- N. K. Chaki, H. Tsunoyama, Y. Negishi, H. Sakurai and T. Tsukuda, J. Phys. Chem. C, 2007, 111, 4885–4888 CAS
.
- K. Schubert, J. Brandner, M. Fichtner, G. Linder, U. Schygulla and A. Wenka, Microscale Thermophys. Eng., 2001, 5, 17–39 CrossRef CAS
.
- C. Rands, B. Webb and D. Maynes, Int. J. Heat Mass Transfer, 2006, 49, 2924–2930 CrossRef
.
- J. Ftouni, M. Penhoat, A. Addad, E. Payen, C. Rolando and J.-S. Girardon, Nanoscale, 2012, 4, 4450–4454 RSC
.
- H. Tsunoyama, N. Ichikuni, H. Sakurai and T. Tsukuda, J. Am. Chem. Soc., 2009, 131, 7086–7093 CrossRef CAS PubMed
.
- D. G. Duff, A. Baiker and P. P. Edwards, J. Chem. Soc., Chem. Commun., 1993, 96–98 RSC
.
- J.-Y. Ruzicka, F. Abu Bakar, C. Hoeck, R. Adnan, C. McNicoll, T. Kemmitt, B. C. Cowie, G. F. Metha, G. G. Andersson and V. B. Golovko, J. Phys. Chem. C, 2015, 119, 24465–24474 CAS
.
- M. Okumura, T. Fujitani, J. Huang and T. Ishida, ACS Catal., 2015, 5, 4699–4707 CrossRef CAS
.
- Q. Yao, C. Wang, H. Wang, H. Yan and J. Lu, J. Phys. Chem. C, 2016, 120, 9174–9183 CAS
.
- X. Zhang, L. Yu, J. Tie and X. Dong, Sensors, 2014, 14, 19517–19532 CrossRef CAS PubMed
.
Footnote |
| † Electronic supplementary information (ESI) available. See DOI: 10.1039/c7re00114b |
| This journal is © The Royal Society of Chemistry 2017 |

