
Investigation of mass transfer limitations in simultaneous esterification and transesterification of triglycerides using a heterogeneous catalyst†
Rohidas
Bhoi
 ,
Dheerendra
Singh
and
Sanjay
Mahajani
*
,
Dheerendra
Singh
and
Sanjay
Mahajani
*
Department of Chemical Engineering, Indian Institute of Technology Bombay, Mumbai-400076, India. E-mail: sanjaym@iitb.ac.in
First published on 15th August 2017
Abstract
The process for the production of biodiesel can be intensified significantly by employing heterogeneous catalysts that can tolerate free fatty acid in the feedstock. The synthesis of biodiesel was experimentally investigated in a fixed bed reactor using refined sunflower oil (triglyceride) and raw Jatropha oil (triglyceride with free fatty acid). A zinc-based catalyst was used in the form of cylindrical pellets of 6 mm in diameter and 8–10 mm in length. For the raw Jatropha oil, conversions greater than 90% were realized for both triglycerides and free fatty acids (FFAs), typically at 200 °C and a molar ratio of 6![[thin space (1/6-em)]](https://www.rsc.org/images/entities/char_2009.gif) :1 (methanol:oil) for a residence time of 40 gcat ml−1 min. The experimental results for the refined oil in the fixed bed reactor (FBR) are explained using an appropriate model that incorporates both simplified kinetics and external mass transfer resistances at liquid–liquid and solid–liquid interfaces. The comparison of FBR results with those of the independent experiments in a spinning basket reactor, in the absence of external mass transfer limitations, shows that the intrinsic reaction is very fast. Hence, in the fixed bed reactor, mass transfer limitations especially at the liquid–liquid interface play an important role under the conditions employed. The rates in the case of refined sunflower oil are significantly lower compared to those of Jatropha oil, due to the presence of FFA, mono- and diglycerides in the latter.
:1 (methanol:oil) for a residence time of 40 gcat ml−1 min. The experimental results for the refined oil in the fixed bed reactor (FBR) are explained using an appropriate model that incorporates both simplified kinetics and external mass transfer resistances at liquid–liquid and solid–liquid interfaces. The comparison of FBR results with those of the independent experiments in a spinning basket reactor, in the absence of external mass transfer limitations, shows that the intrinsic reaction is very fast. Hence, in the fixed bed reactor, mass transfer limitations especially at the liquid–liquid interface play an important role under the conditions employed. The rates in the case of refined sunflower oil are significantly lower compared to those of Jatropha oil, due to the presence of FFA, mono- and diglycerides in the latter.
Introduction
Biodiesel is synthesized by either transesterification of triglycerides or esterification of fatty acids. The success of any proposed process/catalyst for biodiesel production largely depends on the quality of the feedstock. The production of biodiesel from clean triglyceride feedstock is easier than that from impure feedstock containing more than 1 wt% free fatty acid (FFA). For the impure feedstock, a catalyst must tolerate the presence of free fatty acids and possess activity for both esterification and transesterification to convert FFA and oil to biodiesel. A conventional process employs two separate steps to perform esterification and transesterification using homogeneous acid and base catalysts, respectively.1 In such a process, separation of catalysts from the reaction mixture involves multiple steps in downstream processing. In addition, this process consumes a large amount of water thereby imposing a substantial load on effluent treatment. It is therefore necessary to identify a heterogeneous catalyst and suitable reaction conditions such that desired conversion can be achieved in a single step thereby imparting a minimum burden to downstream processing.The reaction steps in biodiesel synthesis (see the reaction schemes in Fig. S1†) can occur under mild operating conditions in the presence of homogeneous or any other alkali metal oxide catalysts. However, reactions with these catalysts have their own limitations such as sensitivity to water and FFAs, difficulty in product separation/downstream processing, metal leaching etc.2,3 On the other hand, there have been several studies reporting the use of heterogeneous catalysts for the conversion of various oil feedstocks.4 It was emphasized that a solid catalyst with water tolerance is desirable.5 More than 95% conversion of soybean oil has been reported for a zirconia-based catalyst in a fixed bed reactor6 and batch reactor.7 In another study, a yield as high as 90 wt% is reported for low quality canola oil at 200 °C and a 9:1 methanol-to-oil molar ratio.8 The catalyst pretreatment temperature such as calcination temperature has also been shown to be an important factor.9 A 96% yield of biodiesel from waste oil was reported with a zinc–lanthanum catalyst. Reactions were conducted at 170–220 °C. The catalyst was able to promote both esterification and transesterification, simultaneously.10 CaO as a catalyst is reported for single-step esterification and transesterification for the synthesis of biodiesel from Jatropha curcas oil under mild conditions, but it is found to offer a low yield due to soap formation.5 A continuous process for the production of biodiesel from cheap raw feedstock was proposed and a demonstration plant of biodiesel has been built to produce 10000 tonnes per year.11 The optimized reaction parameters reported are: temperature 200 °C, methanol-to-oil mole ratio 9:1 and 3 wt% catalyst.11 Most of these studies, except the last one, are restricted to preparation, characterization and activity evaluation of catalysts in laboratory. For commercial exploitation of catalysts, it may be necessary to evaluate the performance in a suitable reactor (e.g. a fixed bed reactor) and determine if there are any mass transfer limitations. Furthermore, deactivation of a heterogeneous catalyst is common and the life of the catalyst also needs to be tested. In this work, we undertake this study using previously developed catalyst ZnO/ZSM-5 by our group,12,13 and present the role of mass transfer limitations in a fixed bed reactor through pertinent experiments and theoretical analysis. Two different feeds viz. refined sunflower oil and raw Jatropha oil were used for the synthesis of biodiesel. The former is a pure triglyceride and hence its reaction allows one to analyze the experimental results using a theoretical model. Jatropha oil, which is identified as a promising feedstock for the production of biodiesel especially in countries like India,14 typically contains 10–20% (w/w) FFA. Unlike other base catalysts, the ZnO/ZSM-5 catalyst stands the acidic environment and has ability to catalyze both esterification and transesterification reactions, simultaneously. One of the advantages of using a heterogeneous catalyst for this reaction is that pure glycerol is obtained as a co-product thereby eliminating the need of its recovery process. It may be noted that the catalyst (ZnO/ZSM-5) used in this study, like most of the other heterogeneous catalysts,12 is active only at high temperatures (>160 °C).
This article is organized as follows: first, we describe the experimental and analytical procedures used to perform batch and continuous reactions in a spinning basket reactor (SBR) and fixed bed reactor (FBR), respectively. The kinetic data in the SBR is generated under conditions such that mass transfer limitations are negligible. A simplified kinetic model is proposed and the corresponding kinetic parameters are determined based on this data. Further, the results of FBR experiments at different residence times, molar ratios and temperatures are presented. The comparison of SBR and FBR runs indicates that the reaction in the FBR is strongly hampered by mass transfer resistances. A model that incorporates the effect of mass transfer resistances at both liquid–liquid and solid–liquid interfaces in the FBR is formulated and the experimental results are explained by estimating the values of individual mass transfer coefficients. The motivation for performing runs with refined sunflower oil comes from the fact that due to being a pure triglyceride, the theoretical analysis through kinetic and reactor modeling is relatively convenient in this case. Furthermore, this analysis provides a theoretical basis to explain experimental results on raw Jatropha oil containing free fatty acids, mono- and di-glycerides and other impurities.
Materials and methods
Sunflower oil manufactured by Agro Tech Foods Limited Mumbai and Jatropha oil containing 20 wt% FFA were obtained from a local market. Methanol (>98% pure) was supplied by Merck Specialities Pvt Limited, Mumbai. ZnO/ZSM-5 with 25 wt% loading of ZnO (25 wt% ZnO and 75 wt% ZSM-5), prepared by a hydrothermal impregnation precipitation (HIP) method, was used as a catalyst for all the runs in this work. The catalyst was used in a pellet form. The preparation and characterization of the catalyst can be found elsewhere.12 The purpose of zeolite as a support is to reduce the leaching of metal ions during the course of the reaction;12 it also helps control other possible deactivations due to agglomeration of catalytic particles under reaction conditions and enhances the thermal stability of the catalyst. The catalyst has a BET surface area of 297.3 m2 g−1. The average particle size of a ZnO particle, measured by TEM image analysis, was found to be 19.5 nm.The reaction samples were analyzed by HPLC (Agilent Technologies, 1200 series with a UV detector, USA). Monoglycerides (MGs), diglycerides (DGs), triglycerides (TGs) and free fatty acids (FFAs) were separated using a combination of eluents. The HPLC column (C18, ZORBAX ODS 4.6 mm × 250, 5 μm), maintained at 45 °C, was used with a gradient elution method12 at a total flow rate of 1 mL min−1.
HPLC grade 2-propanol, n-hexane, acetonitrile, and water were purchased from Merck Specialities Pvt. Limited, Mumbai. Samples were collected in vials, kept in an oven to evaporate methanol and then centrifuged to separate the glycerol-rich and biodiesel-rich phases. Approximately 0.01–0.02 g of a biodiesel layer was diluted in 5 ml of a 2-propanol + n-hexane (5:4 v/v) mixture. 20 μL of this mixture was injected into the HPLC. The composition of Jatropha oil used in this study is: 67 wt% triglyceride, 12 wt% diglyceride, 1 wt% monoglyceride and 20 wt% free fatty acid.
Experimental setup and procedure
Batch runs
Preliminary batch runs were conducted to ascertain the activity of the catalyst. The runs were conducted in an autoclave (model 4843, Parr Instrument Company; capacity 300 mL, maximum temperature 350 °C, maximum pressure 199 bar) for Jatropha oil at 200 °C with different catalyst loadings and at different methanol-to-oil molar ratios. The results are summarized in Table 1, which indicates that 95.3% conversion of TG can be achieved in 60 min at a methanol-to-oil molar ratio of 20:1. The results indicate that the catalyst was sufficiently active for the synthesis of biodiesel from Jatropha oil, even in the presence of FFA, under the given conditions.
| Reaction time, min | Catalyst loading (wt% of total reaction mixture) | Molar ratio MeOH:oil |
Conversion of TG (%) | Conversion of FFA (%) |
|---|---|---|---|---|
| 40 | 0 | 30:1 |
28.00 | 65.78 |
| 10 | 0.25 | 20:1 |
60.35 | 85.10 |
| 10 | 0.5 | 20:1 |
66.90 | 85.37 |
| 20 | 2 | 6:1 |
51.02 | 88.92 |
| 40 | 2 | 10:1 |
58.94 | 90.11 |
| 60 | 4 | 20:1 |
95.30 | 90.21 |
Since Jatropha oil is a mixture of TG and FFA, we performed studies with refined sunflower oil, which is free from free fatty acids. It allows us to study only transesterification independently. In order to determine the kinetics of transesterification at low conversions, reactions were conducted in a spinning basket reactor (model: Carberry Spinning Basket Catalyst Reactor, Autoclave Engineers; capacity 250 mL), wherein catalyst pellets were packed in a basket attached to the impeller, which rotates at high speed to eliminate external mass transfer limitations, if any. The data was used to determine the kinetic parameters.
Fixed bed reactor runs
The fixed bed reactor, because of its simplicity in design and operation, is normally the first choice to perform this reaction in a continuous mode on a large scale. The schematic of the setup, used in the present study, to perform the continuous experiments is shown in Fig. 1. The catalyst was used in the form of pellets to reduce the pressure drop. The diameter and the length of a pellet were 6 mm and 8–10 mm, respectively. The pellets were prepared using a pelletizer at a mechanical pressure of 2 ton. | ||
| Fig. 1 Schematic of the continuous fixed bed reactor set up. | ||
Oil and methanol, at a desired molar ratio, were fed to the reactor using high pressure pumps. The two reactants were mixed together and passed through a pre-heater to heat the mixture to 150 °C. The preheated mixture was then passed through a tubular reactor containing the ZnO/ZSM5 catalyst in a pellet form. The volume of the tubular reactor used in this study was 0.034 liters, which accommodated 36.5 g of the catalyst. The reactions were carried out over a temperature range of 170–200 °C and under a pressure of 60 bar. The pressure inside the reactor was maintained using a back-pressure regulator (TESCOM; maximum pressure 172 bar) connected to the outlet. The reactions were conducted at three different molar ratios of methanol to oil i.e. 6:1, 10:1 and 20:1. Furthermore, the residence time was also varied over a range of 10–40 gcat ml−1 min by varying the flow rates of both the reactants. Jathropa and sunflower oils were used for the experiments. As mentioned before, the former represents the mixture of TG and FFA, and the latter is pure TG.
Catalyst wettability and durability
The catalyst wettability was tested using a force tensiometer (model Sigma 701, KSV Instruments Inc., USA). The contact angle, determined using the tensiometer, was 87.15° for methanol and 49.13° for sunflower oil. The results indicate that sunflower oil has higher wettability for ZnO/ZSM-5. The catalyst was subjected to longer contact time in order to investigate its activity for the desired reaction. The activity of the catalyst remained unaffected for more than 300 h of continuous operation.12 All the results reported in this work are for the runs conducted within a period of 300 h where consistent catalyst activity was observed.Kinetics of the transesterification reaction
As mentioned before, we conducted reactions of sunflower oil in a spinning basket reactor (SBR) to study intrinsic reaction kinetics. The catalyst of interest, ZnO/ZSM-5 in the pellet form, was placed in the catalyst basket of the reactor. All the runs in the spinning basket reactor were conducted at 550 rpm at which, external mass transfer resistances are eliminated. The results of the runs conducted at various speeds of agitation are reported in the ESI† (Fig. S2). In general, the rates observed for pure TG (sunflower oil) were lower than those for Jatropha oil or a mixture of TG and FFA. The reason for this is given later in this paper. The typical triglyceride compositions of sunflower and Jatropha oils are given in Table 2. The major components in both oils are oleic and linoleic acid esters, and hence the triglycerides in both feedstocks are expected to have similar reactivity for the transesterification reaction.| Oil | Triglyceride composition (wt%) | |||||
|---|---|---|---|---|---|---|
| Palmitic (C16:0a) | Palmitoleic (C16:1) | Stearic (C18:0) | Oleic (C18:1) | Linoleic (C18:2) | Linoleic (C18:3) | |
| a C16:00, the alkyl chain contains 16 carbon atoms and zero double bonds. | ||||||
| Sunflower15 | 4.77–8.27 | — | 0.54–3.42 | 26.62–64.16 | 29.27–62.77 | 0.03–0.21 |
| Jatropha 16 | 13.34 | 0.99 | 4.91 | 32.03 | 45.05 | 0.23 |
Effect of the catalyst loading
The transesterification runs were conducted at 170 °C at a methanol-to-oil molar ratio of 6:1 and with different catalyst loadings over a range of 0.023 to 0.119, expressed as the weight of the catalyst per unit weight of the reaction mixture. The results are shown in Fig. 2a. It was observed that with increasing catalyst loading, the conversion of TG increases.
 | ||
| Fig. 2 Effect of catalyst loading on a) TG conversion. Temperature: 170 °C and methanol-to-oil molar ratio 6:1. b) OA (oleic acid) conversion. Temperature: 170 °C and methanol-to-OA molar ratio 6:1. | ||
Similarly, the effect of the catalyst loading on esterification of FFA was also investigated at 170 °C and at a methanol-to-oleic acid (as representative FFA) molar ratio of 6:1 (Fig. 2b). Interestingly, the catalyst loading had no effect on the conversion of oleic acid indicating that esterification is almost a self-catalyzed reaction at such a high temperature (170 °C). This is the reason why, in many experiments involving oleic acid, zero time conversion itself was found to be substantial (e.g.Fig. 2b). The experiments examining the effect of the temperature and molar ratio were conducted with a catalyst loading of 0.083 w/w.
Effect of temperature
The effects of temperature on independent transesterification and esterification reactions are shown in Fig. 3. The runs were conducted at methanol-to-oil and methanol-to-oleic acid molar ratios of 6:1. As expected, the conversions of TG and oleic acid increase with increasing temperature. The percentage TG conversions for 60 min were 23.40, 40.99 and 61.86% at 170 °C, 180 °C and 200 °C, respectively. Similarly, the oleic acid conversions for 60 min were 65.57, 75.00 and 86.74% at 170 °C, 180 °C and 200 °C, respectively.
 | ||
| Fig. 3 Effect of temperature on a) TG conversion, methanol-to-oil molar ratio 6:1 and b) OA (oleic acid) conversion, methanol-to-OA molar ratio 6:1. | ||
Effect of the molar ratio
Runs were conducted at 170 °C to examine the effect of the molar ratio on the conversion of TG and oleic acid (OA). The results for both the reactions, conducted separately, are shown in Fig. 4. In the case of sunflower oil and methanol, there exist two phases over the entire course of the reaction. In the case of the reaction between pure oleic acid and methanol, it is a single liquid phase system. | ||
| Fig. 4 Effect of the molar ratio on a) TG conversion and b) OA conversion, at 170 °C. | ||
The volume of the reaction mixture was kept constant and the quantities of TG, OA and methanol were charged according to the desired molar ratio. For the two phase system (oil and methanol), the rate of the reaction depends on the solubility of methanol in oil and the concentration of TG. Fig. 4a suggests the relatively weak dependence of the conversion of TG on the molar ratio. This is expected because the solubility of methanol in the oil phase is insensitive to the phase ratio, especially at lower conversions. An experiment was also conducted for a long time to test whether the reaction is irreversible. After an initial high rate of reaction, a plateau in the conversion curve was observed with a maximum conversion of 64.85% at 120 min and a methanol-to-oil mole ratio of 6:1. The plateau suggests that TG transesterification is a reversible reaction. The results are shown in the ESI† (Fig. S3).
For the homogeneous reaction of oleic acid and methanol, the molar ratio exhibits its effect as expected. Fig. 4b shows the variation in the oleic acid conversion as the reaction proceeds. As mentioned earlier, the volume of the reaction mixture was kept constant while oleic acid and methanol were charged according to the desired molar ratio, resulting in a dilution of oleic acid at a higher molar ratio. Hence, the rate increased with decreasing molar ratio. This can be attributed to the self-catalysis by oleic acid, which is expected to be more pronounced at lower molar ratios.
The concentration profiles for TG transesterification conducted in the SBR at 200 °C and a methanol-to-oil molar ratio of 6:1 and with a catalyst loading of 0.083 (w/w) are shown in Fig. 5. It is evident that, initially at a low conversion, a negligible amount of MG is formed, suggesting that the first step, i.e. conversion of TG to DG and biodiesel (see Fig. S3†) dominates and hence the kinetics at low conversions is mainly determined by the rate of this first step.
 | ||
| Fig. 5 Concentration profile for TG transesterification in the SBR. Temperature 200 °C; methanol-to-oil molar ratio 6:1; catalyst loading 0.083 (w/w). | ||
The data obtained for transesterification in the spinning basket batch reactor was analyzed using the initial rates (eqn (1a)). The forward rate constant may be determined based on the values of the initial rate given by eqn (1a), wherein, the concentration of methanol is equal to its solubility. As mentioned before, since the first step dominates, the kinetics of the formation of biodiesel may be assumed to be first order with respect to TG and methanol each. The rate of the reverse reaction is zero at time zero.
| −roil0 = kr·Coil0·CMeOH0 | (1a) |
| CMeOH0 = SMeOH−oil | (1b) |
 | (1c) |
S MeOH–oil was estimated by mixing sunflower oil and methanol in an autoclave at different temperatures. The samples were withdrawn under no stirring conditions in a sealed bottle containing chilled water and analyzed for methanol using a GC (model 911M, MAK Analytica, India) equipped with a TCD detector and Porapak-Q (80–100 mesh) column. The outlet tube from the autoclave was dipped directly in water to avoid losses of methanol. The solubility values of methanol in oil for example, at 180 °C and 200 °C, were found to be 3.68 and 4.21 (kmol m−3), respectively. The kr values were estimated from eqn (1c) using the data generated in the spinning basket reactor. It may be noted that the rate constant values determined here are apparent values affected by intraparticle diffusion resistance. The kinetics developed here is therefore specific to the catalyst used in this study of a given particle size (6 mm in diameter). From the reaction rate constants, the activation energy, calculated using the Arrhenius equation, was found to be 25.03 kJ mol−1. The Arrhenius plot is presented in the ESI† (Fig. S4). The lower value of activation energy indicates intraparticle diffusion limitations.
Furthermore, the reaction, in all probability, takes place in three steps and ideally, one should model each individual step and determine the kinetics. However, this exercise needs elaborate data on liquid–liquid distribution at different reaction temperatures for all the individual components and the phase ratio as the reaction proceeds. This is out of the scope of the present work. Nevertheless, the simplified initial rate analysis presented here helps us further interpret the results on the performance of the fixed bed reactor and the role of L–L and S–L mass transfer limitations.
Reactions in the fixed bed reactor
The general course of simultaneous esterification and transesterification reactions as a function of residence time is shown in Fig. 6 for Jatropha oil, which is a mixture of triglycerides and fatty acids. The residence time was calculated as the weight of the catalyst divided by the total flow rate of reactants (gcat ml−1 min). Each data point is generated by performing the reaction at different flow rates in the same reactor thereby changing the residence time. The representative results shown here are for the experiments conducted at 200 °C and at a methanol-to-Jatropha oil ratio of 6:1 (mol/mol). The TG content, for a residence time of 40 gcat ml−1 min, was reduced to less than 1 wt% from the inlet value of 67 wt%; so was the trend in the FFA concentration, which was reduced from 20 wt% to less than 1 wt%. DG and MG appear at short residence times but diminish at longer residence times. The concentration of biodiesel, being the product of both esterification and transesterification reactions, increased gradually with increasing residence time. It may be noted that the concentrations reported in Fig. 6 are of the oil phase. Whereas, the methanol phase concentrations could not be measured due to the limitation of the experimental procedure.
 | ||
| Fig. 6 General course of the reaction in the fixed bed reactor, temperature 200 °C and molar ratio 6:1. | ||
As mentioned before, we performed several runs in the FBR only with sunflower oil (pure TG) and analyzed them with the help of a simplified model that considers mass transfer effects accompanied by chemical reaction in the FBR. To reiterate, sunflower oil is a pure TG and the theoretical analysis through kinetic and reactor modeling is relatively convenient in this case. Furthermore, this analysis provides a theoretical basis to explain the experimental results for raw Jatropha oil containing mono- and di-glycerides, and free fatty acids along with TG.
The experiments were carried out in the FBR using refined sunflower oil at 180 °C and 200 °C and at three methanol-to-oil molar ratios i.e. 6:1, 10:1 and 20:1. The results are shown in Fig. 7. The conversion level is significantly low and far from the reaction equilibrium. As expected, similar to the results of the batch reactor, the conversion of TG did not show much variation with respect to the change in the molar ratio. Also, the effect of temperature was not significant. The percent conversions obtained at 40 gcat ml−1 min residence time and 200 °C were 26.95, 25.84 and 28.36% for methanol-to-oil molar ratios of 6:1, 10:1 and 20:1, respectively. These conversions were much lower than those observed for Jatropha oil which contains FFA (see Fig. 6). These results confirm that the TG transesterification is faster in the presence of FFA. It may be noted that Jatropha oil contains substantial amounts of DG and MG, which further help the reaction offer relatively high conversions.
 | ||
| Fig. 7 Transesterification of sunflower oil in the FBR at a) 180 °C, b) 200 °C and at different molar ratios. | ||
Comparison of the FBR and basket reactor
The results of the runs conducted for sunflower oil in the FBR and basket reactor at the same temperature are shown in Fig. 8. It was observed that the TG conversion under otherwise similar conditions was significantly higher in the basket reactor. The percent conversion at 6 gcat ml−1 min in the basket reactor for 200 °C was 62.48% whereas it was 16.26% in the FBR at 10 gcat ml−1 min. It may be noted that the sensitivity of the reaction rate to temperature in the FBR is relatively less than that in the stirred batch reactor. These results further corroborate our earlier conclusion that the reaction rate is strongly hampered by mass transfer limitations in the case of the FBR. | ||
| Fig. 8 Comparison of the TG conversions in the FBR and spinning basket reactor at 180 °C & 200 °C and at a methanol-to-oil molar ratio of 6:1. | ||
Estimation of mass transfer coefficients in the FBR
The synthesis of biodiesel in the fixed bed reactor (FBR) is associated with partially miscible reactants and a solid catalyst. This leads to a case of a three-phase system consisting of the solid catalyst and the reactants and products distributed in two liquid phases. The mass transfer resistances exist at the liquid–liquid and solid–liquid interfaces. The mass transfer coefficient at the solid–liquid interface was calculated using Frössling's equation (eqn (2)). The relationship between the Sherwood number (Sh), Reynolds number (Re) and Schmidt number (Sc) in this case is given by eqn (2). | (2) |
The diffusivity of methanol in oil was calculated using eqn (3).17
 | (3) |
The variation in the calculated values of the mass transfer coefficient at the solid–liquid interface (kc) with respect to the molar ratio at 200 °C is shown in Fig. 9a. The mass transfer coefficient increased with respect to the flow rate due to the increased Reynolds number. The lowest flow rate represents the highest residence time and vice versa. For a given total flow rate (or residence time), the variations in the Reynolds number (Re) and Schmidt number (Sc) were not significant and hence, the mass transfer coefficient is insensitive to the change in the molar ratio.
 | ||
| Fig. 9 Variation of the S–L mass transfer coefficient in the FBR with respect to a) the molar ratio at 200 °C and b) temperature at a molar ratio of 6:1. | ||
The variation in the calculated values of the mass transfer coefficient with respect to temperature at a molar ratio of 6:1 is shown in Fig. 9b. It increased with increasing temperature due to higher diffusivity.
There are very few studies reported in the literature for the calculation of the mass transfer coefficient at the liquid–liquid interface (kL–L) in packed columns for a three-phase system. The mass transfer coefficient at the methanol–oil interface (kL–L) was estimated using eqn (4),18 by performing experiments in the same reactor under non-reactive conditions i.e. at lower temperatures. In the present case, the concentration of methanol in the oil phase was very low and the properties of the oil phase can be assumed to be almost constant during the course of the reaction. Under the above conditions, eqn (4) can be used to obtain the values of the overall mass transfer coefficient (ka). Further, the values of kL–L are obtained by dividing ka with a, the effective interfacial area per unit packed volume (cm2 cm−3). kL–L was estimated by carrying out experiments in the FBR at room temperature (30 °C) using a methanol-to-oil molar ratio of 6:1 at different residence times. At this temperature, the reaction does not initiate and the experiment gives the values of kL–L without reaction and temperature effects.
 | (4) |
The results are shown in Fig. 10. The mass transfer coefficient increased with increasing flow rate due to the corresponding increase in the Reynolds number (Re). The low values of kL–L represent the strong resistance at the liquid–liquid interface. The reactions in this work are carried out at higher temperatures (170–200 °C). Hence, it is likely that the resistance at the liquid–liquid interface may be reduced with increasing diffusivity of methanol in oil at higher temperatures. Furthermore, the biodiesel that was formed during the course of the reaction through esterification and transesterification also acts as a co-solvent for methanol and oil that would help reduce the mass transfer limitations at the liquid–liquid interface.19,20 Hence, higher conversion of oil was observed in the presence of the mixture (FFA + oil) as compared to the one with pure oil (see Fig. 6 and 7).
 | ||
| Fig. 10 Experimentally determined values of the liquid–liquid mass transfer coefficient in the FBR at room temperature and at a methanol-to-oil molar ratio of 6:1. | ||
FBR model
The objective of this section is to formulate and solve the fixed bed reactor model by incorporating the reaction kinetics obtained before and examine the role of external mass transfer limitations at solid–liquid and liquid–liquid interfaces. The assumptions are as follows:1. The wettability of oil is higher than methanol, hence, oil surrounds the catalyst and methanol has to diffuse through the oil phase to reach the catalyst sites.
2. As per the Weisz–Prater criterion (parameter values in the range of 10–66), the intrapellet diffusion limitations cannot be neglected.
3. All the reactants and products are distributed in the two liquid phases that co-exist during the entire course of the reaction.
4. While calculating the mass transfer coefficient (kc) and diffusivity (DMeOH–oil), we have used the physical properties of the feed.
5. Reaction conversion is low enough so that the reaction is nearly irreversible.
The transport of methanol at the interfaces is schematically shown in Fig. 11. The reaction is intrinsically very fast and limited by the diffusion of methanol to the catalyst surface. The diffusion resistances exist at liquid–liquid and solid–liquid interfaces.
 | ||
| Fig. 11 Schematic representation of the concentration profile of methanol across all the interfaces in the FBR. | ||
The rate of the reaction on the catalyst surface is given by eqn (5). Eqn (6) and (7) give the rate of reaction across the solid–liquid and liquid–liquid interfaces, respectively. The concentrations of oil in the oil phase and that on the catalyst surface are assumed to be equal (refer to eqn (8)) as it is present in large proportion. CmethanolMeOH and Coiloil are expressed in terms of conversion of oil in eqn (9) and (10), respectively.

| (5) |

| (6) |
| (7) |
| C oiloil ∼ Csurfaceoil | (8) |

| (9) |

| (10) |
The error between the experimental results and that predicted using the model was minimized to estimate the value of kL–L. The estimated values of kL–L are 1.2 to 1.5 times higher than those determined by the correlation. This is because the values of the mass transfer coefficient (kL–L) are obtained at room temperature using eqn (4) and are likely to increase at high temperature due to the increase in diffusivity of methanol in oil.
The sensitivity of the results to the reaction rate constant and mass transfer coefficients was determined and it was observed that the TG conversion in the FBR is almost insensitive to the reaction rate constant, at lower conversions. The reaction is limited by methanol transport to the catalyst surface and sensitive to the mass transfer across the liquid–liquid interface.
The parity plot for the conversion of TG at 180 and 200 °C, for all the residence times, is shown in Fig. 12, which shows that the experimental results agree well with the predictions.
 | ||
| Fig. 12 Parity plot of TG conversion at 180 and 200 °C in the FBR. Methanol to oil molar ratio 6:1. | ||
The reaction is intrinsically very fast. The values of the mass transfer coefficient at solid–liquid (kc) and liquid–liquid (kL–L) interfaces at 180 °C and 200 °C, thus calculated, are reported in Table 3. As observed, the mass transfer coefficient at the solid–liquid interface (kc) is 4–8 times higher than the mass transfer coefficient at the liquid–liquid (kL–L) interface, which means that the overall rate is mainly governed by the resistance at the liquid–liquid interface (kL–L).
| Residence time, gcat ml−1 min | Total flow rate, cm3 min−1 | Mass transfer coefficient at solid–liquid (kc) interface m3 kgcat−1 h−1 | Mass transfer coefficient at liquid–liquid (kL–L) interface, m3 kgcat−1 h−1 | ||
|---|---|---|---|---|---|
| 180 °C | 200 °C | 180 °C | 200 °C | ||
| 10 | 3.75 | 2.19 × 10⁻³ | 3.41 × 10⁻³ | 5.43 × 10⁻⁴ | 6.63 × 10⁻⁴ |
| 20 | 1.88 | 1.76 × 10⁻³ | 2.76 × 10⁻³ | 3.23 × 10⁻⁴ | 3.94 × 10⁻⁴ |
| 30 | 1.25 | 1.57 × 10⁻³ | 2.47 × 10⁻³ | 2.23 × 10⁻⁴ | 2.72 × 10⁻⁴ |
| 40 | 0.94 | 1.45 × 10⁻³ | 2.29 × 10⁻³ | 2.14 × 10⁻⁴ | 2.62 × 10⁻⁴ |
Effect of FFA on the reaction kinetics
In this section, we study the effect of the presence of FFA on the reaction rate. Runs were conducted in the basket reactor, with a mixture of sunflower oil and FFA (20 wt%), to observe the effect of temperature on simultaneous esterification and transesterification reactions. Oleic acid was used as a representative component of FFA. The results are shown in Fig. 13. | ||
| Fig. 13 Effect of temperature on the conversion of a) TG in the OATG mixture and b) OA in the OATG mixture, at a methanol-to-oil molar ratio of 6:1. | ||
The rate of the TG conversion in the mixture (Fig. 13a) was higher than that of pure TG (Fig. 3a). The conversion of TG for 60 min and at 200 °C was 61.86% for pure TG, while it was 73.97% in the case of the mixture. Similarly, for the esterification reaction, the conversion of oleic acid was higher in the case of the mixture (see Fig. 3b and 13b). At 200 °C, the conversion of pure oleic acid was 78.68% in 35 min, whereas it was 93.84% in the case of the mixture in the same period. This increase in conversion of TG in the case of the mixture was due to the increased solubility of methanol in the oil phase as explained earlier. As we know, the esterification of oleic acid is a reversible reaction. In the case of the mixture, as both of the reactions occur simultaneously, the formation of glycerol in the transesterification reaction results in a separate phase and helps extract water from the organic phase thereby moving the reaction in the forward direction.21 Separate experiments were conducted to examine this effect. The results are shown in Fig. 14. It can be seen that the conversion of oleic acid increased in the presence of glycerol.
 | ||
| Fig. 14 Effect of the presence of glycerol on the conversion of oleic acid at 170 °C and a methanol-to-oleic acid molar ratio of 6:1. | ||
Similarly, the runs were conducted at 170 °C in the basket reactor, with a mixture of sunflower oil and FFA (20 wt%), to observe the effect of the methanol-to-oil molar ratio on simultaneous esterification and transesterification reactions. The results are shown in Fig. 15. As observed earlier in Fig. 4a, TG conversion is less dependent on the methanol-to oil-molar ratio (Fig. 15a). The TG conversion is higher in the case of the mixture. Fig. 15b shows the results for the conversion of oleic acid in the mixture. As observed in the case of pure oleic acid (Fig. 4b), here again, the conversion of OA was higher at the lower molar ratio. The oleic acid conversion is higher in the case of the mixture. This was due to the self-catalysis by oleic acid, which means that at the high temperature used in this study, the oleic acid gets converted to biodiesel even in the absence of the catalyst, which was more pronounced at lower molar ratios due to the high concentration of oleic acid.
 | ||
| Fig. 15 Effect of the molar ratio on a) TG conversion in the OATG mixture and b) OA conversion in the OATG mixture, at 170 °C. | ||
Fig. 16 compares the rate of conversion of TG when the reaction was performed with pure TG (sunflower oil) and that with a synthetic mixture of TG and FFA (20 wt%), in spinning basket and fixed bed reactors. Additionally, the reaction with Jatropha oil (containing 20 wt% FFA) was also carried out in the FBR. We realized more than 90% conversion of Jatropha oil in the batch reactor (Table 1) and fixed bed reactor (Fig. 16b). It is clear that the presence of FFA enhances the rate of the reaction (Fig. 16b). We believe that this was due to the enhanced solubility of methanol in the oil phase in the presence of FFA. FFA addition also alters the equilibrium conversion significantly and the experimental proof may be found in Fig. S5 of the ESI.† This observation needs to be supported theoretically through further investigation. Furthermore, the higher rates for Jatropha oil are also possibly due to the presence of DG in the feedstock along with TG and FFA.
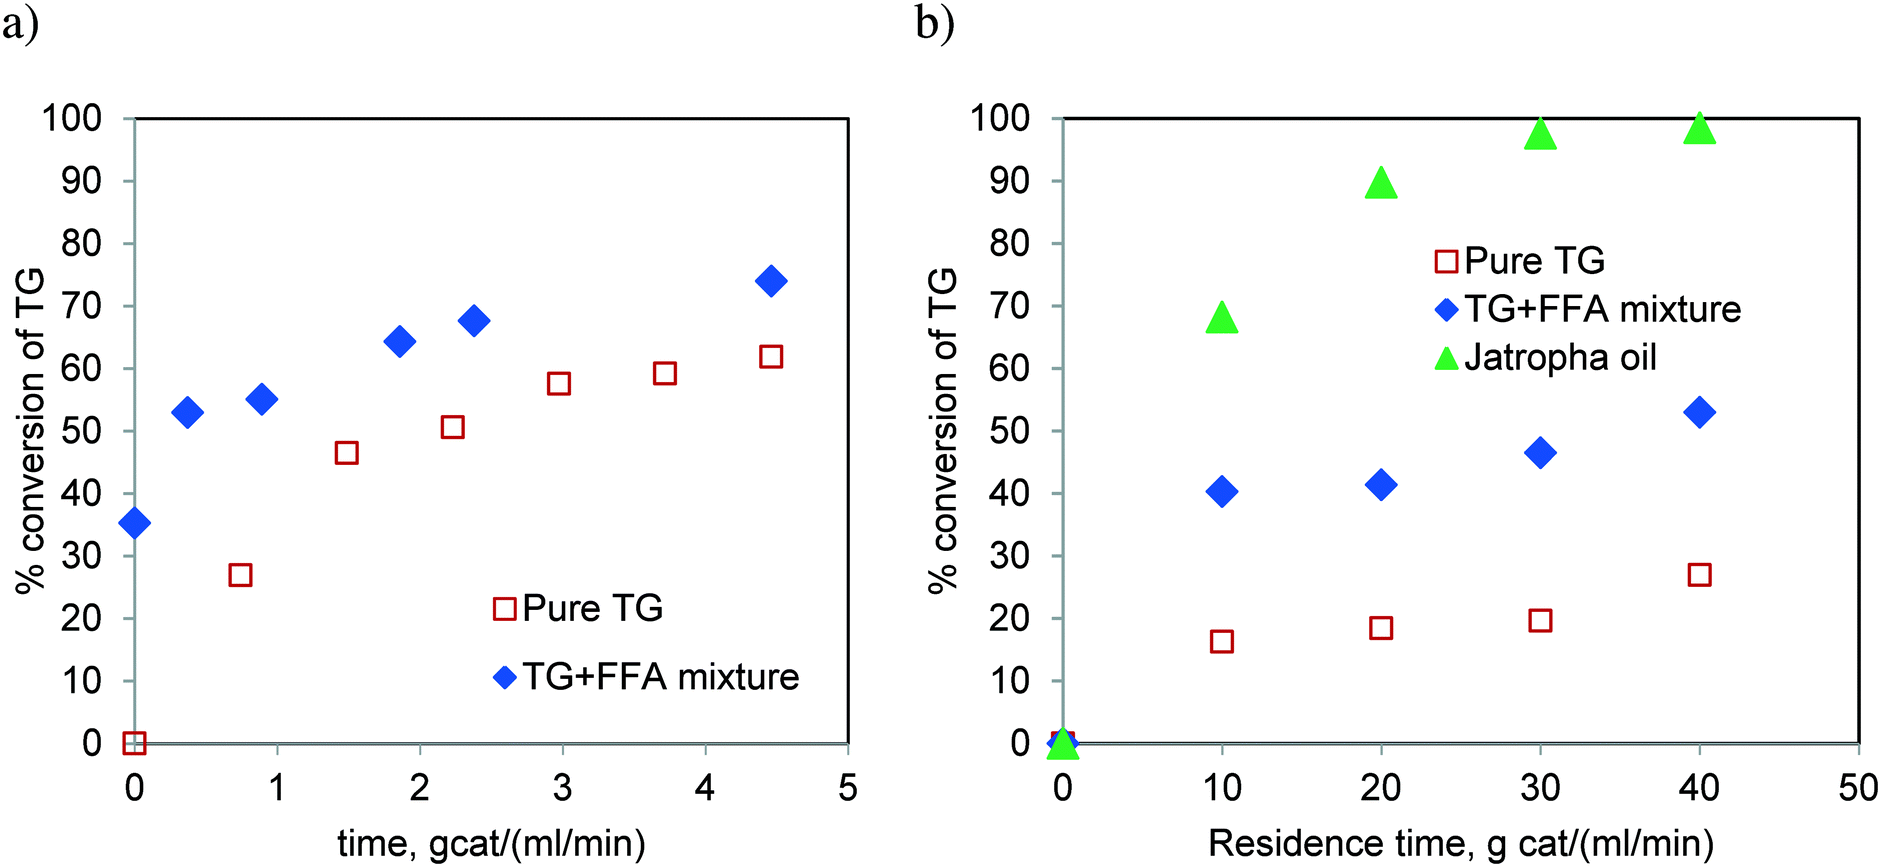 | ||
| Fig. 16 Conversion of TG when the reaction was performed with pure TG and the TG + FFA (20 wt%) mixture in the a) spinning basket reactor and b) fixed bed reactor, at 200 °C and a methanol-to-oil molar ratio of 6:1. | ||
We studied the reaction of only oleic acid (a representative FFA) with methanol on the same catalyst. The results with and without the catalyst in this case are compared and presented in Fig. 2b. It can be seen that at this elevated temperatures, the rate of uncatalyzed esterification was so fast that the catalyst does not play a role in enhancing the reaction rate. We also checked the activity of the used catalyst in the esterification reaction for transesterification. It was found that the catalyst activity remains almost constant indicating that the FFA does not deactivate the catalyst.
From the enhancement observed in the reaction rate, we estimated the rise in solubility using the respective reactor models and it was found to be of the order of 1.35–1.5 times the solubility in pure TG. The same has been verified experimentally and similar results are also reported by Singh.21
The motivation behind the use of the heterogeneous catalyst is to simplify the downstream processing. The proposed process that uses the heterogeneous catalyst is illustrated in the ESI† (Fig. S6 and S7).
Conclusion
The use of a heterogeneous catalyst (ZnO/ZSM-5) for biodiesel production is advantageous from the viewpoints of equipment and downstream processing. It was shown that the catalyst has significant activity for the reaction of both pure feed (e.g. sunflower oil) and impure feed (e.g. Jatropha oil). Reactions were studied in a fixed bed reactor and a basket reactor. In the case of Jatropha oil, the conversions of FFA and TG obtained at 200 °C and a 6:1 molar ratio in laboratory were as high as 90% and 98%, respectively. It was proved that the presence of FFA in the feedstock helps increase the reaction rate significantly. This is due to the increased solubility of methanol in an oil-rich phase. Furthermore, it was observed that the conversion in the fixed bed reactor is mainly hampered by liquid–liquid mass transfer resistance which needs to be considered when designing the reactor on a large scale.
List of symbols
| −roil0 | Initial rate of reaction for TG (kmol kgcat−1 h−1) |
| x oil | Conversion of TG |
| t | Reaction time (h) |
| k r | Reaction rate constant (m6 kgcat−1 h−1 kmol−1) |
| C oil | Concentrations of TG and methanol at time t (kmol m−3) |
| C MeOH | Concentrations of TG at time t, (kmol m−3) |
| S MeOH–oil | Solubility of methanol in oil |
| Sh | Sherwood number |
| Re | Reynolds number |
| Sc | Schmidt number |
| k c | Mass transfer coefficient (cm s−1) |
| d p | Diameter of a particle (cm) |
| D MeOH–oil | Diffusivity of methanol in oil (cm2 s−1) |
| U | Free stream velocity (cm s−1) |
| ρ | Density of oil (g cm−3) |
| μ | Viscosity of oil (g cm−1 s−1) |
| ν | Kinematic viscosity of oil (cm2 s−1) |
| M oil | Average molecular weight of oil |
| T | Temperature (K) |
| μ oil | Viscosity of oil (centipoise) |
| V MeOH | Molecular volume of methanol (cm3 gmol−1) |
| V oil | Molecular volume of oil (cm3 gmol−1) |
| k L–L | Mass transfer coefficient at the liquid–liquid interface, (m3 kgcat−1 h−1) |
| ka | Overall mass transfer coefficient, s−1 |
| a | Effective interfacial area per unit packed volume (cm2 cm−3) |
| L | Volumetric flow rate of oil (cm3 s−1) |
| V | Packed volume (cm3) |
| C MeOHi | Initial concentration of methanol in oil (gmol cm−3) |
| C MeOHf | Final concentration of methanol in oil (gmol cm−3) |
| k c ′ | Mass transfer coefficient (m3 kgcat−1 h−1) |
| C surfaceoil | Concentration of oil on the catalyst surface (kmol m−3) |
| C surfaceMeOH | Concentration of methanol on the catalyst surface (kmol m−3) |
| C oilMeOH | Concentration of methanol in the oil phase (kmol m−3) |
| C methanolMeOH | Concentration of methanol in the bulk methanol phase (kmol m−3) |
Abbreviations
| FFA | Free fatty acid |
| TG | Triglycerides |
| DG | Diglycerides |
| MG | Monoglycerides |
| BD | Biodiesel |
| SBR | Spinning basket reactor |
| FBR | Fixed bed reactor |
| OA | Oleic acid |
| OATG | Oleic acid triglyceride mixture |
Conflicts of interest
There are no conflicts to declare.Acknowledgements
The authors would like to acknowledge TCE Consulting Engineers Limited, Mumbai for providing the financial support for this work.References
- E. Lotero, Y. Liu, D. E. Lopez, K. Suwannakarn, D. A. Bruce and J. G. Goodwin Jr., Synthesis of biodiesel via acid catalysis, Ind. Eng. Chem. Res., 2005, 44, 5353 CrossRef CAS.
- A. Lee, J. Bennett, J. Manayil and K. Wilson, Heterogeneous catalysis for sustainable biodiesel production via esterification and transesterification, Chem. Soc. Rev., 2014, 43, 7887 RSC.
- L. Konwar, J. Boro and D. Deka, Review on latest developments in biodiesel production using carbon-based catalysts, Renewable Sustainable Energy Rev., 2014, 546–564 CrossRef CAS.
- A. Ruhul, M. Kalam, H. Masjuki, I. Rizwanul Fattah, S. Reham and M. Rashed, State of the art of biodiesel production processes: a review of the heterogeneous catalyst, RSC Adv., 2015, 5, 101023 RSC.
- A. Endalew, Y. Kiros and R. Zanzi, Heterogeneous catalyst for biodiesel production from jatropha curcas oil, Energy, 2011, 36, 2693 CrossRef CAS.
- S. Furuta, H. Matsuhashi and K. Arata, Biodiesel fuel production with solid amorphous-zirconia catalyst in fixed bed reactor, Biomass Bioenergy, 2006, 30, 870 CrossRef CAS.
- C. M. Garcia, S. Teixeira, L. L. Marciniuk and U. Schuchardt, Transesterification of soybean oil catalyzed by sulfated zirconia, Bioresour. Technol., 2008, 99, 6608 CrossRef CAS PubMed.
- M. G. Kulkarni, R. Gopinath, L. C. Meher and A. K. Dalai, Solid acid catalyzed biodiesel production by simultaneous esterification and transesterification, Green Chem., 2006, 8, 1056 RSC.
- D. E. Lopez, K. Suwannakarn, D. A. Bruce and J. G. Goodwin Jr., Esterification and transesterification on tungstated zirconia: effect of calcination temperature, J. Catal., 2007, 247, 43 CrossRef CAS.
- S. Yan, S. Salley and K. Y. Simon Ng, Simultaneous transesterification and esterification of unrefined or waste oils over ZnO-La2O3 catalysts, Appl. Catal., A, 2009, 353, 203 CrossRef CAS.
- B. X. Peng, Q. Shu, J. F. Wang, G. R. Wang, D. Z. Wang and M. H. Han, Biodiesel production from waste oil feedstocks by solid acid catalysis, Process Saf. Environ. Prot., 2008, 86, 441 CrossRef CAS.
- D. Singh, R. Bhoi, A. Ganesh and S. Mahajani, Synthesis of biodiesel from vegetable oil using supported metal oxide catalysts, Energy Fuels, 2014, 28, 2743 CrossRef CAS.
- S. M. Mahajani, A. Ganesh, D. K. Singh and P. D. Gupta, Heterogeneous acid catalyst for producing biodiesel from vegetable oils and process for the preparation thereof, Indian Pat., 264626, 2015 Search PubMed.
- M. M. Azam, A. Waris and N. M. Nahar, Prospects and potential of fatty acid methyl esters of some non-traditional seed oils for use as biodiesel in India, Biomass Bioenergy, 2005, 29, 293 CrossRef.
- K. Chowdhury, L. A. Banu, S. Khan and A. Latif, Studies on the fatty acid composition of edible oil, Bangladesh J. Sci. Ind. Res., 2007, 42, 311 CrossRef CAS.
- H. Zhou, H. Lu and B. Liang, Solubility of multicomponent systems in the biodiesel production by transesterification of Jatropha curcas L. oil with methanol, J. Chem. Eng. Data, 2006, 51, 1130 CrossRef CAS.
- K. A. Reddy and L. K. Doraiswamy, Estimating liquid diffusivity, Ind. Eng. Chem. Fundam., 1967, 6(1), 77 CAS.
- R. P. Verma and M. M. Sharma, Mass transfer in packed liquid-liquid extraction columns, Chem. Eng. Sci., 1975, 30, 279 CrossRef CAS.
- H. Noureddini and D. Zhu, Kinetics of transesterification of soybean oil, J. Am. Oil Chem. Soc., 1997, 74(11), 1457 CrossRef CAS.
- M. K. Lam and K. T. Lee, Accelerating transesterification reaction with biodiesel as co-solvent: A case study for solid acid sulfated tin oxide catalyst, Fuel, 2010, 89, 3866 CrossRef CAS.
- D. Singh, P. Patidar, A. Ganesh and S. Mahajani, Esterification of oleic acid with glycerol in the presence of supported zinc oxide as catalyst, Ind. Eng. Chem. Res., 2013, 52, 14776 CrossRef CAS.
Footnote |
| † Electronic supplementary information (ESI) available: Reaction scheme Fig. S1, effect of rpm Fig. S2, conversion in a spinning basket reactor Fig. S3, Arrhenius plot Fig. S4, kinetics and equilibrium in the presence and absence of FFA in sunflower oil Fig. S5. The proposed process that uses a heterogeneous catalyst Fig. S6 and S7. See DOI: 10.1039/c6re00218h |
| This journal is © The Royal Society of Chemistry 2017 |