Photocatalytically active TiO2 microtubes assembled with radially aligned nanowires†
Yang
Xu
ab,
Wei
Wen
 ac,
Ming-Zao
Tang
 ab and
Jin-Ming
Wu
 *ab
*ab
aState Key Laboratory of Silicon Materials, Zhejiang University, Hangzhou 310027, P. R. China. E-mail: msewjm@zju.edu.cn
bSchool of Materials Science and Engineering, Zhejiang University, Hangzhou 310027, P. R. China
cCollege of Mechanical and Electrical Engineering, Hainan University, Haikou 570228, P. R. China
First published on 6th March 2017
Abstract
Hollow nanoarchitectures enhance mass transport whilst retaining the merits arising from these unique nanostructures, which are thus ideal structures for an efficient photocatalyst. In this study, polyester fibers were utilized to construct TiO2 hollow microtubes with radially aligned nanowires, through multi-steps of sol–gel, solution precipitation, and calcination. The TiO2 microtubes are ca. 10 μm in diameter, assembled with radially aligned nanowires that are ca. 40 nm in diameter and 1 μm in length. The microtubes as a whole consisted of anatase, rutile and brookite, which exhibit a band gap of 3.05 eV and a specific surface area of 36.0 m2 g−1. When utilized to assist photodegradation of rhodamine B in water under UV light illumination, the microtubes exhibited an efficiency much higher than that of sol–gel TiO2 nanoparticles, and similar to that of commercial P25 TiO2 nanoparticles, which could be attributed to the abundant surface hydroxyl groups and the nanowire-assembled hollow structure. Also, because of the easy recovery of the photocatalyst from the slurry system, the TiO2 microtubes developed herein are good candidates for effective photodegradation of organic pollutants in water.
Introduction
Nanostructured TiO2 finds wide applications in fields such as photocatalytic pollutant removal,1 photocatalytic water splitting,2 antibacterial coatings,3 solar energy harvesting4 and biomedical bone bonding.5 For photocatalytic applications, various efforts have been made to achieve nanosized TiO2 particles with tailored phases and morphologies.6–8 Such TiO2 nanoparticles in a slurry system exhibit high photocatalytic efficiency; yet the subsequent catalyst recovery remains a challenge.Light harvesting is the other concern for photocatalysts. When compared with solid spheres,9,10 TiO2 hollow structures allow the light to access the interior part of the architectures and give rise to diffractions and reflections of light,11–13 which are thus of great interest in practice. The hierarchical structure design of TiO2 micrometer-sized particles, which are assembled with 1- to 3-dimensional nanostructures, has been the focus of many studies, because in this case, the merits of nanostructures can also be retained.14–18
Fibers, including natural fibers and artificial fibers, are widely used as templates to fabricate TiO2 with a hollow tubular structure, for applications in water treatment,19 separation of oil from water,20 microextraction of trace metals,21 sensors,22 and so on, because of the easy template removal by calcination in air. In most cases, the sol–gel technique is adopted to coat the fibers with TiO2 nanoparticles. Hollow tubes with walls of TiO2 nanoparticulate aggregates were achieved after burning away the fibers.23–26 Hollow TiO2 microtubes assembled with 1D nanostructures via the organic fiber-templated route are rarely reported, probably due to the lack of techniques to synthesize 1D nanostructured TiO2 on delicate organic substrates. One study reports the synthesis of hollow TiO2 microtubes decorated with TiO2 nanorod arrays, utilizing glass fibers as templates; however, the removal of the inorganic templates demands a subsequent etching in a strong HF aqueous solution for 24 h, which is not environmentally benign.16
In this study, we adopted polyester fibers as templates to synthesize hollow TiO2 microtubes assembled with radially aligned nanowires. The fibers were firstly coated with a TiO2 seed layer via a sol–gel route followed by subsequent acid treatment to induce low-temperature crystallization. The radially aligned nanowires were then precipitated through a low-temperature solution precipitation technique, which is different from the widely adopted hydrothermal method.27,28 After a final calcination, the TiO2 microtubes exhibited an efficiency similar to that of commercial P25 nanoparticles when utilized to assist photodegradation of rhodamine B in water under UV light illumination.
Experimental
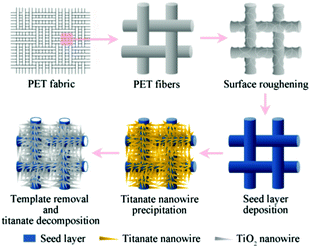
The synthetic route is illustrated in Scheme 1. All chemicals were of analytical grade and used without further purifications.Surface roughening of PET fabrics
PET (polyethylene terephthalate) fabrics (30 D × 30 D) of a size of 5 × 5 cm2 were ultrasonically washed with acetone for 10 min, followed by rinsing with ethyl alcohol three times and doubly deionized water, and then dried at 60 °C. An alkali-amine aqueous solution containing ethylenediamine, sodium hydroxide, and hexadecyltrimethylammonium bromide with a ratio of 2![[thin space (1/6-em)]](https://www.rsc.org/images/entities/char_2009.gif) :
:![[thin space (1/6-em)]](https://www.rsc.org/images/entities/char_2009.gif) 28
28![[thin space (1/6-em)]](https://www.rsc.org/images/entities/char_2009.gif) :
:![[thin space (1/6-em)]](https://www.rsc.org/images/entities/char_2009.gif) 0.08 (w/w) was prepared. The as-cleaned PET fabrics were soaked in the alkali-amine solution at 60 °C for 20 min and then washed with doubly deionized water several times and dried at 60 °C.
0.08 (w/w) was prepared. The as-cleaned PET fabrics were soaked in the alkali-amine solution at 60 °C for 20 min and then washed with doubly deionized water several times and dried at 60 °C.
Deposition of TiO2 seed layer
A titania sol was prepared following Kokubo et al.29 In brief, tetrabutyl titanate, doubly deionized water, nitric acid, and ethyl alcohol with a molar ratio of 1.0![[thin space (1/6-em)]](https://www.rsc.org/images/entities/char_2009.gif) :
:![[thin space (1/6-em)]](https://www.rsc.org/images/entities/char_2009.gif) 1.0
1.0![[thin space (1/6-em)]](https://www.rsc.org/images/entities/char_2009.gif) :
:![[thin space (1/6-em)]](https://www.rsc.org/images/entities/char_2009.gif) 0.1
0.1![[thin space (1/6-em)]](https://www.rsc.org/images/entities/char_2009.gif) :
:![[thin space (1/6-em)]](https://www.rsc.org/images/entities/char_2009.gif) 9.25 were mixed at 0 °C and stirred for 10 min. The surface-roughened PET fabrics were immersed in the sol for 24 h under the ambient atmosphere, lifted with a withdrawal rate of 100 mm min−1, and dried at 80 °C for 24 h. The fabrics were then immersed in 0.1 M HCl aqueous solution at 80 °C for 24 h, washed with doubly deionized water, and oven-dried.
9.25 were mixed at 0 °C and stirred for 10 min. The surface-roughened PET fabrics were immersed in the sol for 24 h under the ambient atmosphere, lifted with a withdrawal rate of 100 mm min−1, and dried at 80 °C for 24 h. The fabrics were then immersed in 0.1 M HCl aqueous solution at 80 °C for 24 h, washed with doubly deionized water, and oven-dried.
Precipitation of TiO2 nanowires
The PET fabrics with seed layers were immersed at 80 °C for 48 h in an H2O2 aqueous solution (30%, w/w) containing 0.31 M nitric acid, 16 mM melamine, and excess metallic Ti sponge particles. The specimens were then washed with doubly deionized water, dried, and subjected to a final calcination in air at 550 °C for 1 h to remove the PET templates and to induce TiO2 crystallization. The heating rate was 5 °C min−1.Characterizations
Powder X-ray diffraction (XRD) patterns were recorded using an Empyrean 200895 diffractometer (PANalytical BV, Netherlands) with CuKα radiation (λ = 0.154086 nm) and a graphite monochromator at ambient temperature. The morphology was observed using a field emission scanning electron microscopy (FESEM, S-4800, Hitachi, Japan) and a transmission electron microscopy (TEM, JEM-2010, JEOL, Japan). UV-visible diffuse reflection spectra were obtained with a UV-3150 UV-Vis near-infrared spectrometer (Shimadzu, Japan). X-ray photoelectron spectroscopy (XPS) was conducted with an Escalab 250Xi X system (Thermo Fisher Scientific, USA). The binding energy was calibrated by using the contaminant carbon (C 1s = 284.6 eV). Raman spectroscopy experiments were carried out with a LabRam HR UV system (Horiba, Japan) with a Nd:YAG intracavity doubled laser operating at 532 nm. The Brunauer–Emmett–Teller (BET) specific surface area was evaluated with an ASAP2020N system (Micromeritics, USA).Photocatalytic activity evaluation
In each run, 25 mg of the photocatalyst was dispersed into 50 mL rhodamine B aqueous solution with an initial concentration of 0.01 mM. The slurry system was stirred in the dark to establish an adsorption–desorption equilibrium. Irradiation was provided by an 18 W UV lamp (PL-L 18W/10/4P, Philips, Netherlands) with peak wavelength of 365 nm. The intensity reaching the solution was 6 mW cm−2, measured by a UV irradiance meter (model UV-A, Beijing Normal University). At fixed intervals, 3 mL of the slurry was taken out and centrifuged at 6000 rpm for 2 min to remove the particles. The change in rhodamine B concentration was then monitored with a 752-UV-VIS spectrophotometer at a fixed wavelength of 553 nm, using a quartz cuvette with an optical path of 1 cm.For photodegradation of phenol in water with an initial concentration of 10 ppm, irradiation was provided by a Xe lamp (CHF-XW500, Beijing Changtuo, China) with UV intensity of 4.5 mW cm−2 and visible light intensity of 180 mW cm−2. The phenol concentration was monitored using a liquid chromatography apparatus (Wufeng LC100, WondaCract ODS-2 column, China).
Results and discussion
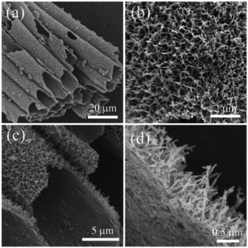
After the final calcination, the texture of the PET fabrics coated with TiO2 did not change as determined by visual inspection. The size of the fabric shrunk in a small ratio after burning the polymer template and the color changed from yellow to white upon the decomposition of the hydrogen titanate nanowires on crystallized TiO2, as shown in the ESI† (Fig. S1c and d). It is noted that, with the TiO2 seed layer only, the texture of PET fabrics is destroyed completely after calcination and the whole fabric shrunk into a pie shape by visual inspection (Fig. S1a and b, ESI†). Therefore, TiO2 nanowires on the external wall of the hollow fiber help maintain the morphology of the original textile texture.Fig. 1 shows FESEM images of the TiO2 microtubes at different magnifications. The TiO2 microtubes kept the original morphology of the PET fibers, which are ca. 10 μm in diameter (Fig. 1a). Quasi-aligned nanowires can be seen covering homogeneously the seed layer (Fig. 1b). The cross-sectional images (Fig. 1c and d) show that the nanowires are ca. 40 nm in diameter with a length/diameter ratio of ca. 25. The seed layer is quite thin, as can be discerned in Fig. 1d.
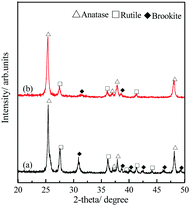
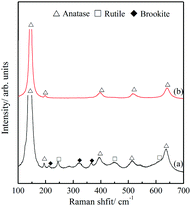
The polymorphism of the TiO2 microtubes was characterized by XRD and Raman spectra. Fig. 2a shows that, for the seed layer, XRD peaks corresponding to anatase,30 rutile,31 and brookite32 can be discerned. After the precipitation of the nanowires, the intensity of the characteristic peaks of both rutile and brookite decreased (Fig. 2b), which suggests that the nanowires are mainly anatase TiO2. This is further evidenced by the Raman analysis. Fig. 3a shows Raman peaks corresponding to anatase,33 rutile,34 and brookite35 for the seed layer, which is in accordance with the XRD pattern. For the TiO2 microtubes, Raman peaks corresponding only to anatase can be discerned (Fig. 3b). This can be explained by the fact that, as Raman spectroscopy mainly explores the surface molecular structure and phase, the homogeneous covering of the seed layer by the anatase TiO2 nanowires shielded the Raman signal from the seed layer.36
Fig. 4a shows a TEM image of a TiO2 microtube. The corresponding selected area electron diffraction (SAED) pattern shows diffraction rings which can be attributed to both anatase and rutile, in good accordance with the XRD pattern (Fig. 2b) and Raman spectrum (Fig. 3b). The HRTEM image of the nanowires exhibited clear lattice fringes with a neighboring distance of 0.35 nm (Fig. 4d), which can be attributed to the (101) facet of anatase. It is thus concluded that most nanowires consisted of randomly aligned anatase grains, which are ca. 20 nm in size (Fig. 4b–d).
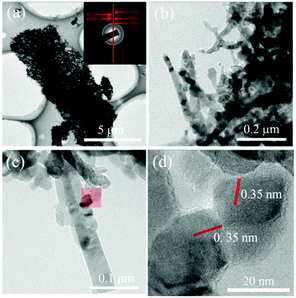 | ||
| Fig. 4 TEM (a–c) and HRTEM (d) images of the TiO2 microtubes. The inset in (a) shows the corresponding SAED pattern. The region shadowed in (c) is enlarged and shown in (d). | ||
The interaction of metallic Ti and H2O2 has been successfully adopted to precipitate TiO2 nanowires,37 nanorods,38 nanoflowers39 and nanobelts.40,41 In the current investigation, the etching of metallic Ti sponge particles by H2O2 molecules released Ti(IV) ions into the solution. In the presence of melamine in the acidic environment, hydrogen titanate nanowires precipitated on the seed layer.37 The subsequent calcination in air not only removed the PET fibers, but also decomposed the titanate nanowires to anatase TiO2.37
The low-temperature N2 adsorption–desorption isotherm and pore size distribution curve of the TiO2 microtubes are displayed in Fig. 5. The specific surface area is calculated to be ca. 36.0 m2 g−1. Zheng et al. fabricated TiO2 hollow fibers consisting of TiO2 nanoparticulate aggregates by using cotton fibers as templates via a sol–gel approach, which had a specific surface area of 8 m2 g−1.42 The 1D nanowires thus achieved significantly higher specific surface area. The pore size distribution curve displays a broad pore size distribution ranging from 20 to 100 nm, which suggests the existence of mesopores within/among the nanowires, and those from the microtubes as well. The total pore volume estimated by the Barrett–Joyner–Halenda method is ca. 0.22 cm3 g−1.
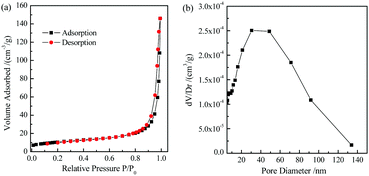 | ||
| Fig. 5 Low-temperature N2 adsorption–desorption isotherm (a) and pore size distribution curve (b) of the TiO2 microtubes. | ||
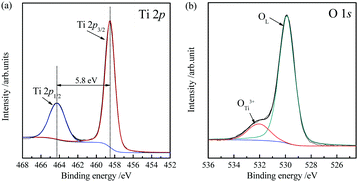
The chemical bonding states of the TiO2 microtubes were characterized by XPS (Fig. 6). The Ti 2p region (Fig. 6a) and O 1s region (Fig. 6b) were analyzed in detail. There are two main Ti 2p peaks. The peaks located at 458.5 and 464.3 eV correspond to the core level of Ti4+ 2p3/2 and Ti4+ 2p1/2. The binding energy gap between the two characteristic peaks is 5.8 eV, which is caused by Ti4+ in the lattice.43 The XPS spectrum of O 1s can be fitted by two peaks: the stronger peak at 529.9 eV originates from lattice oxygen of TiO2 and the peak located at 531.9 eV is attributed to the hydroxyl groups.44 The molar proportion of hydroxyl groups in the total oxygen components is evaluated to be ca. 8.4%, which have been argued to contribute to the photocatalytic activity because the hydroxyl groups can act as capture centers for photoinduced electrons.45
The energy gap of the seed layer and TiO2 microtubes can be evaluated by UV-visible diffuse reflection spectra (Fig. 7a) based on the Kubelka–Munk function.46Fig. 7b demonstrates that the band gap of the seed layer and TiO2 microtubes is 2.98 and 3.05 eV, respectively. The larger band gap for the TiO2 microtubes is reasonable because of the higher content of anatase TiO2. The band gap of bulk anatase is 3.2 eV. The much lower band gap for the present TiO2 microtubes can be attributed to the surface deficiency (Fig. 6b) and the rutile phase (Fig. 2b).
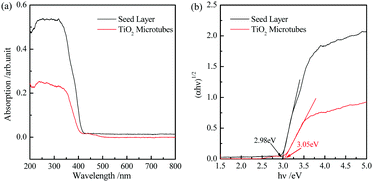 | ||
| Fig. 7 (a) UV-visible diffuse reflection absorption spectra of the seed layer and TiO2 microtubes. (b) Re-plot of (a) in the (αhν)1/2–hν coordinate to evaluate the corresponding band gaps. | ||
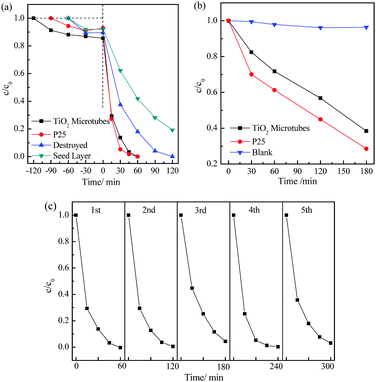
The photocatalytic activity of the TiO2 microtubes was evaluated in parallel with the seed layer and commercial Degussa P25 TiO2 nanoparticles. The dark adsorption curves displayed in Fig. 8a show that the TiO2 microtubes adsorbed ca. 15% rhodamine B molecules, which is more than those adsorbed by the seed layer (7%) and P25 nanoparticles (8%). Under UV light illumination for 60 min and in the presence of the sol–gel TiO2 nanoparticles, 42% rhodamine B molecules remained in water. The TiO2 microtubes induced total degradation of rhodamine B in water within just 60 min, which is almost the same as that of the commercial P25 TiO2 nanoparticles. When utilized to assist photodegradation of phenol in water under the illumination of a 500 W Xe lamp for 3 h, the TiO2 microtubes induced degradation of 62% phenol, which is 86% of that of P25 (Fig. 8b). It is noted that P25 TiO2 nanoparticles have been commonly recognized as an excellent photocatalyst which serves as a gold standard for comparisons of photocatalytic activity.
The high photocatalytic activity of the present TiO2 microtubes when compared with the sol–gel TiO2 nanoparticles can be attributed to the anatase TiO2 nanowires assembled on the wall of the microtubes. It has been well established that 1D nanowires exhibited a photocatalytic activity superior to that of nanoparticles because of the enhanced charge separation and mass transportation.47 The hydroxyl groups on the surface of the nanowires as demonstrated by the XPS analysis (Fig. 6) play an important role in the photocatalytic degradation of rhodamine B in water.48 The seed layer makes up the compact inner wall of the tubes, which allows multiple reflections of UV light within the interior of the tubes. UV light utilization is thus enhanced, which contributes to the photocatalytic activity.12 When the microtubes were thoroughly destroyed (refer to Fig. S2 (ESI†) for the morphology), the merits arising from both the nanowires and the tubular structure disappeared, which led to a much reduced efficiency for the photodegradation of rhodamine B in water (Fig. 8a).
The other factor contributing to the photocatalytic activity could be the phase junctions of anatase/rutile/brookite along the nanowire layer and the seed layer.49 The photogenerated electron/hole pairs can be efficiently separated among the three phases due to their different band gaps.50 Because of the gaps among the nanowires and the tubular structure, it is possible for both UV light and organic molecules to reach the interface and to be involved in the photodegradation process.51
The cycling performance of the TiO2 microtubes is shown in Fig. 8c. This indicates that the TiO2 microtubes can be recycled at least five times without obvious decay in the photocatalytic efficiency, which evidenced the high stability and also the easier catalyst recovery of the microtubes from the slurry.
Conclusions
Hollow TiO2 microtubes assembled with radially aligned nanowires were successfully synthesized, using polyester fibers as templates. The inner diameter of the TiO2 microtubes is ca. 10 μm and the nanowires are ca. 40 nm in diameter and 1 μm in length. The outer wall of the microtubes is anatase TiO2 nanowires and the inner wall (seed layer) is compact TiO2 nanoparticles with a phase mixture of anatase, rutile and brookite. The specific surface area of the microtubes is 36.0 m2 g−1 and the band gap is 3.05 eV. When utilized to assist in the photodegradation of rhodamine B in water under UV light illumination, the microtubes exhibited significantly higher activity when compared with sol–gel TiO2 nanoparticles, and an efficiency similar to that of commercial P25 TiO2 nanoparticles, thanks to the abundant surface hydroxyl groups and the nanowire-assembled hollow structure. Considering the easy recovery of the photocatalyst from the slurry system, the TiO2 microtubes developed herein are good candidates for effective photodegradation of organic pollutants in water.Acknowledgements
We are grateful for financial support from the National Natural Science Foundation of China (no. 51502065) and State Key Laboratory of Silicon Materials (no. SKL2016-12).References
- H. X. Lin, W. H. Deng, T. H. Zhou, S. B. Ning, J. L. Long and X. X. Wang, Appl. Catal., B, 2015, 176, 36–43 CrossRef.
- Z. G. Zou, J. H. Ye, K. Sayama and H. Arakawa, Nature, 2001, 414, 625–627 CrossRef CAS PubMed.
- U. Joost, K. Juganson, M. Visnapuu, M. Mortimer, A. Kahru, E. Nommiste, V. Kisand and A. Ivask, J. Photochem. Photobiol., B, 2015, 142, 178–185 CrossRef CAS PubMed.
- H. Y. Chen, T. L. Zhang, J. Fan, D. B. Kuang and C. Y. Su, ACS Appl. Mater. Interfaces, 2013, 5, 9205–9211 CAS.
- J. M. Wu, S. Hayakawa, K. Tsuru and A. Osaka, J. Am. Ceram. Soc., 2004, 87, 1635–1642 CrossRef CAS.
- S. M. Gupta and M. Tripathi, Cent. Eur. J. Chem., 2012, 10, 279–294 CAS.
- D. P. Macwan, P. N. Dave and S. Chaturvedi, J. Mater. Sci., 2011, 46, 3669–3686 CrossRef CAS.
- C. L. Bianchi, S. Gatto, C. Pirola, A. Naldoni, A. Di Michele, G. Cerrato, V. Crocella and V. Capucci, Appl. Catal., B, 2014, 146, 123–130 CrossRef.
- J. M. Wu, X. M. Song and M. Yan, J. Hazard. Mater., 2011, 194, 338–344 CrossRef CAS PubMed.
- L. L. Lai, W. Wen and J. M. Wu, CrystEngComm, 2016, 18, 5195–5201 RSC.
- Y. Kondo, H. Yoshikawa, K. Awaga, M. Murayama, T. Mori, K. Sunada, S. Bandow and S. Iijima, Langmuir, 2008, 24, 547–550 CrossRef CAS PubMed.
- H. X. Li, Z. F. Bian, J. Zhu, D. Q. Zhang, G. S. Li, Y. N. Huo, H. Li and Y. F. Lu, J. Am. Chem. Soc., 2007, 129, 8406–8407 CrossRef CAS PubMed.
- N. Q. Fu, Y. Liu, Y. C. Liu, W. Lu, L. M. Zhou, F. Peng and H. T. Huang, J. Mater. Chem. A, 2015, 3, 20366–20374 CAS.
- Z. K. Zheng, B. B. Huang, X. Y. Qin, X. Y. Zhang and Y. Dai, Chem. – Eur. J., 2010, 16, 11266–11270 CrossRef CAS PubMed.
- Y. Yang, Y. Liang, G. Z. Wang, L. L. Liu, C. L. Yuan, T. Yu, Q. L. Li, F. Y. Zeng and G. Gu, ACS Appl. Mater. Interfaces, 2015, 7, 24902–24908 CAS.
- W. Liu, L. Zhang, L. X. Cao, G. Su and Y. G. Wang, J. Alloys Compd., 2011, 509, 3419–3424 CrossRef CAS.
- Y. Wang, H. B. Huang, P. L. Zhao, X. J. Zhao, J. B. Hu, Q. Yu, C. Zou, G. Y. Lu and Y. Xu, CrystEngComm, 2016, 18, 1321–1328 RSC.
- H. Hu, L. Yu, X. H. Gao, Z. Lin and X. W. Lou, Energy Environ. Sci., 2015, 8, 1480–1483 CAS.
- G. M. Kim, S. M. Lee, G. H. Michler, H. Roggendorf, U. Gosele and M. Knez, Chem. Mater., 2008, 20, 3085–3091 CrossRef CAS.
- L. Zhu, M. L. Chen, Y. C. Dong, C. Y. Y. Tang, A. S. Huang and L. L. Li, Water Res., 2016, 90, 277–285 CrossRef CAS PubMed.
- C. Z. Huang and B. Hu, Analyst, 2011, 136, 1425–1432 RSC.
- J. A. Lee, K. C. Krogman, M. L. Ma, R. M. Hill, P. T. Hammond and G. C. Rutledge, Adv. Mater., 2009, 21, 1252–1256 CrossRef CAS.
- D. L. Ma, L. S. Schadler, R. W. Siegel and J. I. Hong, Appl. Phys. Lett., 2003, 83, 1839–1841 CrossRef CAS.
- S. X. Liu and J. H. He, J. Am. Ceram. Soc., 2005, 88, 3513–3514 CrossRef CAS.
- N. Abidi, L. Cabrales and E. Hequet, ACS Appl. Mater. Interfaces, 2009, 1, 2141–2146 CAS.
- W. A. Daoud and J. H. Xin, J. Sol–Gel Sci. Technol., 2004, 29, 25–29 CrossRef CAS.
- J. Y. Zhang, G. C. Xiao, F. X. Xiao and B. Liu, Mater. Chem. Front., 2017, 1, 231–250 RSC.
- M. Z. Ge, C. Y. Cao, J. Y. Huang, S. H. Li, Z. Chen, K. Q. Zhang, S. S. Al-Deyab and Y. K. Lai, J. Mater. Chem. A, 2016, 4, 6772–6801 CAS.
- T. Kokubo, T. Ueda, M. Kawashita, Y. Ikuhara, G. H. Takaoka and T. Nakamura, J. Mater. Sci.: Mater. Med., 2008, 19, 695–702 CrossRef CAS PubMed.
- J. Q. Bai, W. Wen and J. M. Wu, CrystEngComm, 2016, 18, 1847–1853 RSC.
- B. Liu and E. S. Aydil, J. Am. Chem. Soc., 2009, 131, 3985–3990 CrossRef CAS PubMed.
- Q. Tay and Z. Chen, Int. J. Hydrogen Energy, 2016, 41, 10590–10597 CrossRef CAS.
- X. Chen and S. S. Mao, Chem. Rev., 2007, 107, 2891–2959 CrossRef CAS PubMed.
- C. H. Wang, X. T. Zhang, C. L. Shao, Y. L. Zhang, J. K. Yang, P. P. Sun, X. P. Liu, H. Liu, Y. C. Liu, T. F. Xie and D. J. Wang, J. Colloid Interface Sci., 2011, 363, 157–164 CrossRef CAS PubMed.
- H. T. T. Tran, H. Kosslick, M. F. Ibad, C. Fischer, U. Bentrup, T. H. Vuong, L. Q. Nguyen and A. Schulz, Appl. Catal., B, 2017, 200, 647–658 CrossRef CAS.
- G. Busca, G. Ramis, J. M. G. Amores, V. S. Escribano and P. Piaggio, J. Chem. Soc., Faraday Trans., 1994, 90, 3181–3190 RSC.
- B. Li, J. M. Wu, T. T. Guo, M. Z. Tang and W. Wen, Nanoscale, 2014, 6, 3046–3050 RSC.
- J. M. Wu, T. W. Zhang, Y. W. Zeng, S. Hayakawa, K. Tsuru and A. Osaka, Langmuir, 2005, 21, 6995–7002 CrossRef CAS PubMed.
- J. M. Wu and B. Qi, J. Phys. Chem. C, 2007, 111, 666–673 CAS.
- L. L. Lai and J. M. Wu, J. Mater. Chem. A, 2015, 3, 15863–15868 CAS.
- W. Wen, J. M. Wu, Y. Z. Jiang, S. L. Yu, J. Q. Bai, M. H. Cao and J. Cui, Sci. Rep., 2015, 5, 11804 CrossRef PubMed.
- T. Zheng, Z. Tian, B. T. Su and Z. Q. Lei, Ind. Eng. Chem. Res., 2012, 51, 1391–1395 CrossRef CAS.
- P. M. Kumar, S. Badrinarayanan and M. Sastry, Thin Solid Films, 2000, 358, 122–130 CrossRef CAS.
- J. K. Zhou, L. Lv, J. Q. Yu, H. L. Li, P. Z. Guo, H. Sun and X. S. Zhao, J. Phys. Chem. C, 2008, 112, 5316–5321 CAS.
- L. Q. Jing, X. J. Sun, W. M. Cai, Z. L. Xu, Y. G. Du and H. G. Fu, J. Phys. Chem. Solids, 2003, 64, 615–623 CrossRef CAS.
- X. M. Song, J. M. Wu, M. Z. Tang, B. Qi and M. Yan, J. Phys. Chem. C, 2008, 112, 19484–19492 CAS.
- C. B. Almquist and P. Biswas, J. Catal., 2002, 212, 145–156 CrossRef CAS.
- S. H. Szczepankiewicz, A. J. Colussi and M. R. Hoffmann, J. Phys. Chem. B, 2000, 104, 9842–9850 CrossRef CAS.
- H. Xu and L. Z. Zhang, J. Phys. Chem. C, 2009, 113, 1785–1790 CAS.
- Y. L. Liao, W. X. Que, Q. Y. Jia, Y. C. He, J. Zhang and P. Zhong, J. Mater. Chem., 2012, 22, 7937–7944 RSC.
- A. Z. Hu, C. X. Cheng, X. Li, J. Jiang, R. M. Ding, J. H. Zhu, F. Wu, J. P. Liu and X. T. Huang, Nanoscale Res. Lett., 2011, 6, 91 CrossRef PubMed.
Footnote |
| † Electronic supplementary information (ESI) available. See DOI: 10.1039/c7qm00019g |
| This journal is © the Partner Organisations 2017 |

