 Open Access Article
Creative Commons Attribution 3.0 Unported Licence
Nanocasting synthesis of mesoporous SnO2 with a tunable ferromagnetic response through Ni loading†
Junpeng Fana,
Jin Zhanga,
Pau Solsonaa,
Santiago Suriñacha,
Maria Dolors Baróa,
Jordi Sortab and
Eva Pellicer*a
aDepartament de Física, Facultat de Ciències, Universitat Autònoma de Barcelona, E-08193 Bellaterra, Barcelona, Spain. E-mail: Eva.Pellicer@uab.cat
bInstitució Catalana de Recerca i Estudis Avançats (ICREA), Pg. Lluís Companys 23, E-08010 Barcelona, Spain
First published on 27th October 2016
Abstract
Undoped and Ni-doped ordered mesoporous SnO2 powders ([Ni(II)]/[Sn(II)] = 0![[thin space (1/6-em)]](https://www.rsc.org/images/entities/char_2009.gif) :
:![[thin space (1/6-em)]](https://www.rsc.org/images/entities/char_2009.gif) 100, 5
100, 5![[thin space (1/6-em)]](https://www.rsc.org/images/entities/char_2009.gif) :
:![[thin space (1/6-em)]](https://www.rsc.org/images/entities/char_2009.gif) 95, 15
95, 15![[thin space (1/6-em)]](https://www.rsc.org/images/entities/char_2009.gif) :
:![[thin space (1/6-em)]](https://www.rsc.org/images/entities/char_2009.gif) 85, 20
85, 20![[thin space (1/6-em)]](https://www.rsc.org/images/entities/char_2009.gif) :
:![[thin space (1/6-em)]](https://www.rsc.org/images/entities/char_2009.gif) 80) were synthesized by nanocasting from mesoporous KIT-6 silica. The resulting Ni content in the Ni-loaded powders ranged between 1 at% and 9 at%. Successful replication of the silica template was verified by scanning electron microscopies for all samples. Residual silicon content did not surpass 4 at%. X-ray diffraction analyses showed that the powders were nanocrystalline, being the rutile-like phase of SnO2 the dominant structure. Changes in the lattice constants depending on the Ni content were observed, suggesting that Ni enters the rutile structure of SnO2 to some extent. No extra phases attributed to Ni were detected in the powders except for the sample synthesized from 20
80) were synthesized by nanocasting from mesoporous KIT-6 silica. The resulting Ni content in the Ni-loaded powders ranged between 1 at% and 9 at%. Successful replication of the silica template was verified by scanning electron microscopies for all samples. Residual silicon content did not surpass 4 at%. X-ray diffraction analyses showed that the powders were nanocrystalline, being the rutile-like phase of SnO2 the dominant structure. Changes in the lattice constants depending on the Ni content were observed, suggesting that Ni enters the rutile structure of SnO2 to some extent. No extra phases attributed to Ni were detected in the powders except for the sample synthesized from 20![[thin space (1/6-em)]](https://www.rsc.org/images/entities/char_2009.gif) :
:![[thin space (1/6-em)]](https://www.rsc.org/images/entities/char_2009.gif) 80 [Ni(II)]/[Sn(II)], for which NiO as secondary phase was observed. The oxidation state and spatial distribution of Ni in the powders was investigated by X-ray photoelectron spectroscopy (XPS) and electron energy loss spectroscopy (EELS) measurements, respectively. For 6 at% and 9 at% Ni content, the presence of Ni2+ was established. The corresponding EELS mapping showed that a fraction of Ni (the one not forming part of the rutile phase) tended to accumulate at the pore edges, forming a nanometer-thick NiO layer. Compared to undoped SnO2, Ni-containing powders exhibit a ferromagnetic response at low and room temperatures. Uncompensated spins at the surface of NiO are likely to contribute, in part, to the observed ferromagnetic properties.
80 [Ni(II)]/[Sn(II)], for which NiO as secondary phase was observed. The oxidation state and spatial distribution of Ni in the powders was investigated by X-ray photoelectron spectroscopy (XPS) and electron energy loss spectroscopy (EELS) measurements, respectively. For 6 at% and 9 at% Ni content, the presence of Ni2+ was established. The corresponding EELS mapping showed that a fraction of Ni (the one not forming part of the rutile phase) tended to accumulate at the pore edges, forming a nanometer-thick NiO layer. Compared to undoped SnO2, Ni-containing powders exhibit a ferromagnetic response at low and room temperatures. Uncompensated spins at the surface of NiO are likely to contribute, in part, to the observed ferromagnetic properties.
Introduction
Both architecture and specific surface area are known to significantly impact the properties of materials. Indeed, exploiting the different pathways for which material architecture (or geometry) can be precisely controlled is one of the most attractive topics in materials science and, more recently, in nanoscale materials science. To date, many synthetic approaches have been devised and novel nanomaterials with different morphologies and structures have been prepared.1,2 Among them, mesoporous materials (with pore sizes ranging from 2 nm to 50 nm) have captured wide attention due to the occurrence of internal connecting channels forming a network and their resulting large specific surface area. Thanks to their favourable architecture, mesoporous materials can show outstanding catalytic properties,3–5 excellent optoelectronic effects,6,7 visible fluorescence8 and gas storage capabilities,9 to name a few. Different methods such as sol–gel,10,11 self-assembly,12 dealloying,13,14 and nanocasting15 are currently employed to obtain mesoporous products. Compared with other approaches, nanocasting is the preferred choice to prepare ordered mesoporous powders because the characteristics of the parent template, typically mesoporous silica or carbon, can be tailored on-demand by changing the type of precursor and its concentration, heat treatment temperature, and reaction time.16 The morphology of the replica is determined to a great extent by the characteristics of the pre-fabricated template (pore topology, pore size, pore wall, and surface area).Transition metal oxides are exciting materials with a wide range of technological uses in optoelectronic devices, superconductors, chemo-resistive gas sensors, and field emitting devices. Among metal oxides, tin dioxide (SnO2), with a large band gap (Eg = 3.6 eV at 300 K), is an important n-type semiconductor. SnO2 powders with mesoporous characteristics were firstly prepared by Ulagappan and Rao.17 Since then, mesoporous SnO2 has attracted significant attention because of its large specific surface area, thermal stability, and potential applications in different fields. Dimitrov et al. found that mesoporous SnO2 prepared by sol–gel exhibited significant catalytic activity toward ethyl acetate oxidation and high selectivity towards CO2.18 Hossain et al. successfully synthesized mesoporous SnO2 spheres, with different sizes, by electrochemical anodization followed by aging. The resulting SnO2 spheres were applied in CdSe-sensitized solar cells as a photoanode material.19 According to Qi and co-workers, the large surface area and highly active surface of mesoporous SnO2 nanospheres endowed effective binding of phosphopeptides.20
Doping oxide semiconductors with transition or noble metals can enhance the properties of these materials or even provide them with new functionalities. For instance, mesoporous Ag-doped SnO2 synthesized by nanocasting from SBA-15 silica showed enhanced humidity sensing performance.21 Likewise, transition metal-doped mesoporous CeO2 nanoparticles exhibited enhanced catalytic activity for CO oxidation.22 Recently, Co-, Fe- and Mn-doped In2O3 mesoporous powders have been reported to show room temperature ferromagnetic properties, hence constituting mesoporous oxide-diluted magnetic semiconductors (MODMS).23 Actually, since the prediction of room-temperature ferromagnetic (RTFM) response in Mn-doped ZnO,24 great efforts have been devoted toward the preparation of oxide-diluted magnetic semiconductors by doping wide band gap semiconductors with transition metal cations. Many groups have reported the occurrence of RTFM in nanowires,25,26 thin films27 and nanoparticles28 by controllably doping semiconductor matrices made of TiO2, ZnO, In2O3 and CaO with suitable transition metals. However, the occurrence of RTFM in MODMS has been very scarcely reported. The magnetic behavior of MODMS can be tuned by adjusting the transition metal doping level and the amount of oxygen vacancies.23 Secondary phases (i.e., TMxOy where TM = transition metal) were actually found to also play a role on the magnetic properties, even though the secondary phases are typically antiferromagnetic (AFM) transition metal oxides. Nonetheless, AFM materials are encountering a renewed interest in spintronics, beyond their use in spin valves or tunnelling junction architectures, as essential elements in spin-transfer torque devices or encrypted magnetic memories.29,30
In this paper, the preparation of magnetically active mesoporous Ni-doped SnO2 powders by means of nanocasting is presented. Notably, only Ag and Pd have been used as dopants in mesoporous SnO2, and mostly for the purpose to improve its gas-sensing capabilities.21,31 The replicas derived from KIT-6 silica show long-range order and feature low amounts of residual silicon. Different characterization methods have been used to investigate the morphology, crystallographic structure, and the oxidation state and distribution of Ni in the samples, namely by electron microscopies, X-ray diffraction (XRD) and X-ray photoelectron spectroscopy (XPS). The occurrence of ferromagnetism has been investigated by magnetometry. Interestingly, appropriate doping of SnO2 leads to an interesting ferromagnetic behaviour, both at low and room temperatures, whereas undoped SnO2 does not show any ferromagnetic response regardless of the measuring temperature. For sufficiently high Ni doping level, the formation of a NiO nanocoating, surrounding the SnO2 pore walls, is observed. By adjusting the thickness of this nanocoating, the ferromagnetic properties can be tailored. Larger saturation magnetization is observed for relatively thin NiO coatings, where the amount of surface uncompensated spins in NiO is maximized. This corresponds to intermediate Ni2+ doping concentration. For higher Ni2+ content, the thickness of the NiO coating increases and the saturation magnetization decreases, as the relative contribution of uncompensated spins to the ferromagnetic-like behaviour is reduced.
Experimental section
Synthesis of silica template
KIT-6 silica was chosen as the hard template to prepare mesoporous undoped and Ni-doped SnO2. All the reagents were purchased from Sigma-Aldrich and used without further purification. In a typical synthesis, P-123 (6 g) was dissolved in a mixture of deionized water (220 g) acidified with 37 wt% HCl (12 g) by vigorous stirring (300 rpm) at 35 °C for 4 h. Then, 1-butanol (6 g) was added into the solution whilst stirring for another hour. Thereafter, 12.49 g of tetraethyl orthosilicate (TEOS) as the silicon source were added drop by drop into the solution and stirred for 24 h at the same temperature. The reaction vessel (sealed) was introduced in an oven at 80 °C for 24 h under static conditions. After the hydrothermal treatment, the resulting suspension was filtered and washed with deionized water several times. Finally, the collected powder was calcined in a tubular furnace at 550 °C under air flowing for 4 h.Synthesis of undoped and Ni-doped mesoporous SnO2
SnCl2·2H2O (stannous chloride dihydrate, Sigma-Aldrich 99.99%) was used as SnO2 precursor. Firstly, KIT-6 silica (0.4 g), SnCl2·2H2O (0.6 g) and different amounts of NiCl2 (nickel chloride, Sigma-Aldrich 99.99%) were finely ground in an agate mortar and pestle. The nominal [Ni(II)]/[Sn(II)] ratios used in the synthesis are listed in Table 1. The mixture was placed in a crucible and heated up to 85 °C inside a vacuum furnace (pressure < 10−4 mbar) to promote the infiltration of tin and nickel precursors within the KIT-6 silica host.32,33 After 24 h, the samples were taken out and transferred into a tubular furnace for high temperature solid state reaction under air atmosphere. The temperature and heat treatment time were set at 700 °C and 2 h, respectively. Following the conversion of tin and nickel precursors, the silica template was selectively etched away using 1 M NaOH aqueous solution. Finally, sample powders were cleaned with deionized water and dried in oven.| [Ni(II)]/[Sn(II)] | Ni nominal content (%) | Ni determined by EDX (%) | Si determined by EDX (%) | Crystallite size SnO2 phase (nm) (±0.5) | Microstrains of SnO2 phase (±1 × 10⁻⁵) | a (Å) of SnO2 phase (±1 × 10⁻⁴) | c (Å) of SnO2 phase (±1 × 10⁻⁴) |
|---|---|---|---|---|---|---|---|
0![[thin space (1/6-em)]](https://www.rsc.org/images/entities/char_2009.gif) : :![[thin space (1/6-em)]](https://www.rsc.org/images/entities/char_2009.gif) 100 100 |
0 | 0 | 2 | 8.5 | 1.8 × 10⁻⁴ | 4.7385 | 3.1885 |
5![[thin space (1/6-em)]](https://www.rsc.org/images/entities/char_2009.gif) : :![[thin space (1/6-em)]](https://www.rsc.org/images/entities/char_2009.gif) 95 95 |
2 | 1 | 4 | 8.1 | 3.5 × 10⁻³ | 4.7397 | 3.1875 |
15![[thin space (1/6-em)]](https://www.rsc.org/images/entities/char_2009.gif) : :![[thin space (1/6-em)]](https://www.rsc.org/images/entities/char_2009.gif) 85 85 |
5 | 6 | 3 | 9.2 | 3.4 × 10⁻³ | 4.7428 | 3.1854 |
20![[thin space (1/6-em)]](https://www.rsc.org/images/entities/char_2009.gif) : :![[thin space (1/6-em)]](https://www.rsc.org/images/entities/char_2009.gif) 80 80 |
7 | 9 | 3 | 10.6 | 3.7 × 10⁻³ | 4.7416 | 3.1846 |
Characterization of materials
Scanning and transmission electron microscopies (SEM and TEM, respectively) were used to investigate the morphology and microstructure of the powders. SEM observations were carried out on a Zeiss Merlin microscope operated at 3 keV whereas TEM analyses were performed on a Jeol-JEM 2011 operated at 200 kV. For the latter, the powders were dispersed in ethanol through sonication in an ultrasonic bath for 5 min. Then a few drops of the suspension were placed dropwise onto holey carbon TEM Cu grids. Electron energy loss spectroscopy (EELS) analyses were performed on a Tecnai F20 HRTEM/STEM microscope. Wide-angle X-ray diffraction (XRD patterns) were recorded on a PANalytical X'Pert Powder diffractometer equipped with Cu Kα radiation (λ = 0.154 nm) in the 20° to 80° 2θ range with step time of 0.78 s and step size of 0.026°. Rietveld refinements of the XRD full-patterns using the “Materials Analysis using Diffraction” (MAUD) software34 were performed to extract the values of crystallite size, microstrains and lattice parameters as a function of Ni doping. The chemical composition and actual concentration of Ni in the doped SnO2 powders were determined by energy dispersive X-ray spectroscopy (EDX) coupled to the SEM. Contents are given in at% throughout the manuscript and correspond to the averaging of minimum three independent measurements. XPS analyses (PHI 5500 Multitechnique System) were carried out with a monochromatic X-ray source (Kα Al line of 1486.6 eV energy and 350 W) under ultra-high vacuum (UHV), with pressure between 5 × 10⁻⁹ and 2 × 10⁻⁸ Torr, placed perpendicular to the analyser axis and calibrated using the 3d5/2 line of Ag with a full width at half maximum (FWHM) of 0.8 eV. The analysed area was a circle of 0.8 mm diameter for each sample. Peaks were charge corrected to adventitious C 1s set to 284.50 eV.35 Experimental core-level spectra were fitted using Gaussian curves. Magnetic hysteresis loops were acquired on a superconducting quantum interference device (SQUID) at cryogenic (10 K) and room (300 K) temperatures.Results and discussion
Morphology and crystallographic structure of undoped and Ni-doped SnO2
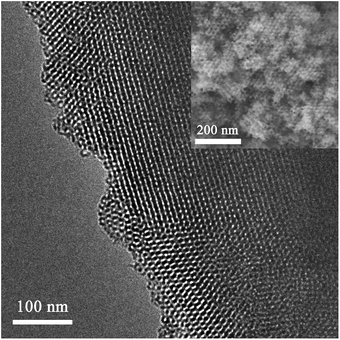
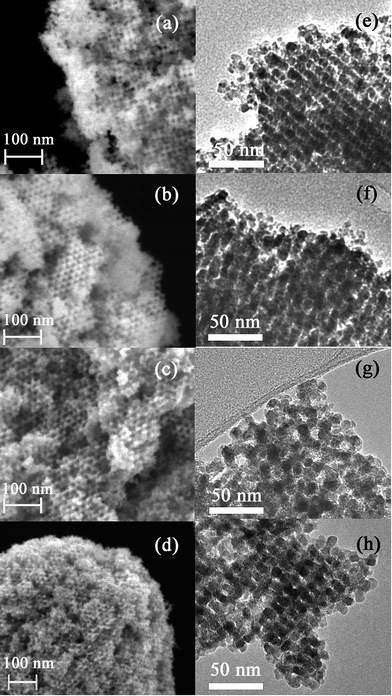
Prior to the synthesis of the SnO2-based replicas, the morphology of KIT-6 silica template was examined. A representative TEM image of the bicontinuous cubic SiO2 matrix is shown in Fig. 1. The quality of the template was judged as acceptable and pore size was estimated to be around 10 nm. The morphology of the derived SnO2-based powders is depicted in Fig. 2. Both SEM (Fig. 2(a–d)) and TEM (Fig. 2(e–h)) images indicated that the powders exhibit an ordered arrangement of mesopores irrespective of the Ni loading. Indeed, the level of doping did not seemingly have a deleterious impact on the mesostructure of the SnO2 replica. Relatively large ordered mesoporous domains were visible at the surface of the mesoporous particles by SEM.Representative EDX patterns are shown for undoped and Ni-doped SnO2 in Fig. 3a and b, respectively. The amounts of Ni and Si for all samples are listed in Table 1. For the doped powders, it was clear that Ni was successfully loaded into the SnO2 matrix. The highest deviation (ca. 2%) between the nominal and actual Ni percentage was found for the sample with the highest dopant amount. Nevertheless, considering that the error in EDX measurements is about 1 at%, this is not a significant difference. Residual silicon content was kept below 4% in all cases. Probably the formation of strong Si–O–Sn bonds precludes a complete removal of the silica host, compared to other transition metal oxides. Si and Sn belong to IV-group elements; they possess the same number of outermost electrons and, in turn, similar chemical properties. In fact, SnO2/SiO2 composites can be simply obtained by solid–vapour reaction of mesoporous silica with tin vapour at 700 °C.36 In this work, authors detected Sn4+ bonded to the silica wall by bridged oxygen atoms. Nevertheless, our residual silicon amounts can be regarded as fairly low. This was possible through two consecutive cleaning steps of the SiO2@SnO2 composites with large volumes of NaOH solution to etch the silica template. Besides the formation of Si–O–Sn bonds, the presence of numerous nanochannels in the interior of the mesoporous particles likely hampers the effective dissolution of the silica host as the etching solution has to reach their inner space. Complementary XPS analyses indicated that although Si was present in all samples, its content was much lower than that determined by EDX. According to XPS analyses, the highest Si amount detected in the powders was 0.7%. Since XPS is a surface-sensitive technique, the detection of a larger amount of Si by EDX indeed suggests that the residual silicon is mainly concentrated in the inner cavities of the SnO2 particles.
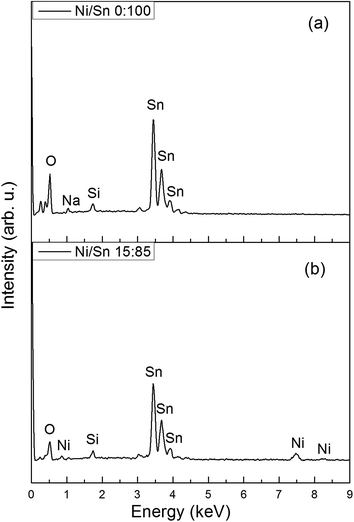 | ||
Fig. 3 EDX patterns of (a) undoped and (b) Ni-doped mesoporous SnO2 obtained from [Ni(II)]/[Sn(II)] molar ratio of 15![[thin space (1/6-em)]](https://www.rsc.org/images/entities/char_2009.gif) : :![[thin space (1/6-em)]](https://www.rsc.org/images/entities/char_2009.gif) 85. 85. | ||
As shown in Fig. 4, all the samples are nanocrystalline. The main peak positions of the undoped and Ni-doped SnO2 samples correspond to the rutile type tetragonal structure (JCPDS card no. 88-0287). No extra peaks are observed except for the sample produced from [Ni(II)]/[Sn(II)] of 20![[thin space (1/6-em)]](https://www.rsc.org/images/entities/char_2009.gif) :
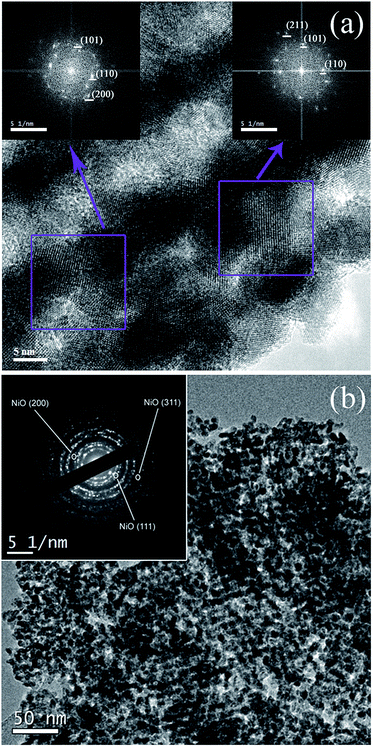
:![[thin space (1/6-em)]](https://www.rsc.org/images/entities/char_2009.gif) 80. In this case, additional diffraction peaks attributed to NiO are observed, which match those of JCPDS card no. 47-1049. Notice that these peaks are much narrower since a few big NiO particles had grown outside the mesoporous SnO2 particles, as observed by TEM (not shown). Chaudhary and co-workers detected the formation of NiO in nanocrystalline thick SnO2 films with Ni contents beyond 5%,37 which is in agreement with our findings. The crystallite size of the SnO2 phase, together with the microstrains and cell parameters, were calculated using MAUD. The calculated values are listed in Table 1. In broader strokes, both crystallite size and microstrains increased with the Ni doping although not in a monotonous manner. Crystallite size slightly decreased for the sample with the lowest Ni amount but increased thereafter. The level of microstrains rose significantly when SnO2 was doped with 1% and then remained fairly constant for higher loadings. The “a” and “c” lattice parameters increased and decreased, respectively, with the Ni doping level, in agreement with other works.38 Fig. 5(a) is a HRTEM image of the 6%-doped SnO2 powder. The SnO2 skeleton consist of nanocrystals of about 5 nm in diameter, in agreement with XRD and other works in the literature.39 The fast Fourier transform (FFT) of selected regions in the image shows spots whose interplanar distance matches tetragonal SnO2. Selected area electron diffraction (SAED) analyses of the sample doped with higher Ni amount (9%) showed spots attributed to the NiO phase (Fig. 5(b)). In such a case, only the electron diffraction coming out from mesoporous particles was captured, avoiding the response of any big NiO crystal nearby.
80. In this case, additional diffraction peaks attributed to NiO are observed, which match those of JCPDS card no. 47-1049. Notice that these peaks are much narrower since a few big NiO particles had grown outside the mesoporous SnO2 particles, as observed by TEM (not shown). Chaudhary and co-workers detected the formation of NiO in nanocrystalline thick SnO2 films with Ni contents beyond 5%,37 which is in agreement with our findings. The crystallite size of the SnO2 phase, together with the microstrains and cell parameters, were calculated using MAUD. The calculated values are listed in Table 1. In broader strokes, both crystallite size and microstrains increased with the Ni doping although not in a monotonous manner. Crystallite size slightly decreased for the sample with the lowest Ni amount but increased thereafter. The level of microstrains rose significantly when SnO2 was doped with 1% and then remained fairly constant for higher loadings. The “a” and “c” lattice parameters increased and decreased, respectively, with the Ni doping level, in agreement with other works.38 Fig. 5(a) is a HRTEM image of the 6%-doped SnO2 powder. The SnO2 skeleton consist of nanocrystals of about 5 nm in diameter, in agreement with XRD and other works in the literature.39 The fast Fourier transform (FFT) of selected regions in the image shows spots whose interplanar distance matches tetragonal SnO2. Selected area electron diffraction (SAED) analyses of the sample doped with higher Ni amount (9%) showed spots attributed to the NiO phase (Fig. 5(b)). In such a case, only the electron diffraction coming out from mesoporous particles was captured, avoiding the response of any big NiO crystal nearby.
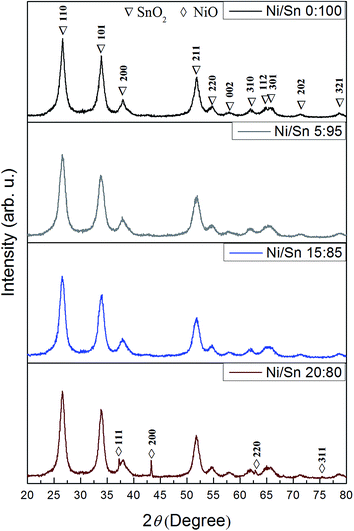 | ||
| Fig. 4 XRD patterns of undoped and Ni-doped mesoporous SnO2 obtained from varying [Ni(II)]/[Sn(II)] molar ratios. | ||
In order to confirm the mesoporous long-range order of the samples, low-angle XRD analysis was carried out. Fig. 6 shows representative patterns of mesoporous KIT-6 silica, undoped SnO2 and 6% Ni-doped SnO2. The KIT-6 silica shows two well-resolved reflections attributable to (211) and (220) reflections. However, different from previous works,32,40 the intensity of (211) peak is weaker than (220). After replication the peaks become inconspicuous, suggesting a partial loss of the long-range mesoporous order and concomitant decrease of the size of the ordered domains.
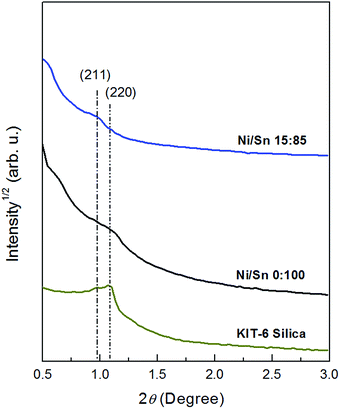 | ||
Fig. 6 Low-angle XRD patterns corresponding to KIT-6 silica template and mesoporous replicas obtained from [Ni(II)]/[Sn(II)] molar ratio 0![[thin space (1/6-em)]](https://www.rsc.org/images/entities/char_2009.gif) : :![[thin space (1/6-em)]](https://www.rsc.org/images/entities/char_2009.gif) 100 and 15 100 and 15![[thin space (1/6-em)]](https://www.rsc.org/images/entities/char_2009.gif) : :![[thin space (1/6-em)]](https://www.rsc.org/images/entities/char_2009.gif) 85. 85. | ||
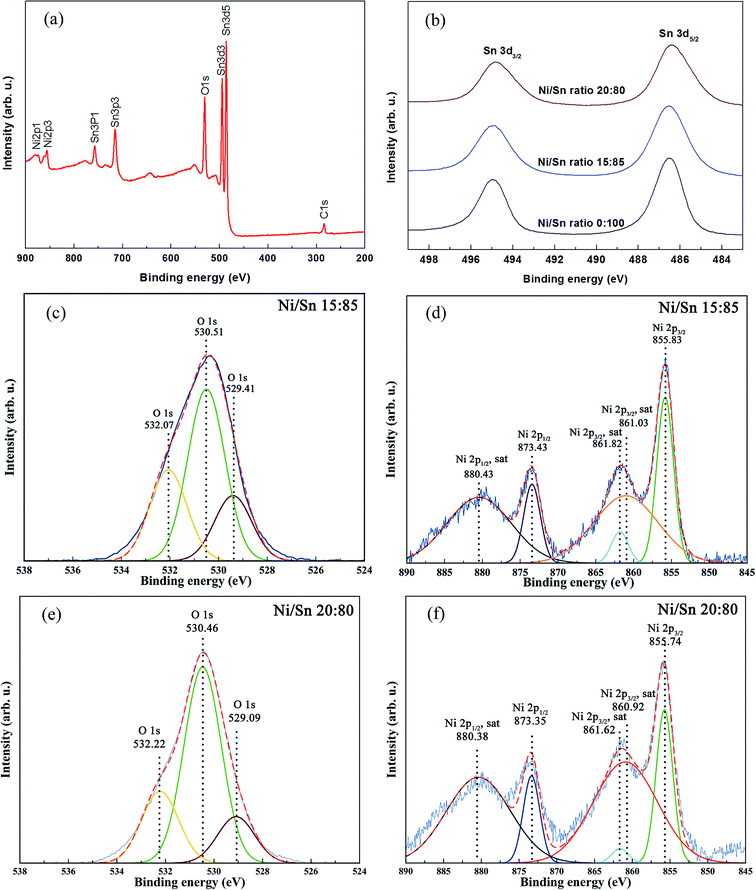
The samples with 6% and 9% Ni were subjected to XPS characterization to determine the oxidation state and the local chemical environment of the Ni element. At the same time, the effects induced by Ni to the SnO2 matrix were investigated. Undoped SnO2 was taken as the reference sample. Fig. 7(a) shows the XPS survey spectrum of the sample with 6% Ni. Sn 3d high resolution XPS spectra are displayed in Fig. 7(b). Upon Ni doping, Sn 3d peaks shift toward lower binding energy compared with undoped SnO2. It is conjectured that a larger number of oxygen vacancies and dangling bonds arise in the SnO2 skeleton due to the introduction of Ni.41 As a result, the relative number of electrons in the external electronic shell of Sn increases, which in turn causes a decrease of the binding energy of Sn compared to the undoped case.
The O 1s and Ni 2p XPS spectral windows of 6% Ni-doped SnO2 are shown in Fig. 7(c) and (d), respectively. The O 1s spectrum can be deconvoluted into three main bands. The peaks at 530.51 eV and 529.41 eV correspond to the O 1s core level of the O2− anions in the SnO2 and NiO, respectively.42–44 The peak at 532.07 eV is possibly attributed to chemisorbed oxygen at the defect sites of oxide crystal45 or hydroxyl groups.44
In Fig. 7(d), the separation distance between the peaks at 855.83 eV and 873.43 eV, which matches the binding energies expected for Ni 2p3/2 and Ni 2p1/2, is 17.60 eV. This difference is broader than the binding energy difference for metallic nickel, which is around 17.30 eV.46 Furthermore, the position of the peaks exhibit some shift to higher binding energy compared with Ni0.47,48 This result excludes the occurrence of metallic Ni clusters in the 6% Ni-doped SnO2. Based on the analysis, Ni ions possess a chemical valence of 2+. Experimental binding energies for Sn and O also indicate that their valences are 4+ and 2−, respectively. The O 1s and Ni 2p spectra for the sample with 9% Ni is very similar to that of 6% Ni (Fig. 7(e) and (f)), so the same reasoning applies.
EELS characterization
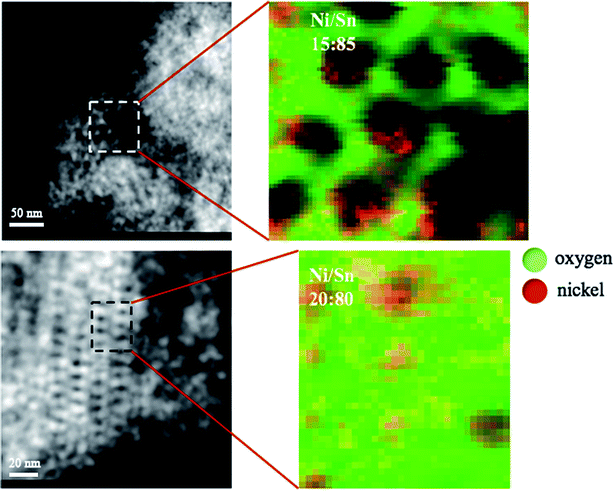
Taking into account the results previously obtained, the powder with 6% Ni (for which NiO phase was not detected in the XRD pattern but XPS data indicated it was definitely present) and that with 9% Ni (for which NiO as a secondary phase was clearly detected by XRD) were selected for EELS characterization. The goal was to investigate the spatial distribution of Ni in order to get further insight into the structural and magnetic characteristics of these two opposed samples. Fig. 8 shows the STEM and corresponding EELS mapping of a selected region for both cases. For the sample with the lower Ni content, Ni is detected mostly near the pore edges forming a kind of nanocoating, although red coloured pixels superimposed to the green background are also observed at the inner region of the pore walls. For the sample with 9% Ni, a larger amount of Ni concentrated at the pore region was seemingly found. Orange coloured pixels result from the mixing of red (Ni) and green (O) colours. Nevertheless, the presence of big NiO particles outside the mesoporous particles should not be omitted in this case. When the amount of Ni largely exceeds the solubility limit, part of it can form the NiO skin around the pores but another fraction cannot be hosted and forms separate crystals outside. Although the coating surrounding the pores looks redder in the sample with 6% Ni, this does not mean it is made of metallic Ni. The pixels are not 100% red and indeed the L3/L2 ratio calculated from the EELS spectra taken at this region gives a value of 2.8 (see ESI, Fig. S1†), hence closer to NiO (for which the ratio is 3) than metallic Ni (for which the ratio is 1.5). This is in agreement with XPS analyses and, in fact, it makes sense considering that the conversion of precursors was carried out by heat-treatment in air.In any case, the fact that NiO tends to accumulate at the pore/air interface makes the nanocasting route appealing toward ordered mesoporous nanocomposites. Actually, partial coating of mesoporous oxides has been reported in recent years by using successive impregnation and calcination procedures with different precursors.49 Here, oxide semiconductor (SnO2)/antiferromagnetic (NiO) nanocomposites are obtained in situ in one-step nanocasting process.
Magnetic properties of Ni-doped SnO2 powders
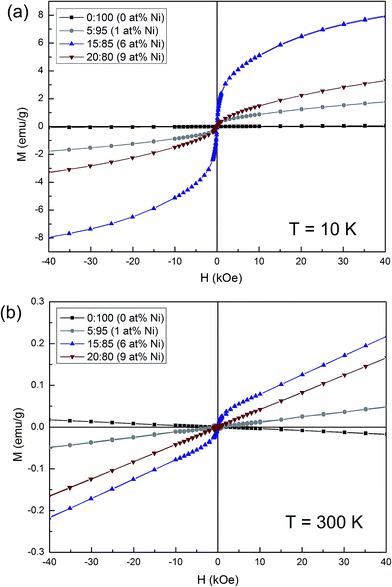
The magnetic properties of the samples with varying Ni concentration were studied by acquiring hysteresis loops at 10 K and 300 K. The undoped SnO2 exhibits inconspicuous paramagnetic behaviour at 10 K and typical diamagnetic behaviour at 300 K (Fig. 9). Meanwhile, the Ni-doped samples show a clear ferromagnetic signal at both temperatures although the saturation magnetization (MS) does not scale with the Ni amount. The sample with 6% Ni possesses the largest MS both at 10 K (5.88 emu g−1) and 300 K (0.05 emu g−1). A reduction of the MS values is observed for the sample with 9 at% Ni. The ferromagnetic response observed in the Ni-containing powders is likely due to two contributions: (i) doping with the transition metal and concomitant formation of oxygen vacancies,50 and (ii) uncompensated spins at the surface of the NiO nanocoating.51,52 Notice that NiO is an antiferromagnet in bulk form, with a Néel temperature of 520 K.53,54 However, it has been described that when the size of NiO decreases so that it falls well in the nanosize domain (e.g. nanoparticles), it might exhibit a ferromagnetic signal due to the presence of uncompensated spins at their surface. This would explain why MS is higher in the sample with 6% than for 9% Ni. For the former, a larger amount of uncompensated spins is expected from the very thin layer surrounding the SnO2 pores. Meanwhile, for the latter, as the size of the NiO nanoparticles/nanoclusters has increased, the number of uncompensated spins decreases and so does the corresponding MS.Conclusions
In summary, we have successfully synthesized ordered mesoporous Ni-doped SnO2 powders with tunable room-temperature ferromagnetic response as a function of the Ni loading. The optimum [Ni(II)]/[Sn(II)] molar ratio to guarantee the formation of a fully mesoporous product with the highest MS is 15![[thin space (1/6-em)]](https://www.rsc.org/images/entities/char_2009.gif) :
:![[thin space (1/6-em)]](https://www.rsc.org/images/entities/char_2009.gif) 85. This corresponds to a Ni content of 6%. At larger [Ni(II)]/[Sn(II)] molar ratio, the growth of a few NiO crystals outside the mesoporous structure could not be avoided. XRD analyses revealed that all samples possess the SnO2 rutile structure irrespective of the Ni amount. Meanwhile, 2+ was the oxidation state of Ni, according to XPS data. Although dissolution of Ni ions in the SnO2 lattice was proven by XRD, EELS analyses indicated that part of the dopant ions tended to accumulate at the pore edges. Hence, the observed room-temperature ferromagnetic response is attributed to both the Ni doping and the concomitant formation of oxygen vacancies, and to the occurrence of uncompensated spins at the surface of the NiO nanocoating. The present work demonstrates that by carefully controlling the doping level, ordered mesoporous semiconductor/antiferromagnetic nanocomposites can be obtained through one-step nanocasting process.
85. This corresponds to a Ni content of 6%. At larger [Ni(II)]/[Sn(II)] molar ratio, the growth of a few NiO crystals outside the mesoporous structure could not be avoided. XRD analyses revealed that all samples possess the SnO2 rutile structure irrespective of the Ni amount. Meanwhile, 2+ was the oxidation state of Ni, according to XPS data. Although dissolution of Ni ions in the SnO2 lattice was proven by XRD, EELS analyses indicated that part of the dopant ions tended to accumulate at the pore edges. Hence, the observed room-temperature ferromagnetic response is attributed to both the Ni doping and the concomitant formation of oxygen vacancies, and to the occurrence of uncompensated spins at the surface of the NiO nanocoating. The present work demonstrates that by carefully controlling the doping level, ordered mesoporous semiconductor/antiferromagnetic nanocomposites can be obtained through one-step nanocasting process.
Acknowledgements
This work has been partially funded by the 2014-SGR-1015 project from the Generalitat de Catalunya, the MAT2014-57960-C3-1-R (co-financed by the Fondo Europeo de Desarrollo Regional, FEDER) from the Spanish Ministerio de Economía y Competitividad (MINECO) and the SPIN-PORICS 2014-Consolidator Grant from the European Research Council (Grant Agreement 648454). J. F. and J. Z. acknowledge the China Scholarship Council (CSC) for their PhD grants (201406220145 and 201306250050). Dr Eva Pellicer is grateful to MINECO for the “Ramon y Cajal” contract (RYC-2012-10839).References
- P. Chetri, P. Basyach and A. Choudhury, J. Solid State Chem., 2014, 220, 124–131 CrossRef CAS.
- C. T. Kresge and W. J. Roth, Chem. Soc. Rev., 2013, 42, 3663–3670 RSC.
- L. Zhang and Y. Yin, Sens. Actuators, B, 2013, 185, 594–601 CrossRef CAS.
- E. Pellicer, E. Menéndez, J. Fornell, J. Nogués, A. Vantomme, K. Temst and J. Sort, J. Phys. Chem. C, 2013, 117, 17084–17091 CAS.
- T. Grewe, X. Deng, C. Weidenthaler, F. Schüth and H. Tüysüz, Chem. Mater., 2013, 25, 4926–4935 CrossRef CAS.
- D. Chandra, S. Mridha, D. Basak and A. Bhaumik, Chem. Commun., 2009, 2384–2386 RSC.
- E. J. W. Crossland, N. Noel, V. Sivaram, T. Leijtens, J. A. Alexander-Webber and H. J. Snaith, Nature, 2013, 495, 215–219 CrossRef CAS PubMed.
- M. Guerrero, S. Pané, B. J. Nelson, M. D. Baró, M. Roldán, J. Sort and E. Pellicer, Nanoscale, 2013, 5, 12542–12550 RSC.
- E. Kockrick, C. Schrage, L. Borchardt, N. Klein, M. Rose, I. Senkovska and S. Kaskel, Carbon, 2010, 48, 1707–1717 CrossRef CAS.
- K. Niesz, P. Yang and G. A. Somorjai, Chem. Commun., 2005, 1986–1987 RSC.
- B. G. Trewyn, I. I. Slowing, S. Giri, H.-T. Chen and V. S.-Y. Lin, Acc. Chem. Res., 2007, 40, 846–853 CrossRef CAS PubMed.
- S. C. Warren, L. C. Messina, L. S. Slaughter, M. Kamperman, Q. Zhou, S. M. Gruner, F. J. DiSalvo and U. Wiesner, Science, 2008, 320, 1748–1752 CrossRef CAS PubMed.
- J. Erlebacher, M. J. Aziz, a. Karma, N. Dimitrov and K. Sieradzki, Nature, 2001, 410, 450–453 CrossRef CAS PubMed.
- Q. B. Zhang, A. P. Abbott and C. Yang, Phys. Chem. Chem. Phys., 2015, 17, 14702–14709 RSC.
- A. H. Lu and F. Schüth, Adv. Mater., 2006, 18, 1793–1805 CrossRef CAS.
- Y. Jun, Y. Jung and J. Cheon, J. Am. Chem. Soc., 2002, 124, 615–619 CrossRef CAS PubMed.
- N. Ulagappan and C. N. R. Rao, Chem. Commun., 1996, 1685–1686 RSC.
- M. Dimitrov, T. Tsoncheva, S. Shao and R. Köhn, Appl. Catal., B, 2010, 94, 158–165 CrossRef CAS.
- M. A. Hossain, G. Yang, M. Parameswaran, J. R. Jennings and Q. Wang, J. Phys. Chem. C, 2010, 114, 21878–21884 CAS.
- L. Li, S. Chen, L. Xu, Y. Bai, Z. Nie, H. Liu and L. Qi, J. Mater. Chem. B, 2014, 2, 1121–1124 RSC.
- V. K. Tomer and S. Duhan, Sens. Actuators, B, 2016, 223, 750–760 CrossRef CAS.
- J. Zhang, J. Guo, W. Liu, S. Wang, A. Xie, X. Liu, J. Wang and Y. Yang, Eur. J. Inorg. Chem., 2015, 2015, 969–976 CrossRef CAS.
- E. Pellicer, M. Cabo, E. Rossinyol, P. Solsona, S. Suriñach, M. D. Baró and J. Sort, Adv. Funct. Mater., 2013, 23, 900–911 CrossRef CAS.
- T. Dietl, Science, 2000, 287, 1019–1022 CrossRef CAS PubMed.
- S. A. Aravindh, U. Schwingenschloegl and I. S. Roqan, J. Appl. Phys., 2014, 116, 233906 CrossRef.
- W. Wan, J. Huang, L. Zhu, L. Hu, Z. Wen, L. Sun and Z. Ye, CrystEngComm, 2013, 15, 7887–7894 RSC.
- J. Zhang, Q. Yun and Q. Wang, Mod. Appl. Sci., 2010, 4, 124–130 CAS.
- B. Choudhury and A. Choudhury, J. Appl. Phys., 2013, 114, 203906 CrossRef.
- A. H. MacDonald and M. Tsoi, Philos. Trans. R. Soc., A, 2011, 369, 3098–3114 CrossRef CAS PubMed.
- T. Jungwirth, X. Marti, P. Wadley and J. Wunderlich, Nat. Nanotechnol., 2016, 11, 231–241 CrossRef CAS PubMed.
- J. Zhao, W. Wang, Y. Liu, J. Ma, X. Li, Y. Du and G. Lu, Sens. Actuators, B, 2011, 160, 604–608 CrossRef CAS.
- J. K. Shon, S. S. Kong, Y. S. Kim, J. H. Lee, W. K. Park, S. C. Park and J. M. Kim, Microporous Mesoporous Mater., 2009, 120, 441–446 CrossRef CAS.
- E. Ramasamy and J. Lee, J. Phys. Chem. C, 2010, 114, 22032–22037 CAS.
- L. Lutterotti, S. Matthies and H.-R. Wenk, IUCr Newsletter (International Union of Crystallography), 1999, 21, 15 Search PubMed.
- H. Estrade-Szwarckopf and B. Rousseau, J. Phys. Chem. Solids, 1992, 53, 419–436 CrossRef CAS.
- Z. C. Liu, H. R. Chen, W. M. Huang, J. L. Gu, W. B. Bu, Z. L. Hua and J. L. Shi, Microporous Mesoporous Mater., 2006, 89, 270–275 CrossRef CAS.
- D. K. Pandya, K. Gopinadhan, S. C. Kashyap and S. Chaudhary, Synth. React. Inorg., Met.-Org., Nano-Met. Chem., 2008, 38, 162–167 CAS.
- P. P. Dorneanu, A. Airinei, M. Grigoras, N. Fifere, L. Sacarescu, N. Lupu and L. Stoleriu, J. Alloys Compd., 2016, 668, 65–72 CrossRef.
- S. Lepoutre, J. H. Smått, C. Laberty, H. Amenitsch, D. Grosso and M. Lindén, Microporous Mesoporous Mater., 2009, 123, 185–192 CrossRef CAS.
- T. Waitz, B. Becker, T. Wagner, T. Sauerwald, C. D. Kohl and M. Tiemann, Sens. Actuators, B, 2010, 150, 788–793 CrossRef CAS.
- D. L. Hou, H. J. Meng, L. Y. Jia, X. J. Ye, H. J. Zhou and X. L. Li, Phys. Lett. A, 2007, 364, 318–322 CrossRef CAS.
- M. Kwoka, L. Ottaviano, M. Passacantando, S. Santucci, G. Czempik and J. Szuber, Thin Solid Films, 2005, 490, 36–42 CrossRef CAS.
- A. Thøgersen, M. Rein, E. Monakhov, J. Mayandi and S. Diplas, J. Appl. Phys., 2011, 109, 113532 CrossRef.
- B. P. Payne, M. C. Biesinger and N. S. McIntyre, J. Electron Spectrosc. Relat. Phenom., 2009, 175, 55–65 CrossRef CAS.
- I. S. Mulla, V. J. Rao, H. S. Soni, S. Badrinarayanan and A. P. B. Sinha, Surf. Coat. Technol., 1987, 31, 77–88 CrossRef CAS.
- A. D. Vogt, T. Han and T. P. Beebe, Langmuir, 1997, 13, 3397–3403 CrossRef CAS.
- A. Lebugle, U. Axelsson, R. Nyholm and N. Mårtensson, Phys. Scr., 1981, 23, 825 CrossRef CAS.
- M. C. Biesinger, B. P. Payne, L. W. M. Lau, A. Gerson and R. S. C. Smart, Surf. Interface Anal., 2009, 41, 324–332 CrossRef CAS.
- E. Pellicer, M. Cabo, A. López-Ortega, M. Estrader, L. Yedra, S. Estradé, F. Peiró, Z. Saghi, P. Midgley, E. Rossinyol, I. V. Golosovsky, A. Mayoral, J. D. Prades, S. Suriñach, M. D. Baró, J. Sort and J. Nogués, Nanoscale, 2013, 5, 5561–5567 RSC.
- H. Wang, Y. Yan, X. Du, X. Liu, K. Li and H. Jin, J. Appl. Phys., 2010, 107, 103923 CrossRef.
- R. Kodama, S. Makhlouf and A. Berkowitz, Phys. Rev. Lett., 1997, 79, 1393–1396 CrossRef CAS.
- P. Ravikumar, B. Kisan and A. Perumal, AIP Adv., 2015, 5, 87116 CrossRef.
- J. C. Loudon, Phys. Rev. Lett., 2012, 109, 267204 CrossRef CAS PubMed.
- J. Stöhr, A. Scholl, T. Regan, S. Anders, J. Lüning, M. Scheinfein, H. Padmore and R. White, Phys. Rev. Lett., 1999, 83, 1862–1865 CrossRef.
Footnote |
| † Electronic supplementary information (ESI) available. See DOI: 10.1039/c6ra23918h |
| This journal is © The Royal Society of Chemistry 2016 |

