
 Open Access Article
 This Open Access Article is licensed under a
 Creative Commons Attribution 3.0 Unported Licence
Efficiency and stability of spectral sensitization of boron-doped-diamond electrodes through covalent anchoring of a donor–acceptor organic chromophore (P1)†
Hana
Krysova
a,
Jan
Barton
bc,
Vaclav
Petrak
de,
Radek
Jurok
fg,
Martin
Kuchar
fh,
Petr
Cigler
*b and
Ladislav
Kavan
*a
aJ. Heyrovský Institute of Physical Chemistry, v.v.i., Academy of Sciences of the Czech Republic, Dolejskova 3, 18223 Prague 8, Czech Republic. E-mail: kavan@jh-inst.cas.cz
bInstitute of Organic Chemistry and Biochemistry, v.v.i., Academy of Sciences of the Czech Republic, Flemingovo nam. 2, 166 10 Prague 6, Czech Republic. E-mail: Cigler@uochb.cas.cz
cFaculty of Science, Charles University, Hlavova 2030, 128 40 Prague 2, Czech Republic
dInstitute of Physics, v.v.i., Academy of Sciences of the Czech Republic, Na Slovance 2, 182 21, Prague 8, Czech Republic
eCzech Technical University in Prague, Faculty of Biomedical Engineering, Sítná 3105, 272 01 Kladno, Czech Republic
fForensic Laboratory of Biologically Active Substances, University of Chemistry and Technology Prague, Technická 5, 166 28 Prague 6, Czech Republic
gDepartment of Organic Chemistry, University of Chemistry and Technology Prague, Technická 5, Prague 6, 166 28, Czech Republic
hDepartment of Chemistry of Natural Compounds, University of Chemistry and Technology Prague, Technická 5, Prague 6, 166 28, Czech Republic
First published on 24th May 2016
Abstract
A novel procedure is developed for chemical modification of H-terminated B-doped diamond surfaces with a donor–π-bridge–acceptor molecule (P1). A cathodic photocurrent near 1 μA cm−2 flows under 1 Sun (AM 1.5) illumination at the interface between the diamond electrode and aqueous electrolyte solution containing dimethylviologen (electron mediator). The efficiency of this new electrode outperforms that of the non-covalently modified diamond with the same dye. The found external quantum efficiency of the P1-sensitized diamond is not far from that of the flat titania electrode sensitized by a standard organometallic dye used in solar cells. However, the P1 dye, both pure and diamond-anchored, shows significant instability during illumination by solar light. The degradation is a two-stage process in which the initially photo-generated products further decompose in complicated dark reactions. These findings need to be taken into account for optimization of organic chromophores for solar cells in general.
1. Introduction
Dye-sensitized solar cells (DSCs)1 usually operate with n-type semiconductor photoanodes (e.g. TiO2), but there are also sporadic reports on p-type DSCs with e.g. p-NiO photocathodes2,3 and on the tandem device (p,n-DSC).4 While the state-of-art n-DSC achieves a solar conversion efficiency of 14.3%5 the p-DSCs or p,n-DSCs are still by an order of magnitude less efficient.2–4 Boron-doped diamond (BDD) is a popular electrode material in electrochemistry.6 It could be similarly attractive for the p-DSC photocathode, because it outperforms p-NiO in chemical and electrochemical stability,7,8 optical transparency9,10 and hole diffusion coefficient.11,12 However, the so far reported photoelectrochemical performance of sensitized p-BDD electrodes is not satisfactory.Spectral sensitization of BDD by organic dyes was pioneered in 2008 by Zhong et al.13 Photocurrents of ca. 4–6 μA cm−2 were observed under 1 Sun illumination in aqueous electrolyte solution with dimethylviologen acting as the electron carrier.10 Sensitization of BDD by Ru(SCN)2(2,2′-bipyridine, 4,4′-dicarboxylate)2 (coded N3)14 provided photocurrents of the order of 1–10 nA cm−2 under 1 Sun. A biophotovoltaic variant of these systems was recently demonstrated by Caterino et al.15 using BDD with grafted bacterial photoactive centers. They observed photocurrents of about 0.3 μA cm−2 under NIR light (870 nm; unspecified intensity). This photocurrent increased to ca. 2 μA cm−2 if the sensitizer loading was enhanced through a polymer brush on top of the BDD surface, but the photocurrent was quite unstable during long-term (hours) illumination.15 Yeap et al.16 modified BDD with thiophene derivatives, and observed a photocurrent of ca. 150 nA cm−2 under 0.15 Sun. To enhance the dye-loading, a standard compact BDD film was replaced by a diamond foam, while ca. 3-times larger photocurrent was observed.17 It further increased to 15–22 μA cm−2 (at 1 Sun) during long-term illumination. This is the largest value for a dye-sensitized diamond, but the photo-activation is, unfortunately, associated with unclear degradation of the dye.17
The donor–π-bridge–acceptor dye, 4-(bis-4-[5-(2,2-dicyano-vinyl)-thiophene-2-yl]-phenyl-amino)-benzoic acid (denoted P1, see Scheme S1 in the ESI†), is one of the most efficient chromophores which is frequently used for the sensitization of p-NiO18,19 and some other p-type semiconductors.20,21 In addition to applications in solar cells, the P1@NiO electrode was also successfully tested for hydrogen production by photo-electrolysis of water.22,23 Krysova et al.24 reported on non-covalent anchoring of P1 to diamond (coated by polyethyleneimine). This electrode provided cathodic photocurrents of about 100–150 nA cm−2 at 0.18 Sun. The photocurrent was constant during illumination for ca. 250 s, but no long-term tests have been carried out yet. Here we report on an alternative strategy towards P1-sensitized diamond, leading to improved efficiency. Nevertheless, illumination of the P1 dye by 1-Sun light causes also some degradation, which is analysed here in detail.
2. Experimental details
2.1. Diamond growth
Silicon substrates (5 × 10 mm2) were nucleated in an aqueous detonation nanodiamond colloid (NanoAmando, NanoCarbon Institute, nominal particle size of 4.9 ± 0.1 nm). Deposition of BDD was performed in an ASTeX 5010 (Seki Technotron, Japan) Microwave plasma enhanced chemical vapour deposition (MW PECVD) reactor with the following process parameters: 1% of methane in hydrogen, a gas pressure of 50 mBar, a microwave power of 1250 W and a substrate temperature of 720 °C as monitored using a Williamson Pro92 dual wavelength pyrometer. A growth time of 2 hours yielded 0.5 μm thick films. Addition of trimethylboron (B(CH3)3) to the gas in a B/C ratio of 4000 ppm during deposition translated into the B concentration in the bulk material of ca. 3 × 10²¹ at cm−3 (ref. 25). Hydrogen termination of the surface of BDD samples was performed in hydrogen plasma using the same reactor. The hydrogenation was carried out in a hydrogen flow of 300 sccm, at a pressure of 60 mBar, and 1000 W microwave power for 10 min. Samples were allowed to cool to room temperature under constant hydrogen flux.2.2. Syntheses
The P1 dye (purity >95%) was purchased from Dyenamo AB, Sweden. Other chemicals were supplied by Sigma-Aldrich and used as received. MilliQ water was used in all syntheses. Organic solvents were HPLC-grade and were dried before use. Sonication was performed using an Elmasonic P60 H ultrasound bath for 1 min at 30% power and 85 kHz. Drying was carried out under vacuum for 1 hour at 60 °C, if not stated otherwise.![[double bond, length as m-dash]](https://www.rsc.org/images/entities/char_e001.gif) , 2J = 17.1, 10.1, 3J = 5.6 Hz), 5.24 (d, 1H, trans-CH2, J = 17.1 Hz), 5.15 (d, 1H, cis-CH2, J = 10.1 Hz), 5.08 (brs, 1H, NH), 3.78 (d, 2H, NCH2, 3J = 5.6 Hz) ppm. 13C NMR (75 MHz, CDCl3): δ = 132.21 (CH), 119.73 (q, CF3, JCF = 320.9 Hz), 118.76 (CH2), 46.64 (NCH2) ppm. 19F NMR (300 MHz, CDCl3): δ = −79.12 ppm. IR (film, cm−1): 3310, 3180, 3094, 2888, 1721, 1648, 1440, 1372, 1261, 1231, 1151, 1072, 994, 928, 859. Anal. calcd for C4H6F3NO2S: C 25.40; H 3.20; F 30.13; N 7.40; S 16.95. Found: C 26.10; H 2.90; F 30.32; N 7.28; S 16.74%.
, 2J = 17.1, 10.1, 3J = 5.6 Hz), 5.24 (d, 1H, trans-CH2, J = 17.1 Hz), 5.15 (d, 1H, cis-CH2, J = 10.1 Hz), 5.08 (brs, 1H, NH), 3.78 (d, 2H, NCH2, 3J = 5.6 Hz) ppm. 13C NMR (75 MHz, CDCl3): δ = 132.21 (CH), 119.73 (q, CF3, JCF = 320.9 Hz), 118.76 (CH2), 46.64 (NCH2) ppm. 19F NMR (300 MHz, CDCl3): δ = −79.12 ppm. IR (film, cm−1): 3310, 3180, 3094, 2888, 1721, 1648, 1440, 1372, 1261, 1231, 1151, 1072, 994, 928, 859. Anal. calcd for C4H6F3NO2S: C 25.40; H 3.20; F 30.13; N 7.40; S 16.95. Found: C 26.10; H 2.90; F 30.32; N 7.28; S 16.74%.
2.3. Modification of a BDD surface
An approximately 1 × 0.5 cm2 BDD plate was immersed in N-allyltrifluoroacetamide or N-allyltrifluoromethanesulfonamide in a quartz tube and secured with Ar. The plate was irradiated using a water-cooled mercury-vapor discharge lamp for 3 hours. The product was washed with methanol, sonicated and dried. For removal of the trifluoroacetyl protecting group, the plate was rinsed in 25% methanolic solution of tetramethylammonium hydroxide for 1 hour on a gel rocker, then washed with methanol, sonicated and dried. For removal of the trifluoromethylsulfonyl group, the plate was covered with sodium bis(2-methoxyethoxy)aluminumhydride and heated overnight at 105 °C, quenched by slow addition of methanol, the newly formed precipitate was removed with 2 mL of 20% HCl, sonicated, washed with methanol, then again sonicated and dried. The dry plate was immersed in 1 mL of dry tetrahydrofuran (THF) containing 10 μL of triethylamine. P1-Cl solution obtained in the previous step (2 mL) was added and left overnight at room temperature under an Ar atmosphere on a gel rocker. The plate was then washed and sonicated with THF, DCM and methanol, and finally dried. To improve the grafting conjugation yield and properties of the sensitized BDD, the acylation with P1-Cl was repeated. The plate was sonicated for 5 minutes at 100% at 37 kHz then rinsed in a mixture of solvents (THF, DCM, and methanol) at room temperature for 3 days, washed and dried.2.4. Methods
The X-ray photoelectron spectroscopy (XPS) spectra were recorded using an Omicron Nanotechnology instrument equipped with a monochromatized AlKα source (1486.7 eV) and a hemispherical analyzer operating in a constant analyzer energy mode with a multichannel detector. The CasaXPS program was used for spectral analysis. Raman spectra were measured using a Renishaw InVia Raman microscope, interfaced to an Olympus microscope (objective 50×) with an excitation wavelength of 488 nm and a power at the sample of 2.6 mW. The spectrometer was calibrated by the F1g mode of Si at 520.2 cm−1. UV-Vis absorption spectra were recorded using a Perkin Elmer Lambda 1050 UV-Vis-NIR spectrometer. The solution of P1 in absolute ethanol was sealed under ca. 0.1 bar He into a vacuum-tight quartz optical cell (1 cm optical length).Photoelectrochemical experiments were carried out in a one-compartment cell using a (micro-Autolab III, Metrohm) potentiostat controlled using the NOVA software. The BDD film was used as a working electrode (Ag contact with a Au wire insulated by TorrSeal epoxy coating), platinum was used as the counter electrode and an Ag/AgCl electrode (sat. KCl) was used as the reference electrode. The cell was equipped with a quartz optical window, and the electrode was illuminated using a white light source (Oriel Xenon lamp, model 6269) in a dark room. The solar radiation (direct and diffuse) was simulated using an Oriel AM 1.5 Global (81088) filter. The light intensity was measured using a standard Si photodiode (PV Measurements, Inc., USA). For the quantum efficiency measurements (IPCE), the light was monochromatized using a Newport 1/4 m grating monochromator (model 77200). Photoelectrochemical measurements were performed in an Ar-saturated 0.1 M Na2SO4 solution containing 5 mM dimethylviologen (MV2+), pH ≈ 7. High-resolution mass spectra were measured using an LTQ Orbitrap XL (Thermo Fisher Scientific) instrument. Analysis of P1 degradation was performed on an Agilent 1260 Infinity HPLC using Luna® C8 column (Phenomenex LC 150 × 4.6 mm, particle size: 5 μm). Mobile phase: water (A) and acetonitrile (B), both with 0.1% trifluoroacetic acid. The linear gradient program was as follows: 0–0.5 min: 95% of A and 5% of B; 16–17.5 min: 5% of A and 95% of B.
3. Results and discussion
3.1. Dye-sensitization of diamond
Our synthetic strategy started from the hydrogen-terminated diamond surface, which was modified by photochemically-triggered grafting of alkenes.26 Due to their direct C–C coupling to diamond, this type of modification is known to be chemically resistant and stable.27 For instance, long chain (C10) alkenes were used for the attachment of biomolecules to diamond.28 However, long spacers are not appropriate for sensitized photoelectrodes, because the dye should be located in the closest vicinity of the surface for efficient hole-injection. Here, we used a short C3 allyl bearing a protected amino group (see Fig. 1). The linker was attached to BDD under UV illumination, followed by removal of the protecting groups which provided an amine-modified surface. Notably, the linkers are transparent at the spectral maximum of the UV lamp (254 nm) which facilitates their anchoring. Sensitization of the BDD surface was carried out by acylation of the free amines using the P1-Cl dye. As the multilayer adsorption of P1 decreases the photoelectrochemical activity, excessive dye was washed out under sonication (see the Experimental section). | ||
| Fig. 1 Synthetic scheme for photochemically triggered modification of BDD using short amine-terminated linkers followed by sensitization by the P1-Cl dye. Two different linkers (1 and 2) were used. | ||
The Raman spectrum of the product, P1@BDD (Fig. 2), is roughly a superposition of the spectra of pure BDD and P1, with small (<7 cm−1) shifts of certain modes (e.g. the 1436 cm−1 line) and interestingly strong Raman intensities of the surface anchored P1 dye which are, presumably, due to resonance enhancement at the used laser line (488 nm). However, both P1@BDD and pure P1 decompose under the laser light (see Fig. 2 and discussion below). Photoelectron spectra (XPS; Fig. 3) provide complementary information about the surface chemistry of the products and reaction intermediates. The found surface concentration of the boron dopant decreases from 2.5% in pure BDD to 1.6%, 1.1% and 0.7% in the modified surfaces with linker 1, deprotected intermediate and P1@BDD, respectively (Table S2a; ESI†). The attenuation of B1s to about half of its original value was observed for a monolayer of phenyl-based linker.16 Hence, we estimate a nearly monolayer coverage in our case too. This matches the earlier work by Strother et al.26 who reported on photochemically functionalized diamond by various long-chain alkenes under similar experimental conditions. The anchoring was reported to be covalent and unperturbed by polymerization under UV light; the surface coverage was ca. one molecule per 10 surface C-atoms, i.e. ≈0.3 monolayer.26 Deconvolution of the N1s line in our detailed XPS spectra allows distinction of two chemically-shifted species, which are tentatively assigned to the –CN group from the P1 dye and the amino groups from the linker and the triphenylamino group from the P1 dye (Table S2b and Fig. S3; ESI†).
 | ||
| Fig. 2 Raman spectra (at 488 nm excitation) of pure BDD at the Si substrate (black dashed curve; the Si signal from the substrate at 520 cm−1 is labeled ‘x’) and the pure P1 dye (red dashed curve). The spectra of P1-modified BDD are shown for three samples: P1@BDD_a (black curve) is for a fresh sample; P1@BDD_b (blue curve) is for an aged sample after passing long-term photoelectrochemical tests (45 hours of chopped illumination at 1 Sun, see Section 3.2); P1@BDD_c (red curve) is for an as-received sample, which passed long-term irradiation using a 488 nm laser. The strong Raman intensities of P1 are ascribed to resonance enhancement, because the dye has the main optical absorption peak at the 488 nm wavelength (cf.Fig. 7). | ||
 | ||
| Fig. 3 XPS spectra of the studied samples. P1@BDD is the optimized sample with linker 1; P1@BDD (2) is another sample with linker 2. Curves are offset for clarity, but the intensity scale is identical for all spectra. | ||
Because the electronic structure of the protecting group is important for the grafting yield,29 we synthesized trifluoroacetamide 1 and trifluoromethylsulfonamide 2 derivatives of allylamine (Fig. 1). Although 2 contains an excellent electron acceptor and should therefore enhance the grafting conversion,29 we observed actually a smaller photoelectrochemical activity of the sensitized BDD (see Section 3.2 and Fig. S4; ESI†). This can be explained by higher chemical stability of the protecting group, which requires harsher conditions for deprotection. In the case of a dye anchored through linker 1, the surface concentration of sulfur is diagnostic for P1 only. The concentration of S found by XPS (2.9 at%; Table S2a in the ESI†) is not far from 4.5 at% S which is expected for the pure P1 molecule (without H-atoms). This would indicate quite high surface coverage, but the experimental error of XPS analysis and the found non-stoichiometric S/N ratio (Table S2a in the ESI†) must be also taken into account.
3.2. Photoelectrochemical characterization
Fig. 4 shows the response of our optimized P1@BDD electrode (linker 1) to chopped white light in an aqueous electrolyte solution with methylviologen redox mediator. The reference (non-sensitized BDD) provided small cathodic photocurrent too (ca. 20 nA cm−2), which is ascribed to either sp2 impurities or specific B-states in the lattice.30 Our P1@BDD electrode exhibited a cathodic photocurrent of ca. 0.9 μA cm−2 during the first ca. 5 minutes of chopped illumination of 1 Sun intensity. (The photocurrent was proportional to the light intensity, amounting to e.g. 0.2 μA cm−2 at 0.2 Sun for the fresh electrode). | ||
| Fig. 4 Chronoamperometric plot for a blank BDD electrode and that sensitized with P1. Freshly prepared P1@BDD electrode (red curve, top) and that after passing long-term chopped irradiation (45 hour at 1 Sun). Electrolyte solution: 0.1 M Na2SO4 containing 5 mM dimethylviologen, applied bias voltage −0.3 V vs. Ag/AgCl. Illumination with simulated AM 1.5 solar light of varying intensity. Curves are offset for clarity, but the current density scale is identical in all cases. | ||
The mechanism of photocurrent generation starts from photon absorption in P1, creating electron–hole pairs, which subsequently dissociate in the donor–π-bridge–acceptor molecular structure of P1 (Scheme S1, ESI†). The separated holes are injected into the valence band of BDD, and the electrons flow to the MV2+ (dimethylviologen) electron carrier in the electrolyte solution which is finally regenerated by dark charge transfer at the counter electrode (Fig. S5, ESI†).10,13,14,16,24 The HOMO level of P1 (−5.8 eV)18 is well below the valence band of the H-terminated diamond (ca. −4.2 eV for diamond in a vacuum, and ca. −5.5 eV for a diamond contacting electrolyte solution).7 The LUMO level of P1 corresponds to a potential of −0.87 V vs. SHE,18 which is more negative compared to the MV2+/+ redox potential (−0.45 V vs. SHE). Hence, both the hole injection into the VB of diamond and the electron transfer to MV2+ have a reasonable driving force of ca. 0.5 eV.
The long-term stability of our P1@BDD was tested under chopped 1 Sun illumination. Interestingly, the photocurrent initially increased during ≈5 hours from 1 μA cm−2 to 1.5 μA cm−2, but then dropped to ca. 0.6 μA cm−2 after about 40 hours (Fig. 5). These changes were further addressed by the external quantum efficiency (also called IPCE = incident photon to current conversion efficiency) vs. wavelength at various stages of long-term illumination. It is defined as
| IPCE = iphhv/eP = ηinj(1−10−ΓRε) | (1) |
 | ||
| Fig. 5 Long-term chronoamperometric measurement of the diamond electrode sensitized with P1 (red curve) and the blank, non-sensitized diamond electrode (black curve). Chopped white light illumination (100 mW cm−2; simulated AM 1.5G solar spectrum, 10 min dark/light interval). Electrolyte solution: 5 mM dimethylviologen in 0.1 M Na2SO4, pH 7. Applied potential bias: −0.3 V vs. Ag/AgCl. | ||
Our found maximum IPCE (Fig. 6) is ca. 4-times larger than that reported previously for a non-covalently anchored P1 to BDD.24 This confirms that the covalent anchoring is beneficial for the efficient sensitization of diamond electrodes. The blank (non-sensitized) BDD expectedly shows negligible IPCEs. The IPCEs of the 5 h-aged electrode are similar or larger (particularly in the UV region) than those of the fresh electrode, but drop significantly for the 45 h-aged electrode. This is qualitatively consistent with the performance under white light (Fig. 5). The IPCE maximum is blue-shifted against that of the P1-sensitized p-NiO,18 which is reminiscent of the same spectrum of non-covalently anchored P1 to BDD.24 Our maximal photocurrent under simulated AM 1.5 solar light (≈1.5 μA cm−2) is similar or better compared to other previously reported values on flat (non-textured) BDD electrodes.10,13–16 Nevertheless, the photoelectrochemical performance of the sensitized BDD is still far from that of sensitized p-NiO, the latter exhibiting photocurrents in the mA cm−2 domain for good samples.2–4,18,19
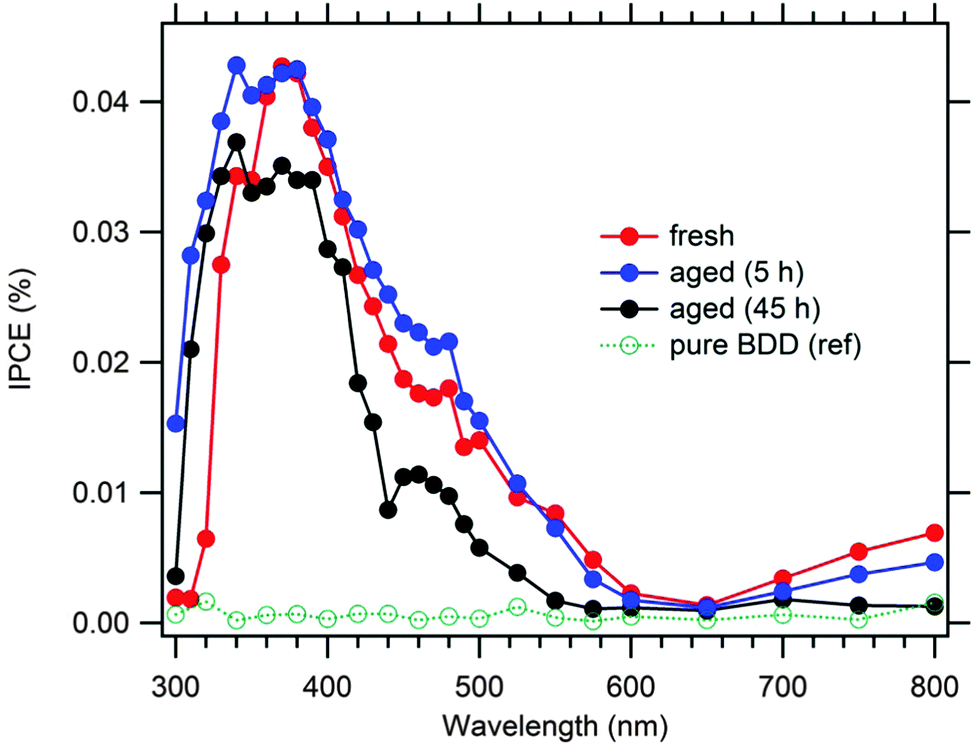 | ||
| Fig. 6 IPCE spectrum for the fresh P1@BDD electrode and that after passing 4 or 45 hours of photoelectrochemical test with chopped illumination at 1 Sun (aged). A reference spectrum for pristine, non-sensitized BDD electrode is also shown. Electrolyte solution 0.1 M Na2SO4 + 5 mM dimethylviologen; bias voltage −0.3 V vs. Ag/AgCl. | ||
3.3. Stability of the P1 dye
The Raman spectra of the photoelectrochemically treated electrode (see Section 3.2) show distinct changes resembling the photochemically degraded pure P1@BDD and solid P1, see Fig. 2 and Fig. S6 (ESI†), respectively. These changes were further investigated by optical spectra and by liquid chromatography (HPLC) analysis of the degradation products in a model system, i.e. ethanolic solution of P1.The P1 dye has two absorption maxima in tetrahydrofuran solution:19 348 nm (ε = 34![[thin space (1/6-em)]](https://www.rsc.org/images/entities/char_2009.gif) 720 M−1 cm−1) and 481 nm (ε = 57900 M−1 cm−1) or 345 nm and 468 nm in acetonitrile. In ethanol, we found 349 nm (ε = 26300 M−1 cm−1) and 488 nm (ε = 51500 M−1 cm−1). To test the photochemical stability of the ethanolic P1 solution, its spectrum was recorded after 5 and 24 hours of continuous illumination at 1 Sun in a closed, vacuum-sealed optical cell (Fig. S7; ESI†). Interestingly, the Vis band bleached completely, while the UV band attenuated and blue-shifted (Fig. 7). This effect is reminiscent of the photochemical degradation of some other diamond-sensitizing dyes (thiophene-based).24
720 M−1 cm−1) and 481 nm (ε = 57900 M−1 cm−1) or 345 nm and 468 nm in acetonitrile. In ethanol, we found 349 nm (ε = 26300 M−1 cm−1) and 488 nm (ε = 51500 M−1 cm−1). To test the photochemical stability of the ethanolic P1 solution, its spectrum was recorded after 5 and 24 hours of continuous illumination at 1 Sun in a closed, vacuum-sealed optical cell (Fig. S7; ESI†). Interestingly, the Vis band bleached completely, while the UV band attenuated and blue-shifted (Fig. 7). This effect is reminiscent of the photochemical degradation of some other diamond-sensitizing dyes (thiophene-based).24
 | ||
| Fig. 7 UV-Vis spectrum of the solution of the P1 dye in absolute ethanol (starting concentration 10−5 mol L−1). Optical length 1 cm. The spectrum of a fresh solution (red curve) and that after illumination with a white light of 1 Sun intensity for 5 hours (blue curve) or 24 hours (black curve). | ||
The complete decomposition of P1 in ethanolic solution upon 24 hours of illumination is clearly confirmed by HPLC (Fig. S8; ESI†). The degradation products manifest themselves by several chromatographic peaks upon UV detection. Moreover, the irradiated solution was unstable too, and transformed during long-term (2 month) storage to more than 10 different products (Fig. S8, ESI†). We attempted to analyze both mixtures using high-resolution mass spectroscopy and HPLC-MS and to resolve the mechanism of P1 decomposition. Unfortunately, the MS analysis did not provide reliable data for reconstruction of the chemical structures. In the aged solution, we observed oligomers originating most likely from polymerization of dye fragments containing heterocyclic thiophene rings (data not provided).
Although this model experiment gave evidence of photochemical instability of P1 in ethanolic solution, the conditions occurring on the sensitized diamond surface can be dissimilar, and the stability of the surface-grafted dye can be better. For example, we observed a substantial photocurrent on a P1-modified diamond electrode even after >40 hours irradiation by chopped light at 1 Sun intensity (see Fig. 5) indicating the presence of some photoelectrochemically active dye molecules on the surface. This conclusion is also supported by Raman spectra (Fig. 2). The covalent attachment of P1 to the diamond surface provides obviously different electronic conditions, driving the fate of the P1 excited state (with hole injection into the diamond electrode). Furthermore, the slower diffusion of solvent molecules, impurities and radicals from the bulk solution to the interface are other possible factors contributing to better stability of the P1 dye on the diamond surface, as compared to its strikingly fast photochemical degradation in the solution.
For comparison, we also tested the photochemical stability of another typical dye, which is frequently used in dye-sensitized solar cells, the N719 dye: di-tetrabutylammonium cis-bis(isothiocyanato)bis(2,2′-bipyridyl-4,4′-dicarboxylato)ruthenium(II) (purchased from Dyesol, SA, Switzerland). This complex is very similar to the N3 dye which was also previously applied for diamond sensitization, albeit with moderate success.14 The optical spectra of N719 are shown in Fig. S9 (ESI†). It is obvious that this dye is fairly stable in ethanolic solution under the conditions, when P1 degrades totally. Our results on N719 essentially match those of earlier studies.32,33 They found that the degradation of N719 occurred mostly through S/N thiocyanate isomerization and through exchange of NCS ligands with e.g. solvent molecules, but without massive decomposition of the organometallic skeleton as a whole. The reported degradation products exhibited slightly blue-shifted optical bands which is in accord with our spectrum in Fig. S9 (ESI†). Nevertheless, the decomposition of N719 and similar dyes like N3 and other organometallic complexes under the conditions of illuminated solar cells32,33 is obviously not that dramatic, like the degradation of the P1 dye which is studied here.
To our knowledge, there are no long-term stability tests of P1 in p-DSCs available.18–21 Photocurrent decay at a timescale of 102 s was reported for the P1@NiO electrode during H2 generation by photo-electrolysis of water.22,23 It was ascribed to co-catalyst decomposition or to its delamination from the electrode surface.23 However, our results show that also the inherent photochemical instability of organic dyes must be considered for the design of p-DSCs and for sensitized photo-electrolytic water splitting.
4. Conclusions
A novel synthetic procedure is developed for covalent anchoring of a P1 dye to the surface of a H-terminated B-doped diamond electrode. The sensitized diamond electrode exhibits cathodic photocurrent upon illumination with solar light, which predestines it for application in p-type dye-sensitized solar cells.The photoelectrochemical efficiency considerably outperforms that of non-covalently derivatized BDD with P1. The found external quantum efficiency (IPCE) of the P1-sensitized diamond is not far from that of the flat titania electrode sensitized by a standard Ru–bipyridine complex, which has been frequently used in the n-type solar cells. The sensitized photocurrent is reasonably stable during ca. 40 hours of illumination at 1 Sun (AM 1.5), but there are certain photo-initiated changes of the P1 dye, both pure and diamond-anchored.
Model experiments in ethanolic solutions show that P1 is sensitive to photochemical degradation in solar light, as compared to another generic dye for solar cells, i.e.N-719. The former dye is totally degraded upon 24 hours of illumination in solution to more than ten (yet unidentified) products. The degradation is a two-stage process in which the initially photo-generated products further decompose in complicated dark reactions. These findings need to be taken into account for optimization of organic chromophores for solar cells in general.
Acknowledgements
This work was supported by the Czech Science Foundation, contract No. 13-31783S.References
- A. Hagfeldt, G. Boschloo, L. Sun, L. Kloo and H. Pettersson, Chem. Rev., 2010, 110, 6595 CrossRef CAS PubMed.
- H. Tian, J. Oscarsson, E. Gabrielsson, S. K. Eriksson, R. Lindblad, B. Xu, Y. Hao, G. Boschloo, E. M. J. Johansson, J. M. Gardner, A. Hagfeldt, H. Rensmo and L. Sun, Sci. Rep., 2014, 4, 4282 Search PubMed.
- S. Powar, T. Daeneke, M. T. Ma, D. Fu, N. W. Duffy, G. Goetz, M. Weidelener, A. Mishra, P. Baeuerle, L. Spiccia and U. Bach, Angew. Chem., Int. Ed., 2013, 52, 602 CrossRef CAS PubMed.
- A. Nattestad, A. J. Mozer, M. K. R. Fischer, Y. B. Cheng, A. Mishra, P. Bäuerle and U. Bach, Nat. Mater., 2010, 9, 31 CrossRef CAS PubMed.
- K. Kakiage, Y. Aoyama, T. Yano, K. Oya, J. I. Fujisawa and M. Hanaya, Chem. Commun., 2015, 51, 15894 RSC.
- N. Yang, J. S. Foord and X. Jiang, Carbon, 2016, 99, 90 CrossRef CAS.
- A. Fujishima, Y. Einaga, T. N. Rao and D. A. Tryk, Diamond Electrochemistry, Elsevier, Tokyo, 2005 Search PubMed.
- L. Kavan, Z. Vlckova-Zivcova, V. Petrak, O. Frank, P. Janda, H. Tarabkova, M. Nesladek and V. Mortet, Electrochim. Acta, 2015, 179, 626 CrossRef CAS.
- C. H. Y. X. Lim, Y. L. Zhong, S. Janssens, M. Nesladek and K. P. Loh, Adv. Funct. Mater., 2010, 20, 1313 CrossRef CAS.
- Y. L. Zhong, A. Midya, Z. Ng, Z. K. Chen, M. Daenen, M. Nesladek and K. P. Loh, J. Am. Chem. Soc., 2008, 130, 17218 CrossRef CAS PubMed.
- S. D. Janssens, P. Pobedinskas, J. Vacik, V. Petrikova, B. Ruttens, J. D'Haen, M. Nesladek, K. Haenen and P. Wagner, New J. Phys., 2011, 13, 083008 CrossRef.
- S. Mori, S. Fukuda, S. Sumikura, Y. Takeda, Y. Tamaki, E. Suzuki and T. Abe, J. Phys. Chem. C, 2008, 112, 16134 CAS.
- Y. L. Zhong, K. P. Loh, A. Midya and Z. K. Chen, Chem. Mater., 2008, 20, 3137 CrossRef CAS.
- W. S. Yeap, X. Liu, D. Bevk, A. Pasquarelli, L. Lutsen, M. Fahlman, W. Maes and K. Haenen, ACS Appl. Mater. Interfaces, 2014, 6, 10322 CAS.
- R. Caterino, R. Csiki, A. Lyuleeva, J. Pfisterer, M. Wiesinger, S. D. Janssens, K. Haenen, A. Cattani-Scholz, M. Stutzmann and J. A. Garrido, ACS Appl. Mater. Interfaces, 2015, 7, 8099 CAS.
- W. S. Yeap, D. Bevk, X. Liu, H. Krysova, A. Pasquarelli, D. Vanderzande, L. Lutsen, L. Kavan, M. Fahlman, W. Maes and K. Haenen, RSC Adv., 2014, 4, 42044 RSC.
- H. Krysova, L. Kavan, Z. Vlckova-Zivcova, W. S. Yeap, P. Verstappen, W. Maes, K. Haenen, F. Gao and C. E. Nebel, RSC Adv., 2015, 5, 81069 RSC.
- P. Qin, H. Zhu, T. Edvinsson, G. Boschloo, A. Hagfeldt and L. Sun, J. Am. Chem. Soc., 2008, 130, 8570 CrossRef CAS PubMed.
- P. Qin, J. Wiberg, E. A. Gibson, M. Linder, L. Li, T. Brinck, A. Hagfeldt, B. Albinsson and L. Sun, J. Phys. Chem. C, 2010, 114, 4738 CAS.
- X. Xu, J. Cui, J. Han, J. Zhang, Y. Zhang, L. Luan, G. Alemu, Z. Wang, Y. Shen, D. Xiong, W. Chen, Z. Wei, S. Yang, B. Hu, Y. Cheng and M. Wang, Sci. Rep., 2014, 4, 3961 Search PubMed. 1.
- Z. Xu, D. Xiong, H. Wang, W. Zhang, X. Zeng, L. Ming, W. Chen, X. Xu, J. Cui, M. Wang, S. Powar, U. Bach and Y. B. Cheng, J. Mater. Chem. A, 2014, 2, 2968 CAS.
- F. Li, K. Fan, B. Xu, E. Gabrielsson, Q. Daniel, L. Li and L. Sun, J. Am. Chem. Soc., 2015, 137, 9153 CrossRef CAS PubMed.
- L. Li, L. Duan, F. Wen, C. Li, M. Wang, A. Hagfeldt and L. Sun, Chem. Commun., 2012, 48, 988 RSC.
- H. Krysova, Z. Vlckova-Zivcova, J. Barton, V. Petrak, M. Nesladek, M. Cigler and L. Kavan, Phys. Chem. Chem. Phys., 2015, 17, 1165 RSC.
- Z. Vlckova-Zivcova, O. Frank, V. Petrak, H. Tarabkova, J. Vacik, M. Nesladek and L. Kavan, Electrochim. Acta, 2013, 87, 518 CrossRef.
- T. Strother, T. Knickerbocker, J. Russell, J. E. Butler, L. M. Smith and R. J. Hamers, Langmuir, 2002, 18, 968 CrossRef CAS.
- W. Yang, O. Auciello, J. E. Butler, W. Cai, J. A. Carlisle, J. Gerbi, D. M. Gruen, T. Knickerbocker, T. L. Lasseter, J. Russell, L. M. Smith and R. J. Hamers, Nat. Mater., 2002, 1, 253 CrossRef CAS PubMed.
- A. Haertl, E. Schmich, J. A. Garrido, J. Hernando, S. C. R. Catharino, S. Walter, P. Feulner, A. Kromka, D. Steinmueller and M. Stutzmann, Nat. Mater., 2004, 3, 736 CrossRef CAS PubMed.
- X. Wang, P. E. Colavita, J. A. Streifer, J. E. Butler and R. J. Hamers, J. Phys. Chem. C, 2010, 114, 4067 CAS.
- S. J. Green, L. S. A. Mahe, D. R. Rosseinsky and C. P. Winlove, Electrochim. Acta, 2013, 107, 111 CrossRef CAS.
- L. Kavan, M. Grätzel, S. E. Gilbert, C. Klemenz and H. J. Scheel, J. Am. Chem. Soc., 1996, 118, 6716 CrossRef CAS.
- S. M. K. Rendon, D. Mavrynsky, A. Meierjohann, A. Tiihonen, K. Miettunen, I. Asghar, J. Halme, L. Kronberg and R. Leino, Rapid Commun. Mass Spectrom., 2015, 29, 2245 CrossRef CAS PubMed.
- F. Nour-Mohhamadi, S. D. Nguyen, G. Boschloo, A. Hagfeldt and T. Lund, J. Phys. Chem. B, 2005, 109, 22413 CrossRef CAS PubMed.
Footnote |
| † Electronic supplementary information (ESI) available: Experimental details, XPS, HPLC, optical and Raman spectra, and additional electrochemical data. See DOI: 10.1039/c6cp02209j |
| This journal is © the Owner Societies 2016 |