 Open Access Article
Creative Commons Attribution 3.0 Unported Licence
Kinetics analysis and automated online screening of aminocarbonylation of aryl halides in flow†
Jason S.
Moore
ab,
Christopher D.
Smith
ac and
Klavs F.
Jensen
*a
aDepartment of Chemical Engineering, Massachusetts Institute of Technology, 77 Massachusetts Avenue, 66-342, Cambridge, MA 02139, USA. E-mail: kfjensen@mit.edu; Fax: +1 617 258 8992
bThe Dow Chemical Company, 2301 North Brazosport Blvd., B-1603, Freeport, TX, 77541 USA
cDepartment of Chemistry, University of Reading, Whiteknights, Reading, RG6 6AD, UK
First published on 22nd February 2016
Abstract
Temperature, pressure, gas stoichiometry, and residence time were varied to control the yield and product distribution of the palladium-catalyzed aminocarbonylation of aromatic bromides in both a silicon microreactor and a packed-bed tubular reactor. Automation of the system set points and product sampling enabled facile and repeatable reaction analysis with minimal operator supervision. It was observed that the reaction was divided into two temperature regimes. An automated system was used to screen steady-state conditions for offline analysis by gas chromatography to fit a reaction rate model. Additionally, a transient temperature ramp method utilizing online infrared analysis was used, leading to more rapid determination of the reaction activation energy of the lower temperature regimes. The entire reaction spanning both regimes was modeled in good agreement with the experimental data.
Introduction
The carbonyl group is one of the key building blocks of nature, where it is essential for the construction of proteins, many polymers, and numerous drugs. The ubiquity of these high value products has stimulated a demand for efficient new routes and safe processes to produce this functional group.1 Palladium-catalyzed carbonylation offers a rapid and modular route for the union of three components (electrophile, CO, and nucleophile) in an atom efficient manner (Scheme 1).2–5 The difficulties in handling toxic and flammable gases like CO within pressure vessels for screening and eventual scale-up have led to the innovative use of alternative CO sources including DMF,6,7 aldehydes,8 and Mo(CO)6.9,10 Nevertheless, the simplicity, cost, and availability of carbon monoxide gas make its continued use inevitable.To address the control and containment of gases, a number of publications have employed continuous flow technologies due to the intrinsic advantages of the micro-scale, with a small footprint suitable for installation in laboratory fume hoods. Recent advances include in situ generated hydrogen11–13 and porous membranes14,15 for gas delivery, but the most focus has been on segmented flow.13,16–18
Herein, we report an automated screening system applicable for gas/liquid reactions in flow. Biphasic systems, especially gas–liquid reactions, are of special interest due to the many variables and difficulties associated with such reactions. In batch systems, expensive and specialized equipment is necessary to cope with the temperatures and pressures required. The use of microreactors in gas–liquid reactions enables facile control over the temperature, pressure, and reaction time.19 The small size of the reactor permits high temperatures and pressures to be routinely applied,20,21 enabling a safe work environment and an expanded reaction space with high reproducibility.22 For initial studies, samples were automatically collected for offline analysis and reaction conditions were adjusted, including temperature and reaction time, using a Labview-driven reaction system similar to systems we have recently reported.23–25 The system was effective for both silicon microreactors26,27 and packed-bed tubular reactors and successfully used for the carbonylation of aromatic halides (Scheme 1).
The initial results from these studies were promising in investigating the scope of the carbonylation chemistry and gaining a qualitative understanding of the effects of several parameters on the reaction. Further improvements and more understanding were needed to generate a kinetic model describing the process. This led to focusing on the aminocarbonylation of p-bromobenzonitrile with morpholine and the incorporation of inline IR analysis and a continuous temperature ramp to rapidly determine activation energy.
System description
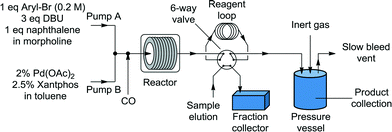
Liquid stream A (aryl halide, base, and internal standard in morpholine) and liquid stream B (catalyst and ligand in toluene) in 8 mL Harvard stainless steel syringes were driven (Harvard Apparatus PhD 2000) and mixed, whereupon they met the gas stream (dispensed using a UNIT mass flow controller) ensuring a 1![[thin space (1/6-em)]](https://www.rsc.org/images/entities/char_2009.gif) :
:![[thin space (1/6-em)]](https://www.rsc.org/images/entities/char_2009.gif) 1 volumetric gas–liquid ratio (1
1 volumetric gas–liquid ratio (1![[thin space (1/6-em)]](https://www.rsc.org/images/entities/char_2009.gif) :
:![[thin space (1/6-em)]](https://www.rsc.org/images/entities/char_2009.gif) 1, v
1, v![[thin space (1/6-em)]](https://www.rsc.org/images/entities/char_2009.gif) :
:![[thin space (1/6-em)]](https://www.rsc.org/images/entities/char_2009.gif) v, g
v, g![[thin space (1/6-em)]](https://www.rsc.org/images/entities/char_2009.gif) :
:![[thin space (1/6-em)]](https://www.rsc.org/images/entities/char_2009.gif) l) at room temperature for consistency before passing through the reactor (Fig. 1). The outflow passed through a six-way valve attached to a 250 μL reagent loop and a Gilson FC 204 fraction collector for sample analysis. The bulk of the reaction stream was collected in a Parr pressure vessel, with the system pressurized by an inert gas (N2) from a cylinder. A slow bleed vent was also incorporated to dilute the CO and to account for the liquid displacement. The samples from the fraction collector were diluted with acetone and analyzed by GC (Agilent HP 6890), with the results calibrated to the internal standard (naphthalene). The system was controlled through a Matlab (version 2010b) interface allowing automated control of reaction time and temperature and the collection of the reaction aliquot for analysis.
l) at room temperature for consistency before passing through the reactor (Fig. 1). The outflow passed through a six-way valve attached to a 250 μL reagent loop and a Gilson FC 204 fraction collector for sample analysis. The bulk of the reaction stream was collected in a Parr pressure vessel, with the system pressurized by an inert gas (N2) from a cylinder. A slow bleed vent was also incorporated to dilute the CO and to account for the liquid displacement. The samples from the fraction collector were diluted with acetone and analyzed by GC (Agilent HP 6890), with the results calibrated to the internal standard (naphthalene). The system was controlled through a Matlab (version 2010b) interface allowing automated control of reaction time and temperature and the collection of the reaction aliquot for analysis.
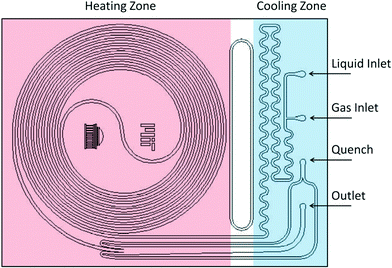
Two reactor systems were used: a 230 μL silicon nitride spiral reactor26,27 and a 2 mL stainless steel tube28 (Waters HPLC column, 100 mm × 5 mm I.D.) filled with stainless steel spheres (60–125 μm) housed within an aluminum heating block, with a steel nut and approximately 3 cm of steel tubing leading to the entrance (Fig. 2).
The overall reaction rate with respect to temperature was then investigated in situ using the ReactIR iC10 from Mettler-Toledo. Advantageously, the system could be used in a biphasic gas–liquid system, due to the preferential wetting of the diamond window by the liquid phase and the short penetration depth of the ATR probe. The first reaction using the ReactIR system revealed that there was no single peak that could be used to easily monitor the formation of the product and consumption of the starting material. In this example, both the mono and double insertion products possess characteristic amide IR-absorption bands that overlap and the starting material has very few characteristic bands, which would complicate monitoring its disappearance. To this end, the built-in software of the system performed a principal-component least squares regression analysis, which required some initial calibrations.29 In our case, the individual components (starting material (1), mono (2), di (3), DBU and naphtalene) were dissolved in 1![[thin space (1/6-em)]](https://www.rsc.org/images/entities/char_2009.gif) :
:![[thin space (1/6-em)]](https://www.rsc.org/images/entities/char_2009.gif) 1 v
1 v![[thin space (1/6-em)]](https://www.rsc.org/images/entities/char_2009.gif) :
:![[thin space (1/6-em)]](https://www.rsc.org/images/entities/char_2009.gif) v toluene
v toluene![[thin space (1/6-em)]](https://www.rsc.org/images/entities/char_2009.gif) :
:![[thin space (1/6-em)]](https://www.rsc.org/images/entities/char_2009.gif) morpholine and measured in the flow cell at different concentrations (0.02, 0.04, 0.06, 0.08, and 0.1 M).
morpholine and measured in the flow cell at different concentrations (0.02, 0.04, 0.06, 0.08, and 0.1 M).
Results and discussion
Initial studies using p-bromobenzonitrile in the silicon microreactor
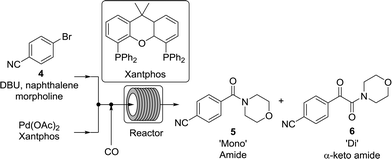
While numerous single-phase automated screening studies are known, two-phase gas–liquid systems are more complex, and, as a result, there are significantly fewer examples of automated screenings across multiple reaction variables.30,31 In our initial study, the 230 μL silicon nitride spiral reactor and the activated aryl bromide, p-bromobenzonitrile (4), were used (Scheme 2). A UNIT mass flow controller regulated the flow of CO. A residence time of 3 minutes was realized with a CO mass flow rate of 0.96 sccm at a pressure of 8.3 bar, corresponding to a CO gas phase concentration of 0.37 M, and a liquid phase p-bromobenzonitrile concentration of 0.1 M. A series of experiments were programmed to take samples at 5 °C intervals between 90–160 °C. An equilibrium time of 3.5 residence volumes (3 min × 3.5 = 10.5 minutes) was employed between collections to ensure no contamination between experiments (Fig. 3). As can be seen in Fig. 3, the product ratio demonstrates a substantial temperature dependence; above 130 °C, the proportion of the double insertion product (6) reduced substantially with respect to the mono product (5), in agreement with prior carbonylation studies.32–35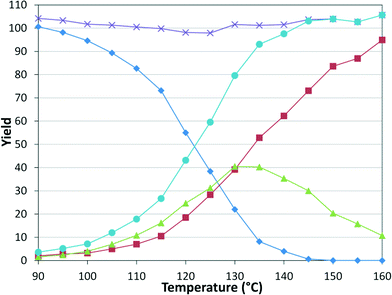 | ||
Fig. 3 Silicon reactor, τ = 3 min, PCO = 8.3 bar, using p-bromobenzonitrile. Aryl bromide starting material ( ), amide product ( ), amide product ( ), α-keto amide product ( ), α-keto amide product ( ), total product ( ), total product ( ), and mass balance ( ), and mass balance ( ). ). | ||
These results prompted us to evaluate the pressure dependency of the reaction (Fig. 4). Continuing with constant 1![[thin space (1/6-em)]](https://www.rsc.org/images/entities/char_2009.gif) :
:![[thin space (1/6-em)]](https://www.rsc.org/images/entities/char_2009.gif) 1, v
1, v![[thin space (1/6-em)]](https://www.rsc.org/images/entities/char_2009.gif) :
:![[thin space (1/6-em)]](https://www.rsc.org/images/entities/char_2009.gif) v, g
v, g![[thin space (1/6-em)]](https://www.rsc.org/images/entities/char_2009.gif) :
:![[thin space (1/6-em)]](https://www.rsc.org/images/entities/char_2009.gif) l, the pressures of 2.8, 5.5, 8.3, and 12.4 bar were examined, where 2.8 bar was the lowest reliable flow rate of the mass flow meter and 12.4 bar was the pressure limit of the syringe pumps. The results demonstrate that decreasing CO pressure leads to a higher overall rate and increasing the pressure leads to a higher proportion of the double insertion α-keto amide product (6).
l, the pressures of 2.8, 5.5, 8.3, and 12.4 bar were examined, where 2.8 bar was the lowest reliable flow rate of the mass flow meter and 12.4 bar was the pressure limit of the syringe pumps. The results demonstrate that decreasing CO pressure leads to a higher overall rate and increasing the pressure leads to a higher proportion of the double insertion α-keto amide product (6).
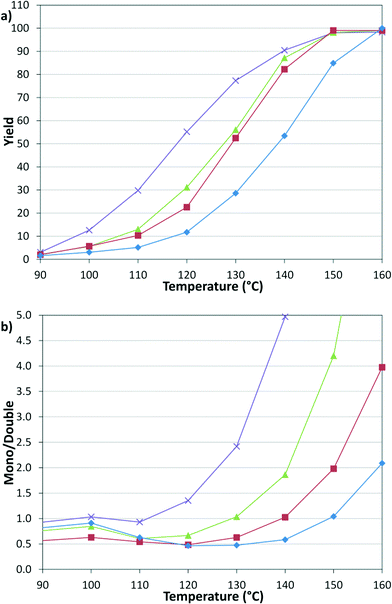 | ||
Fig. 4 Temperature and pressure dependency of (a) yield and (b) selectivity. 2.8 ( ), 5.5 ( ), 5.5 ( ), 8.3 ( ), 8.3 ( ), 12.4 ( ), 12.4 ( ) bar. ) bar. | ||
Given the fixed 1![[thin space (1/6-em)]](https://www.rsc.org/images/entities/char_2009.gif) :
:![[thin space (1/6-em)]](https://www.rsc.org/images/entities/char_2009.gif) 1, v
1, v![[thin space (1/6-em)]](https://www.rsc.org/images/entities/char_2009.gif) :
:![[thin space (1/6-em)]](https://www.rsc.org/images/entities/char_2009.gif) v, g
v, g![[thin space (1/6-em)]](https://www.rsc.org/images/entities/char_2009.gif) :
:![[thin space (1/6-em)]](https://www.rsc.org/images/entities/char_2009.gif) l proportions throughout these studies, a concern whether mass transfer limitations might influence the observed trends was raised. To this end, reactions were repeated with varying liquid and gas slug lengths, which would change the mass transfer coefficient. No effect on the product distribution was observed, implying that the mass transfer rate was greater than the intrinsic kinetic reaction rate.
l proportions throughout these studies, a concern whether mass transfer limitations might influence the observed trends was raised. To this end, reactions were repeated with varying liquid and gas slug lengths, which would change the mass transfer coefficient. No effect on the product distribution was observed, implying that the mass transfer rate was greater than the intrinsic kinetic reaction rate.
Aminocarbonylations using the tubular reactor
Upon establishing our automated system, we examined the scope of the reaction by varying both the electrophilic and nucleophilic species. The tubular reactor with a residence time of 8.3 minutes and a pressure of 8.3 bar was used. The six pairs of reactants were chosen to permit some comparison between the different species (Table 1, Fig. 5).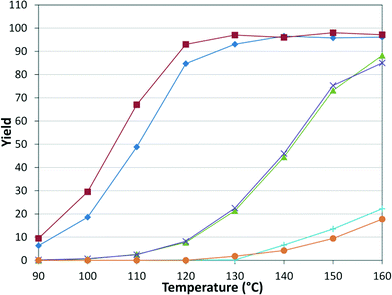 | ||
Fig. 5 Amide yield in substrate scope examination. Tubular reactor: τ = 8.3 min, P = 8.3 bar. In reference to the combinations in Table 1: I ( ), II ( ), II ( ), III ( ), III ( ), IV ( ), IV ( ), V ( ), V ( ), VI ( ), VI ( ). ). | ||
As expected, electron deficient aryl halides (I and II) proved to be more reactive due to the relative ease of oxidative addition. The change from morpholine to cyclohexylamine did not result in a significant difference of reactivity. The p-phenyl examples (III and IV) showed less reactivity. The more deactivated substrates involving p-methoxy-bromobenzene and 2-chloropyridine36 (V and VI) proved unreactive until high temperatures.
Kinetics
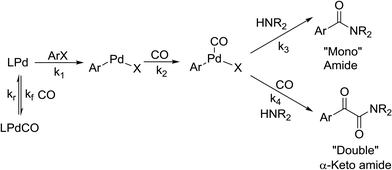
There is significant interest in understanding the kinetics of this gas–liquid system, especially to determine the effects that dictate the product ratio. For aryl bromides, the oxidative addition of palladium is often assumed to be the rate-determining step35 after which the reaction bifurcates. Thus, overall conversion should be able to be modeled without needing to account for product selectivity (Scheme 3), and the rate of loss of starting material (ArX) can be written as a first-order reaction in both aryl halide and palladium (eqn (1)). Furthermore, we observed that as the pressure of carbon monoxide increased, the rate of the reaction decreased, implying that carbon monoxide was reversibly poisoning the palladium catalyst. The next simplification was to assume a steady state approximation for the active palladium catalyst, LPd. By using this approximation, an expression for concentration of active palladium, [Pd] (eqn (2)), is found and can be substituted in eqn (1). This leads to eqn (3), a pseudo first-order expression for the rate of reaction: | (1) |
 | (2) |
 | (3) |
 | (4) |
The result of this simplification predicts that the observed rate, kobs, is proportional to the initial concentration of the palladium used and inversely proportion to the concentration of the carbon monoxide in the liquid phase of the system. This assumes no palladium deactivation. No palladium black was observed, and we have shown previously in a similar system that palladium can be recycled several times with no loss of activity.37 With varying pressures of carbon monoxide Henry's Law predicts that [CO] ∝ CO pressure; hence a higher pressure will adversely affect the rate of the reaction. The temperature dependence of the Henry's Law constant for the solvent system was modeled using Aspen Plus and demonstrated only a slight reduction in solution phase CO concentration at the highest reaction temperatures studied (details provided in ESI†). Finally, after coordination of the first molecule of carbon monoxide the two products were formed.
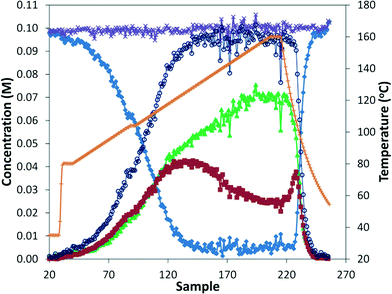
The reaction was run in the tubular reactor at 8.3 bar and with 8.3 minutes residence time. With the aid of the in situ monitoring, we continuously increased the reaction temperature at constant residence time, which would be analogous to a time profile found in batch studies.25 In this example, the temperature was increased by 1 °C every 2 minutes (Fig. 6). The temperature was held at 104 °C for 4 minutes to assist in aligning temperature and concentration data. Additionally, the concentration profiles flatten at this point, showing that the system is never operating far from steady state. The pattern observed was the same as for the earlier steady state analysis, where the ratio of mono/di insertion products remains constant until approximately 120 °C, above which the ratio of mono increases substantially. However, the IR analysis is less sensitive to lower concentrations, especially the starting material, causing significant noise beyond approximately 95% conversion. Lastly, the data after reaction heat was switched off suggests that even more rapid analysis under true transient conditions is possible.
From these data it is possible to form an Arrhenius plot of ln(kobs) vs. 1/T to determine the activation energy from the slope (see Fig. S5†). In principal, the pre-exponential factor can also be determined (the intercept of y-axis), but the substantial extrapolation required can present significant errors. The system demonstrates a steady slope from 80 °C to 120 °C, but beyond 120 °C there appears to be a change in the rate-limiting step. The system was applied at three conditions as described in Table 2, resulting in similar activation energies with relatively small error bars represented by one standard deviation.
| Exp | P CO (bar) | mol% Pd | E A (kJ mol−1) |
|---|---|---|---|
| 1 | 8.3 | 2 | 117.6 ± 0.9 |
| 2 | 13.8 | 2 | 115.2 ± 0.6 |
| 3 | 9.3 | 1 | 116.4 ± 0.4 |
Similar Arrhenius analyses were performed at steady state for reactions under different conditions in the microreactor and tubular reactor using offline GC analysis.
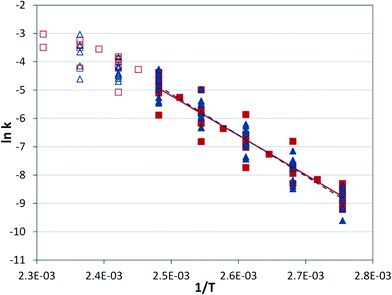
At a given temperature, the conditions of the reaction cause a significant range in the reaction rate constant (Fig. 7), but the correlation with temperature holds across conditions. The same behavior observed in the IR experiments can be seen at high temperatures, where the apparent rate constant begins to decrease as the rate-limiting step begins to shift.
As the reaction rate appeared to vary linearly with the inverse of CO pressure, the rate constant equation was simplified to
 | (5) |
| Experiment | E A (kJ mol−1) |
|---|---|
| Tubular reactor temperature ramp with online IR analysis | 116.4 ± 1.2 |
| Microreactor steady states with offline GC analysis | 116.1 ± 5.5 |
| Tubular reactor steady states with offline GC analysis | 121.1 ± 5.6 |
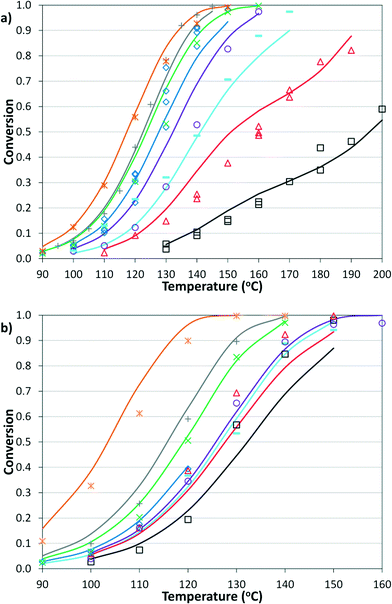
The simplified first-order analysis only holds below 120 °C, and the full reaction scheme must be considered to completely model both reaction regimes. To this end, the selectivity was modeled using the Yamamoto mechanism.33 The selectivity at the first reaction branch (Scheme 4), S1, was modeled as shown in eqn (6). Likewise, the selectivity at the second branch point, S2, was modeled as shown in eqn (7). The simplification shown in the equations allows each selectivity to be modeled with two variables based upon the ratio of the pre-exponential factors and the difference in the activation energies of the two reactions involved. Matlab was used to fit the data for the microreactor at several sets of experimental conditions. The activation energies used were those found by the above Arrhenius analysis. The results for the model and experimental conversion for both the microreactor and tubular reactor are given in Fig. 8, with model parameters in Table 4. The selectivity for the microreactor results are shown in Fig. 9. The model trends for conversion and selectivity match the experimental data. Additionally, as the tubular reactor conversion data were not used to fit the model, instead these points served as a validation set for the model.
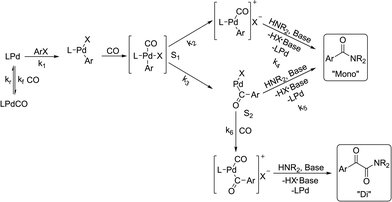 | ||
| Scheme 4 Model to which kinetic parameters were fitted based upon the Yamamoto mechanism.33 | ||
| k 0 [1] | 1.33 × 10¹⁷ L mol−1 s−1 |
| E A [1] | 116.4 kJ mol−1 |
| k 0 [4] | 1.11 × 10⁶ s−1 |
| E A [4] | 55.6 kJ mol−1 |
| (EA[2] − EA[3]) | 107 kJ mol−1 |
| k 0 [3]/k0[2] | 2.42 × 10⁻¹³ |
| (EA[5] − EA[6]) | 38.7 kJ mol−1 |
| k 0 [6]/k0[5] | 2.01 × 10⁻⁴ |
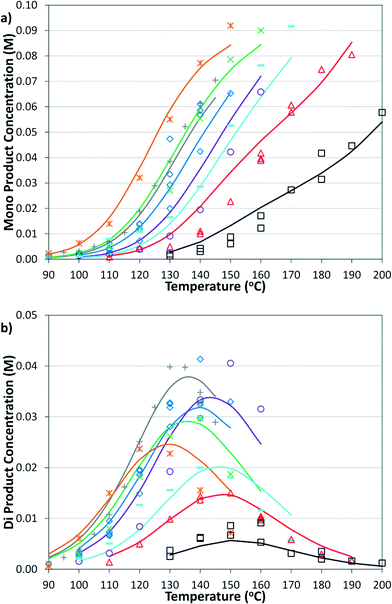 | ||
| Fig. 9 Summary of model and experimental selectivity in the microreactor for a) mono product and b) di product. Symbols correspond to those in Fig. 8a. | ||

| (6) |

| (7) |
The change in trends around 120 °C can be explained as a change in rate-determining step by the combined effects of temperature on S1 and the subsequent reactions. Thus, as temperature increases, the reaction increasingly favors the upper pathway through the more entropically favored intermediate that leads solely to the mono product. However, the next step in the mechanism has a slower rate than the oxidative addition, causing that to become the rate-limiting step. Further model details are provided in the ESI.†
Conclusions
We have successfully demonstrated an in-line automated screening platform suitable for continuous gas–liquid flow systems. The applicability of the system was proven for the successful carbonylation of aryl bromides. The effect of temperature, residence time, gas stoichiometry, and pressure can be easily controlled with minimum operator intervention beyond the initial start-up and shut-down processes. It is expected that the facile control of the reaction conditions and ease of data capture will have a significant impact on the study of reaction kinetics leading to more efficient catalytic processes.Having successfully demonstrated the automated screening system using both IR and GC analysis, the kinetics of the palladium-catalyzed aminocarbonylation of aryl bromides were further investigated. The reaction was found to be divided into two temperature regimes. For the lower temperature regime, this study compared traditional, steady-state experiments paired with offline GC analysis to transient temperature ramp experiments paired with online IR analysis and found that, while both methods provided similar activation energies, the latter method was significantly more efficient in both time and reagents. Additionally, both the conversion and selectivity for both regimes were modeled in good agreement with experimental data. Below 120 °C, the oxidative addition was found to be the rate-limiting step, with nearly equal selectivity for the two products. However, at higher temperatures, the selectivity shifted to a pathway that provides only the mono product from a slower intermediate step, reducing the overall reaction rate.
Acknowledgements
The support of the Novartis-MIT Centre for Continuous Manufacturing is acknowledged. CDS and KFJ thank Amgen, Thousand Oaks for initial sponsorship of this project.Notes and references
- C. L. Allen and J. M. Williams, Chem. Soc. Rev., 2011, 40, 3405–3415 RSC.
- A. Brennführer, H. Neumann and M. Beller, Angew. Chem., Int. Ed., 2009, 48, 4114–4133 CrossRef PubMed.
- C. F. J. Barnard, Organometallics, 2008, 27, 5402–5422 CrossRef CAS.
- C. F. J. Barnard, Org. Process Res. Dev., 2008, 12, 566–574 CrossRef CAS.
- M. Beller and M. Eckert, Angew. Chem., Int. Ed., 2000, 39, 1010–1027 CrossRef CAS.
- Y. Q. Wan, M. Alterman, M. Larhed and A. Hallberg, J. Org. Chem., 2002, 67, 6232–6235 CrossRef CAS PubMed.
- Y. Wan, M. Alterman, M. Larhed and A. Hallberg, J. Comb. Chem., 2003, 5, 82–84 CrossRef CAS PubMed.
- J. Ruan and J. Xiao, Acc. Chem. Res., 2011, 44, 614–626 CrossRef CAS PubMed.
- P. Appukkuttan, L. Axelsson, E. Van der Eycken and M. Larhed, Tetrahedron Lett., 2008, 49, 5625–5628 CrossRef CAS.
- W. Ren and M. Yamane, J. Org. Chem., 2010, 75, 8410–8415 CrossRef CAS PubMed.
- B. Desai and C. O. Kappe, J. Comb. Chem., 2005, 7, 641–643 CrossRef CAS PubMed.
- S. Saaby, K. R. Knudsen, M. Ladlow and S. V. Ley, Chem. Commun., 2005, 2909–2911 RSC.
- C. Csajági, B. Borcsek, K. Niesz, I. Kovács, Z. Székelyhidi, Z. Bajkó, L. Ürge and F. Darvas, Org. Lett., 2008, 10, 1589–1592 CrossRef PubMed.
- P. Koos, U. Gross, U. A. Polyzos, M. O'Brien, I. Baxendale and S. V. Ley, Org. Biomol. Chem., 2011, 9, 6903–6908 CAS.
- M. O'Brien, N. Taylor, A. Polyzos, I. R. Baxendale and S. V. Ley, Chem. Sci., 2011, 2, 1250–1257 RSC.
- P. W. Miller, N. J. Long, A. J. de Mello, R. Vilar, H. Audrain, D. Bender, J. Passchier and A. Gee, Angew. Chem., 2007, 119, 2933–2936 CrossRef.
- W. M. Philip, E. J. Lucy, J. D. Andrew, D. G. Antony, J. L. Nicholas and V. Ramon, Adv. Synth. Catal., 2009, 351, 3260–3268 CrossRef.
- J. Balogh, A. Kuik, L. Ürge, F. Darvas, J. Bakos and R. Skoda-Földes, J. Mol. Catal. A: Chem., 2009, 302, 76–79 CrossRef CAS.
- R. L. Hartman, J. P. McMullen and K. F. Jensen, Angew. Chem., Int. Ed., 2011, 50, 7502–7519 CrossRef CAS PubMed.
- S. Marre, A. Adamo, S. Basak, C. Aymonier and K. F. Jensen, Ind. Eng. Chem. Res., 2010, 49, 11310–11320 CrossRef CAS.
- F. Trachsel, C. Hutter and P. R. von Rohr, Chem. Eng. J., 2008, 135, 309–316 CrossRef.
- K. Geyer, T. Gustafsson and P. H. Seeberger, Synlett, 2009, 15, 2382–2391 Search PubMed.
- J. S. Moore and K. F. Jensen, Org. Process Res. Dev., 2012, 16, 1409–1415 CrossRef CAS.
- N. Heublein, J. S. Moore, C. D. Smith and K. F. Jensen, RSC Adv., 2014, 4, 63627–63631 RSC.
- J. S. Moore and K. F. Jensen, Angew. Chem., Int. Ed., 2014, 53, 470–473 CrossRef CAS PubMed.
- M. W. Bedore, N. Zaborenko, K. F. Jensen and T. F. Jamison, Org. Process Res. Dev., 2010, 14, 432–440 CrossRef CAS.
- N. Zaborenko, M. W. Bedore, T. F. Jamison and K. F. Jensen, Org. Process Res. Dev., 2011, 15, 131–139 CrossRef CAS.
- J. R. Naber and S. L. Buchwald, Angew. Chem., Int. Ed., 2010, 49, 9469–9474 CrossRef CAS PubMed.
- DS Series Sampling Technology Mettler Toledo, LLC, http://us.mt.com/us/en/home/products/L1_AutochemProducts/L2_in situSpectrocopy/AgX-FiberConduit-Sampling-Technology-DS-Series.html, Accessed Nov. 7, 2010 Search PubMed.
- J. P. McMullen and K. F. Jensen, Annu. Rev. Anal. Chem., 2010, 3, 19–42 CrossRef CAS PubMed.
- E. R. Murphy, J. R. Martinelli, N. Zaborenko, S. L. Buchwald and K. F. Jensen, Angew. Chem., Int. Ed., 2007, 46, 1734–1737 CrossRef CAS PubMed.
- F. Ozawa, T. Sugimoto, Y. Yuasa, M. Santra, T. Yamamoto and A. Yamamoto, Organometallics, 1984, 3, 683–692 CrossRef CAS.
- Y.-S. Lin and A. Yamamoto, Organometallics, 1998, 17, 3466–3478 CrossRef CAS.
- F. Ozawa, N. Kawasaki, H. Okamoto, T. Yamamoto and A. Yamamoto, Organometallics, 1987, 6, 1640–1651 CrossRef CAS.
- F. Ozawa, H. Soyama, H. Yanagihara, I. Aoyama, H. Takino, K. Izawa, T. Yamamoto and A. Yamamoto, J. Am. Chem. Soc., 1985, 107, 3235–3245 CrossRef CAS.
- M. Beller, W. Mägerlein, A. F. Indolese and C. Fischer, Synthesis, 2001, 2001, 1098–1109 CrossRef.
- P. Li, J. S. Moore and K. F. Jensen, ChemCatChem, 2013, 5, 1729–1733 CrossRef CAS.
Footnote |
| † Electronic supplementary information (ESI) available: Model details plus GC and IR spectra. See DOI: 10.1039/c6re00007j |
| This journal is © The Royal Society of Chemistry 2016 |


