
Kinetics of nanocrystal synthesis in a microfluidic reactor: theory and experiment†
Richard M.
Maceiczyk
,
Leonard
Bezinge
and
Andrew J.
deMello
*
Department of Chemistry and Applied Biosciences, Institute of Chemical and Bioengineering, ETH Zürich, Vladimir Prelog Weg 1, 8093 Zürich, Switzerland. E-mail: andrew.demello@chem.ethz.ch
First published on 19th May 2016
Abstract
The processes occurring during nanocrystal nucleation and growth are currently not well understood. Herein, we theoretically and experimentally investigate the growth kinetics in colloidal nanocrystal synthesis. Using a novel microfluidic reactor integrating independent modules for nucleation and growth, we demonstrate the controlled, direct synthesis of high quality nanocrystals in high yield. For CdSe nanocrystals, we find that size tuning solely by variation of the reaction time and temperature does not yield product populations of optimal size dispersion or yield. Instead, we present an improved method for the synthesis of bespoke nanocrystals that relies on the controlled addition of precise amounts of additional precursor subsequent to nucleation and fine tuning of the reaction time and temperature in the second stage. Real-time spectroscopic monitoring of the produced crystals in conjunction with kinetic simulations confirms the close correspondence between the model and the experiment and elegantly quantifies the effects of temperature, concentration, additives and surfactants on conversion, growth and diffusion rates within the model framework. We show that the conversion of the precursor to a monomer follows a first order rate law and that the growth rate has a stronger temperature dependence than the conversion rate. Moreover, the surfactant concentration retards the reaction by inhibiting diffusion to the growing crystals whilst maintaining a uniform conversion rate. Finally, we demonstrate that diphenylphosphine, a common additive in CdSe synthesis, enhances the reaction rate by accelerating precursor conversion.
1 Introduction
Over the past 30 years, bottom–up (or wet chemical) methods for the synthesis of compound semiconductor nanocrystals (quantum dots) have evolved to a point where it is now possible to routinely synthesize a wide range of nanocrystals of various sizes and physicochemical properties.1–4 To produce high quality particles however, precise control of reagent and heat distributions throughout the reaction vessel must occur to ensure that all seeds and particles experience identical conditions during their nucleation and growth.5 Bulk chemical methods are typically inefficient at achieving such control and therefore adoption of complex reaction conditions or implementation of post-synthetic size selection is required to ensure that bulk reactions generate the desired materials of defined size and composition.6,7 In addition, it is well-recognized that nanocrystal syntheses are exquisitely sensitive to experimental conditions, with minuscule changes in reagent concentration or composition leading to significant deviations in particle properties.8–11 In this respect, a dearth of appropriate on-line monitoring methods and the challenge of changing reaction parameters on-the-fly substantially hamper reproducibility and limit the applicability of bulk chemical methods.To address the above limitations, many researchers have focused their attention on the use of continuous- and segmented-flow microfluidic reactors as environments in which to perform nanocrystal synthesis.12 Both capillary- and chip-based microfluidic reactors have demonstrated their superior capabilities in the synthesis of numerous materials including CdSe,13,14 all-inorganic perovskites,15 CdS,16 InP,17 PbS,18 Ag19 and Au,20 to name but a few. The facile integration of high efficiency on-line monitoring methods with such microfluidic reactors has led to a number of interesting and previously unexplored applications.21 These include the rapid real-time optimization of nanomaterial properties using search algorithms in conjunction with fully autonomous reaction control22–25 and the precise extraction of kinetic data on a short timescale for the refined analysis of nucleation and growth processes.26–32
It is significant to note that detailed theoretical understanding of the processes occurring during nanocrystal formation has not developed at a pace comparable to synthetic capabilities. Indeed, most activities in this area rationalize the synthetic processes and experimental results using basic thermodynamic arguments.33–37 While a wide range of theories (describing nucleation and growth kinetics) exist,35,38–43 few if any have been appraised through experimental evaluation. Accordingly, to address such shortcomings, we herein demonstrate how microfluidic technology can be used as a powerful experimental tool in developing and validating theoretical models of quantum dot nucleation and growth. We initially utilize a kinetic theory developed by Rempel, Bawendi and Jensen44 that describes the combined phenomena of nucleation and growth. Significantly, we then expand the scope of this theory through inclusion of a diffusion term that allows rationalization of the influence of surfactant concentration on the synthesis. After validating the applicability of the theory to the synthesis of CdSe quantum dots, we demonstrate that the outcome of the synthesis at early reaction times can be predicted in an efficient manner. Finally, we combine the refined theory with experimental measurements (using a two-stage reactor incorporating distinct high and low temperature zones) to quantitatively assess the effect that additives and surfactants have on the synthetic process.
2 Results and discussion
Fig. 1 presents a schematic of the two-stage microfluidic reactor used throughout this work. In brief, a syringe pump equipped with glass syringes guides a precursor stream (P1) through a stainless steel capillary maintained at a temperature between ambient temperature and 400 °C (T1). After this first stage, the product stream passes through an on-line absorbance spectrometer and is then combined with a secondary precursor stream (P2). Subsequently, a perfluorinated heat transfer fluid (HT 270) segregates the solution into a stream of isolated droplets that meander through a second heating zone which controls the temperature between ambient temperature and 250 °C (T2). The operation of the reactor is entirely computer controlled by an in-house developed LabView program that autonomously runs through a defined set of experimental parameters. To ensure access to the maximum number of experiments for a given precursor volume, all syringes should ideally empty at the same rate. This means that the volumetric flow rate in the second stage is defined by the volumetric flow rate adopted in the first stage. Accordingly, it is necessary to adopt capillary diameters for the first and second stages based on the desired residence times in each stage. Fig. 1A displays the dependence of the residence time in the second stage on the residence time in the first stage for a capillary inner diameter (ID) of 180 μm in the first stage together with the corresponding flow rate for an individual syringe. Residence times between 200 ms and 2 s in the first stage yield residence times between 6 and 60 s in the second stage for a 500 μm ID capillary and between 25 and 250 s for a 1000 μm ID capillary.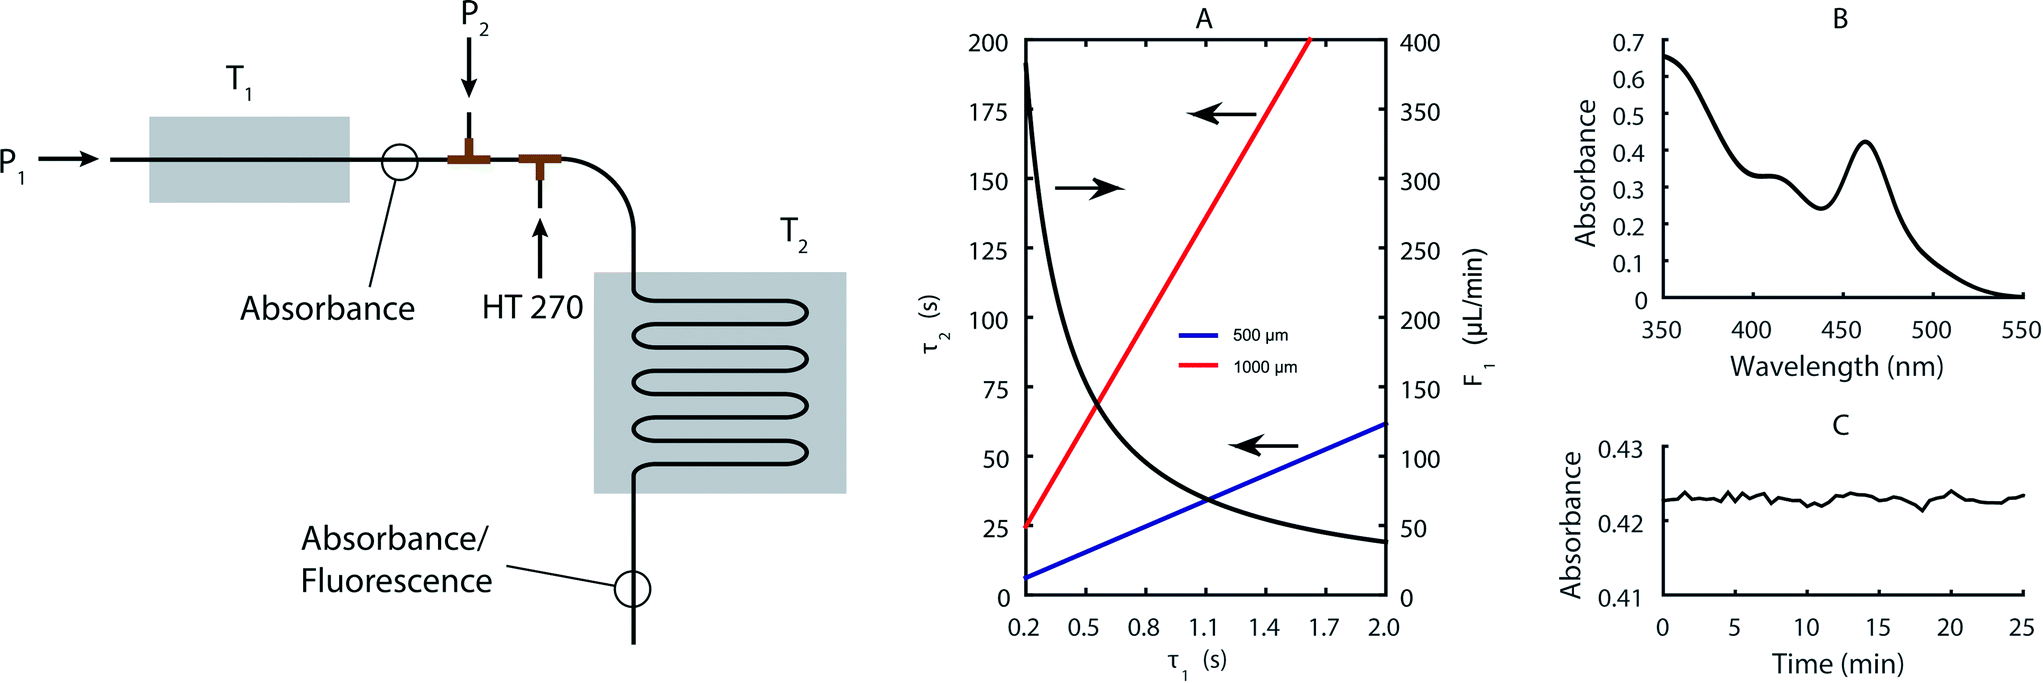 | ||
| Fig. 1 Left: Schematic drawing of the two-stage reactor indicating the points where the precursor streams (P1, P2) and the continuous phase (HT 270) are introduced as well as the points where fluorescence and absorbance measurements are taken. Right: (A) Flow rate in the first stage (F1) and residence time in the second stage (τ2) as a function of the residence time in the first stage (τ1) for two different capillary inner diameters in the second stage. The calculation for τ2 is made under the assumption that the flow rate of the second precursor stream is the same as the first, and that the volume of the oil flow is twice the volume of the precursor flow. The capillary inner diameter of the first stage is fixed at 180 μm. (B) Overlay of 50 absorbance spectra taken every 30 s at 260 °C and 0.6 s residence time in the first stage, using our standard reaction conditions (see text) and a CdOA concentration of 10 mmol L−1. (C) Time trace of absorbance (at the primary absorbance peak) corresponding to the spectra in (B). | ||
Fig. 1B and C illustrate the absorption spectrum and peak absorbance values for synthesized particle populations over a period of 25 minutes, and demonstrate the exceptional reactor stability achieved in the first stage. Significantly, resistance against fouling in the second stage is almost indefinite due to the adoption of a segmented-flow regime (where the continuous perfluorinated phase preferentially wets the capillary walls). Conversely, the time to failure in the first stage is strongly dependent on the capillary inner diameter, with larger inner diameters exhibiting significantly longer operational lifetimes (data not shown). However, larger capillary diameters also raise the required reagent flow and thus decrease the number of experiments that can be performed for a given amount of starting reagent. For the current experiments we found that a 180 μm ID capillary yields a good compromise between the operational lifetime and flow rates, allowing at least eight hours of continuous operation and over 60 parameter combinations for each loading. The combination of different precursor streams to scan different chemistries in the second stage is simple to implement and process due to the fast mixing timescales that are achieved in droplets.45,46 Even so, for the first stage, we use pre-mixed precursor solutions to ensure that slow mixing within continuous flows does not introduce appreciable measurement error. Temperature adjustments take less than a minute when heating and several minutes when cooling due to slow dissipation of heat away from the reactor. Once the temperature is within ±0.5 K of the set value, the precursor solution is introduced at the required flow rate. After three times τ1, the output of the first stage is stable and the spectrometer collects the desired spectra. After another  times τ2, the computer measures the fluorescence spectra originating from the products at the outlet of the second stage. We found that this procedure yields optimal results in terms of reproducibility of the experiments and capillary lifetime.
We chose CdSe as a model material because its synthesis has been investigated extensively over the past 20 years and many physical parameters (including average size and population size distributions) can be directly inferred from absorption and fluorescence spectra. Unless specified otherwise, we use octadecene (ODE) as the solvent, cadmium oleate (CdOA) with a Cd to OA ratio of 1![[thin space (1/6-em)]](https://www.rsc.org/images/entities/char_2009.gif) :8 as a cadmium precursor and selenium trioctylphosphine (SeTOP) with a Se to TOP ratio of 1:4 as a selenium precursor. To accelerate conversion, we add 1 eq. of diphenylphosphine (DPP) to the freshly prepared SeTOP solution.8 We use a SeTOP to CdOA ratio of 2:1 in all experiments. This chemistry produces particles of spherical shape.
:8 as a cadmium precursor and selenium trioctylphosphine (SeTOP) with a Se to TOP ratio of 1:4 as a selenium precursor. To accelerate conversion, we add 1 eq. of diphenylphosphine (DPP) to the freshly prepared SeTOP solution.8 We use a SeTOP to CdOA ratio of 2:1 in all experiments. This chemistry produces particles of spherical shape.
In the first experiment, we assess the effects that temperature and residence time in both the first and second stages have on the outcome of the synthesis without adding any precursor between stages and using a precursor solution (P1) with a CdOA concentration of 10 mmol L−1. Fig. 2 shows the representative spectra from such a screen. We find that increasing T1 from 220 to 300 °C (Fig. 2A) and increasing τ1 from 200 ms to 1 s (Fig. 2B) lead to the formation of larger quantum dots at the outlet of the first stage. After such short reaction times in the first stage, the formed nanoparticles are still very small and thus exhibit appreciable defect emission, making absorbance spectroscopy the most useful tool for on-line particle characterization. The position of the first absorbance peak on the low energy side allows direct extraction of the mean size of the synthesized particles, whereas the absorbance value at the peak corresponds to the particle concentration. Functional relations of such an analysis have been previously described by Jasieniak and co-workers.53 Subsequently, we introduce additional precursor between stages one and two. The concentration of the added precursor stream (P2) is five times the initial concentration and the flow rate is the same as the flow rate of the initial stream (P1). If we fix τ1 at 500 ms and T1 at 280 °C, while varying T2 from 130 to 250 °C with τ2 = 128 s, the emission maxima shift from 490 to 600 nm (Fig. 2C), thus covering a large portion of the wavelength range accessible by size tuning of CdSe.47 Performance of a similar experiment where T2 is maintained at 200 °C and T1 varied from 200 to 320 °C demonstrates that the emission maximum only shifts from 560 to 575 nm. This indicates that the temperature during the nucleation phase plays a minor role in controlling the final size of the synthesized particles (but is important during particle growth).
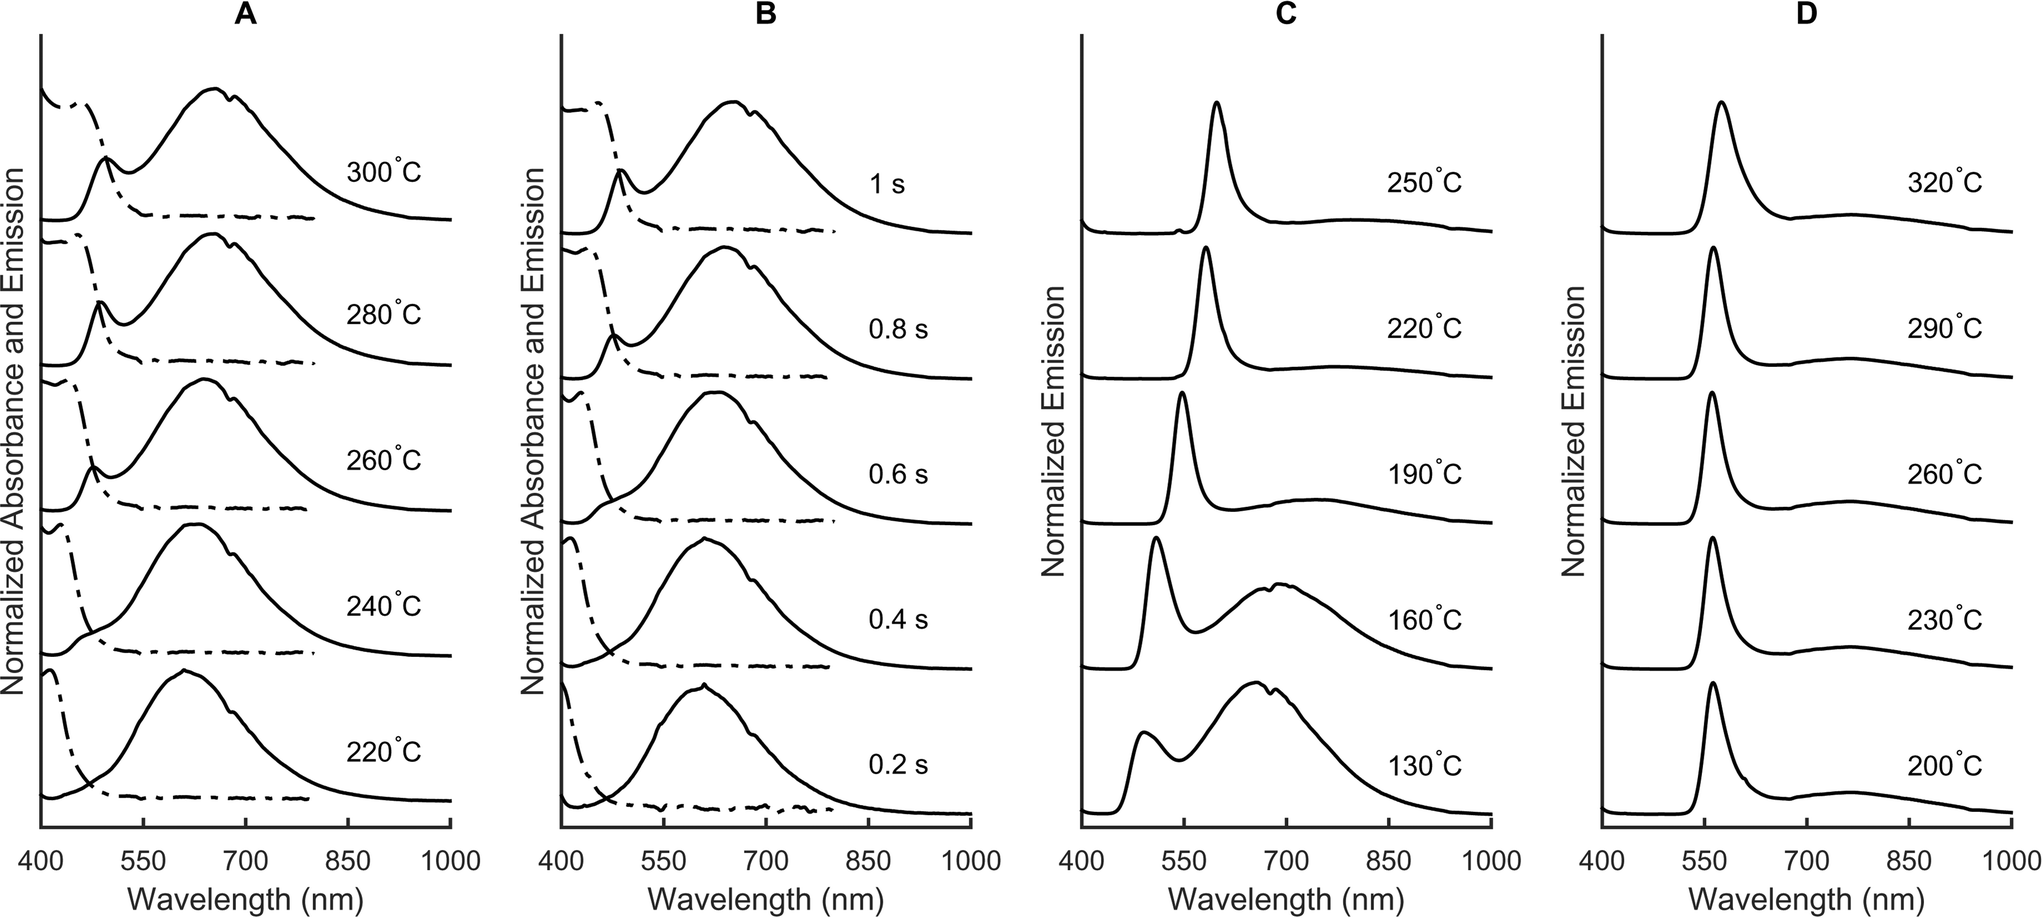 | ||
| Fig. 2 Absorbance (dashed line) and fluorescence (solid line) spectra obtained directly after the first stage, at different temperatures and with a constant reaction time of 0.5 s (A) and different reaction times at a temperature of 280 °C (B). In both (A) and (B), the CdOA concentration is 10 mmol L−1. Fluorescence spectra obtained after the second stage when changing the temperature in the second (C) or first (D) stage after adding additional precursor between stages one and two at five times the concentration of the first stage. The reaction time in the first stage for (C) and (D) is 500 ms. T1 is 280 °C in (C) and T2 is 200 °C in (D). | ||
Subsequently, we investigate the influence of precursor addition, residence time and temperature in a quantitative fashion. Here, the concentration of the added precursor stream (P2) is five times the initial concentration and the flow rate is the same as the flow rate of the initial stream (P1). To slow particle growth in the second stage and reduce defect emission, we increase the surfactant ratios in P2 to 1:10 for Cd to OA and to 1:8 for Se to TOP. Maintaining T1 at 260 °C, we use three combinations of τ1/τ2 (0.3 s/9 s, 0.5 s/15 s and 0.8 s/25 s) and vary T2 between 170 and 250 °C. Fig. 3 presents the raw spectra and extracted maxima and FWHM values for this set of experiments.
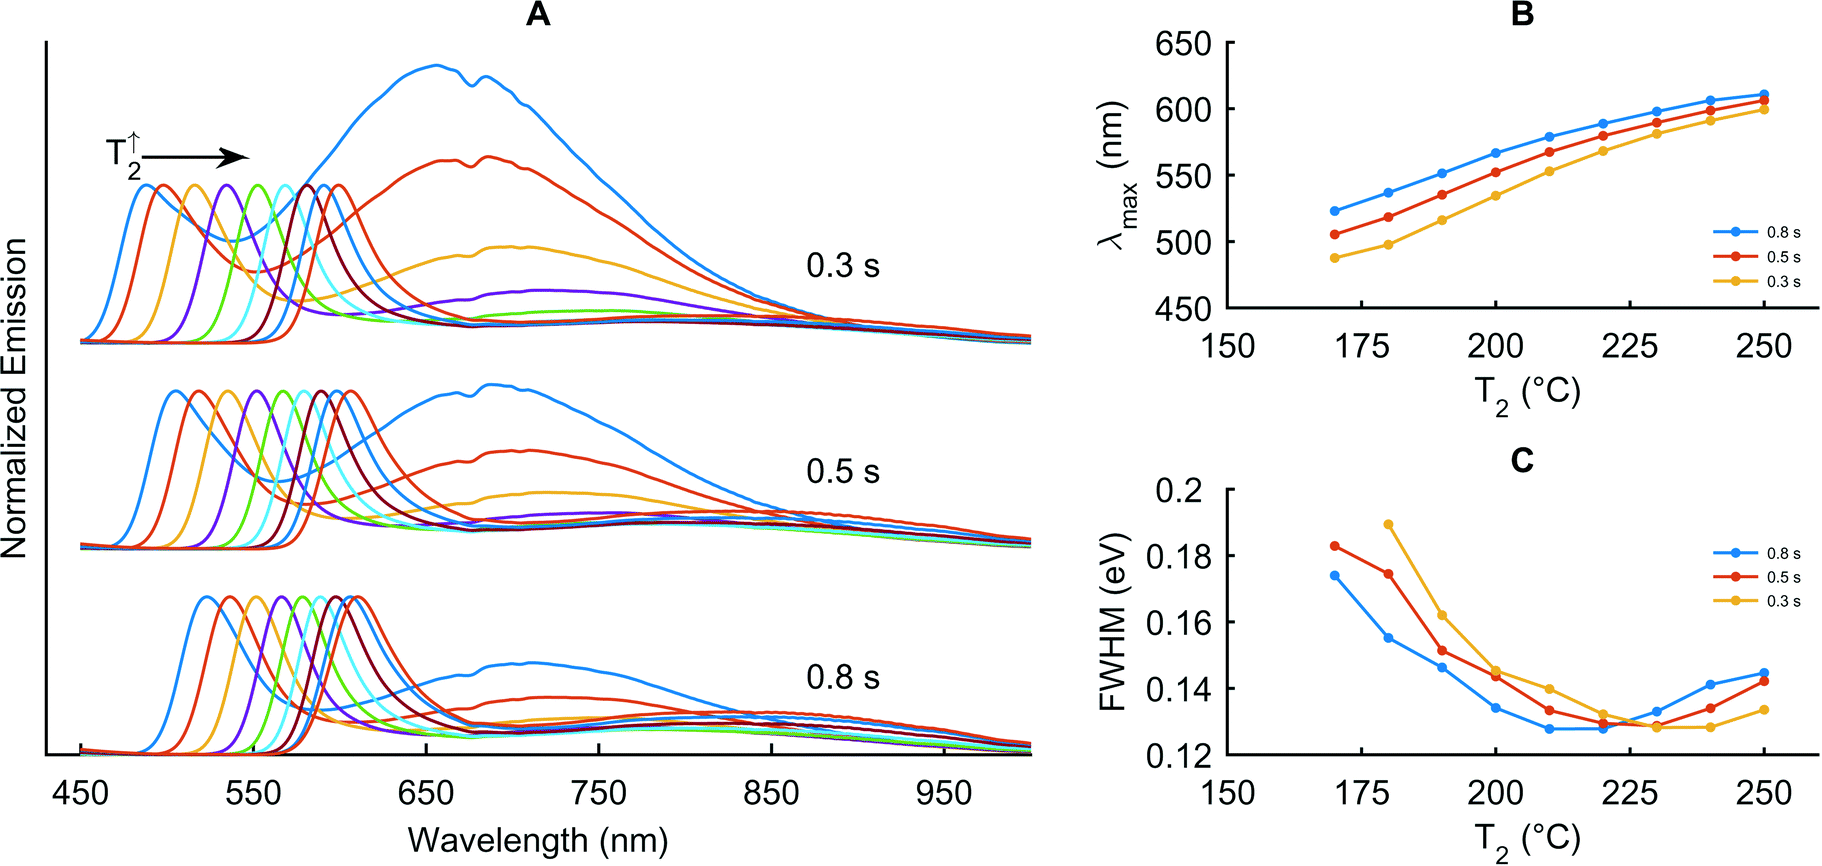 | ||
| Fig. 3 Effect of precursor addition, residence time and temperature at an initial Cd precursor concentration of 10 mmol L−1 in the first stage and with five times the concentration added between the two stages. A: Fluorescence spectra at different reaction times (τ1, τ2) in the first and second stages (see text). T1 is maintained at 260 °C and T2 is varied between 170 and 250 °C for each of the reaction time pairs. B: Corresponding high-energy emission maxima. C: Corresponding FWHM of the emission peaks. | ||
It is apparent that as the temperature of the second stage increases growth accelerates and defect emission is drastically reduced as the nanocrystals grow to larger sizes. The shortest residence time pair (0.3 s/9 s) provides access to the widest range of particle sizes, with FWHM values initially decreasing with rising T2 towards a minimum value and then increasing. Moreover, it is noted that the lower the residence time, the higher the temperature at which the FWHM reaches its minimum value. Interestingly, the value of the minimum FWHM is the same for each of the three residence time pairs. In addition, the corresponding λmax at the minimum FWHM is approximately 590 nm in all three cases. Accordingly, we conclude that neither the residence time in the first stage nor the residence time and temperature in the second stage are adept at tuning the final quantum dot size. Indeed, it is unhelpful to set T2 to match a desired λmax, not only because the FWHM will not be optimal, but also because terminating the reaction prematurely will waste reagent. Consequently, it is much better to adjust the amount of added reagent and the temperature in the second stage to obtain quantum dots with optimal yield, FWHM and emission maximum.
We then scanned a two-dimensional parameter plane defined by the added amount of precursor and T2 whilst keeping T1 at 260 °C and τ1 at 1 s (Fig. 4).
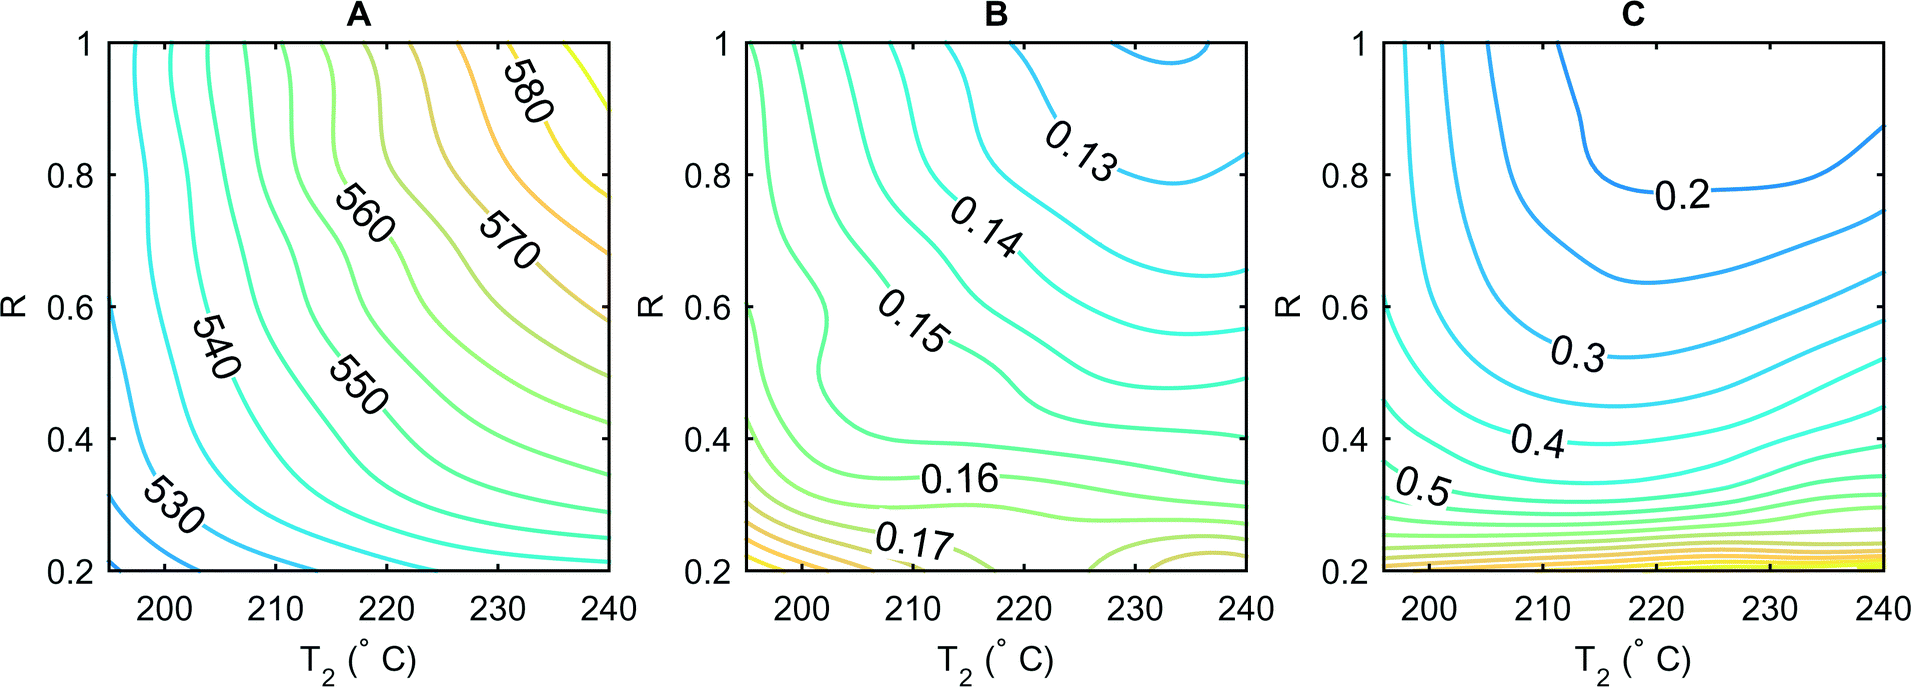 | ||
| Fig. 4 Dependence of the emission maximum (A, nm), the emission FWHM (B, eV) and the relative height of the defect emission peak compared to the high energy emission peak (C) on the amount of added precursor and the temperature in the second stage, whilst keeping T1 at 260 °C and τ1 at 1 s. The initial concentration of the Cd precursor is 10 mmol L−1 and the concentration of the added stream is varied between 6 and 30 mmol L−1 as parametrized by R (see main text). | ||
To enable efficient scanning of the amount of added precursor, we modify the inlet for precursor addition (P2 in Fig. 1) by integration of an additional mixing T-junction. This T-junction is connected to two syringes; one containing the precursor solution at three times the concentration of P1 as well as a higher amount of surfactant (Se to TOP of 1:10 and Cd to OA of 1:20) and the other containing dry octadecene. These two streams are combined at different ratios and added to a constant stream of P2. Adoption of this method allows the concentration in P2 to be varied from 0 to 30 mmol L−1. To quantify the amount of additional precursor, we introduce a new parameter R that is linearly dependent on this amount and defined as R = FH/(FH + FODE), where FH is the flow rate of the high concentration precursor stream and FODE the flow rate of dry octadecene. The data in Fig. 4 show one experiment consisting of 60 (ten different R × six different T2 values) parameter combinations. At high R, the nanocrystal size is strongly dependent on temperature and therefore the growth rate in the second stage. As R decreases, the maximum attainable size also decreases. Since all precursor molecules are consumed once this size is reached, a further temperature increase cannot change the size anymore (Fig. 4A). The FWHM values at higher R reduce with increasing temperature (Fig. 4B) since there is sufficient precursor available for the size distribution to narrow via size focusing whereas at low R, the FWHM values are invariant. Inspection of emission spectra indicates that at high R, the relative height of the defect peak (with respect to the band edge emission) decreases considerably as a function of T2 whilst at low R, insufficient precursor and surfactant are available to correct the surface defects (Fig. 4C). Finally, it can be seen that construction of a line from the bottom left to top right of the individual plots in Fig. 4 defines settings for both T2 and R that generate optimal values for size distribution, yield and spectral quality at each isoline that this line intersects.
Using the defined method, it is possible to synthesize a wide range of CdSe nanocrystal sizes in high chemical yield and with optimal size distributions for the employed chemistry. Limitations in quality and size of the end products are set mainly by the quality of the nuclei produced in the first stage. For industrial (or large scale) applications, an optimization procedure for the generation of the nuclei in the first stage is thus required to elucidate the physicochemical parameters that promote fast nucleation whilst preserving narrow size distributions. This task is a considerable challenge considering how incomplete the theoretical framework for both nucleation and growth kinetics is. Accordingly, we now adopt a kinetic model for nucleation and growth, which, in combination with the millisecond time resolution of our reactor, allows extraction of quantitative data regarding how temperature, concentration and chemistry influence nucleation and growth in the early stages of CdSe synthesis.
We choose to incorporate and refine a model recently developed by Rempel, Bawendi and Jensen44 to simulate the synthetic processes within the microfluidic reaction platform. We favor this model since most parameters are experimentally accessible and thus only few a priori assumptions need be made. Furthermore, implementation of variations in synthetic parameters such as reagent concentration, additive content and temperature is facile. Our experiments allow us to introduce diffusional processes into the model, which in turn provide a better understanding of experimental observations. We initially summarize the assumptions and rate equations used in the calculations and further provide a MatLab script that solves the model equations in the ESI.†
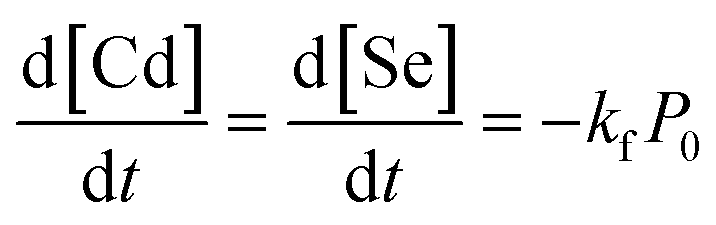
In a given experiment, a well-mixed solution of the cadmium and selenium precursors enters the capillary and its temperature rises almost instantaneously. The precursors decompose to form CdSe monomers according to
 | (1) |
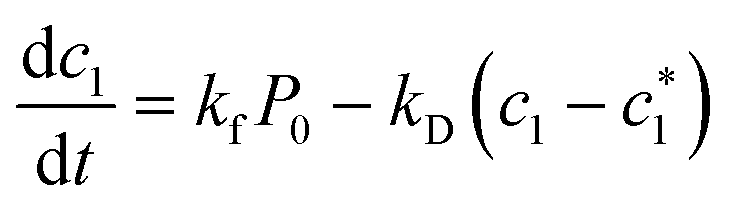
Before a monomer can attach to another monomer or cluster, each species must diffuse through a surfactant layer as described by
 | (2) |
 | (3) |
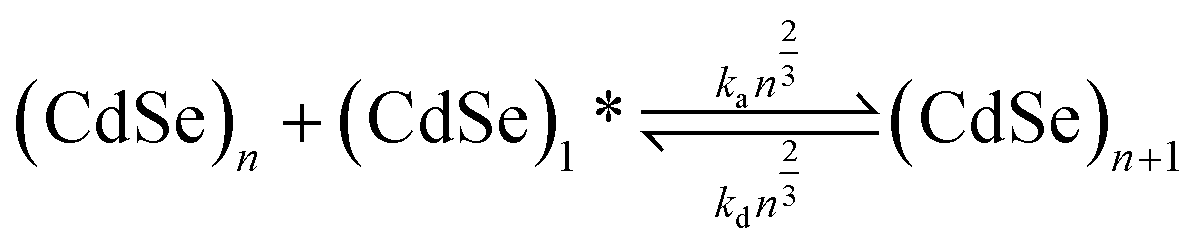
 arises as a consequence of the assumption that both association and dissociation of monomers are proportional to the number of reaction sites on the surface and thus proportional to the surface area. Here, we assume that the monomers that have dissociated are immediately available to other clusters without having to diffuse out of the surfactant shell. This assumption is valid since at high monomer concentration—where diffusion is limiting—dissociation is negligible, whereas at low monomer concentrations the diffusion timescale is much larger than that of both association and dissociation. Moreover, diffusion out of the surfactant shell is likely to be much faster than diffusion towards the cluster due to convective flow.
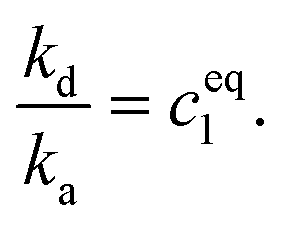
We assume that the dissociation rate kd is independent of the cluster size. Considering a cluster in equilibrium with its constituent monomers, it is clear that the ratio of kd to ka must be equal to the equilibrium monomer concentration ceq1, i.e.
 | (4) |
We estimate ceq1 to be 4 × 10⁻¹¹ mol L−1 which effectively means that the effects of dissociation are neglected.48 At the early times treated here we found this to be a very good assumption.
Limiting the maximum considered cluster size to n = N and following the above derivation, we can formulate a set of N + 2 rate equations describing the reaction system, i.e.
 | (5) |
 | (6) |
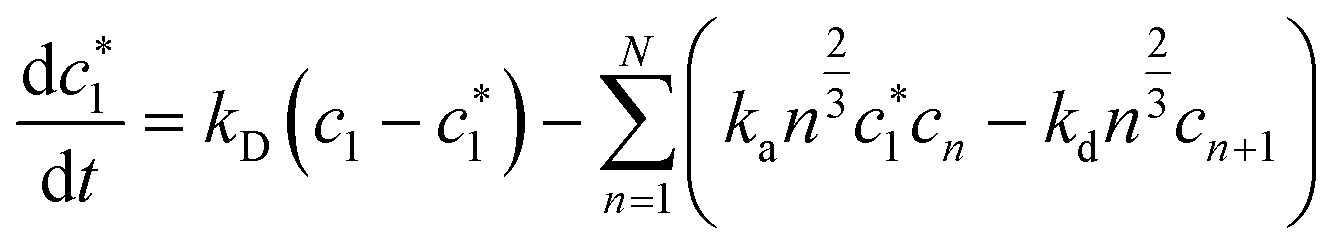 | (7) |
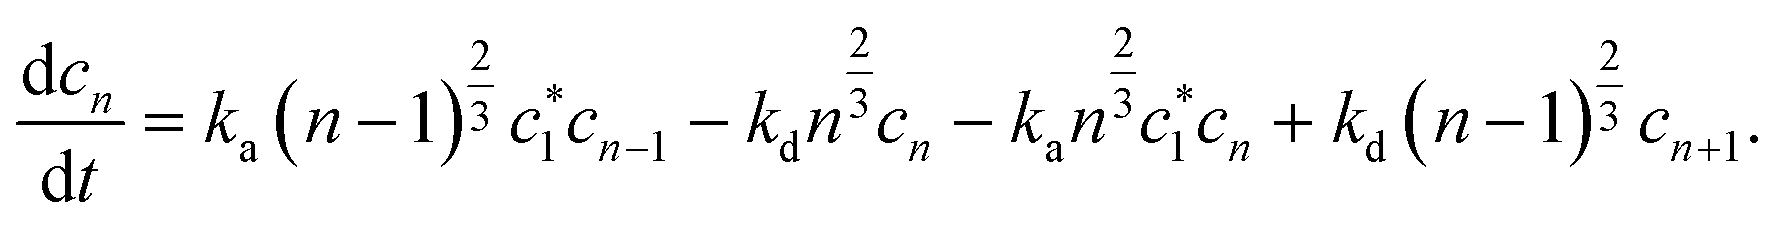 | (8) |
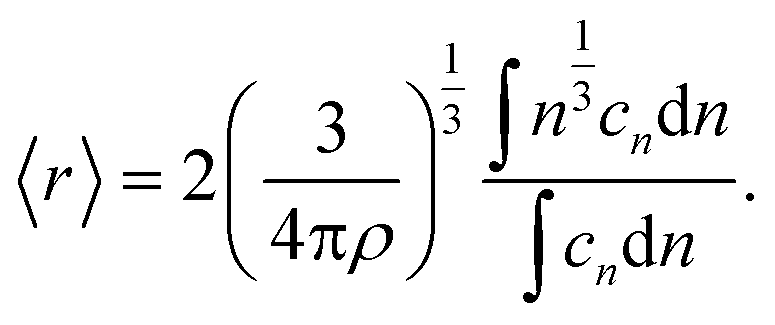 | (9) |
Rempel presents a detailed evaluation of the model (excluding the diffusional component) in a non-dimensional form. Fig. 5 demonstrates the effects of the model parameters kf, ka, kD and P0 on the mean size and size distribution of the particles using realistic values and the dimensional form of the equations.
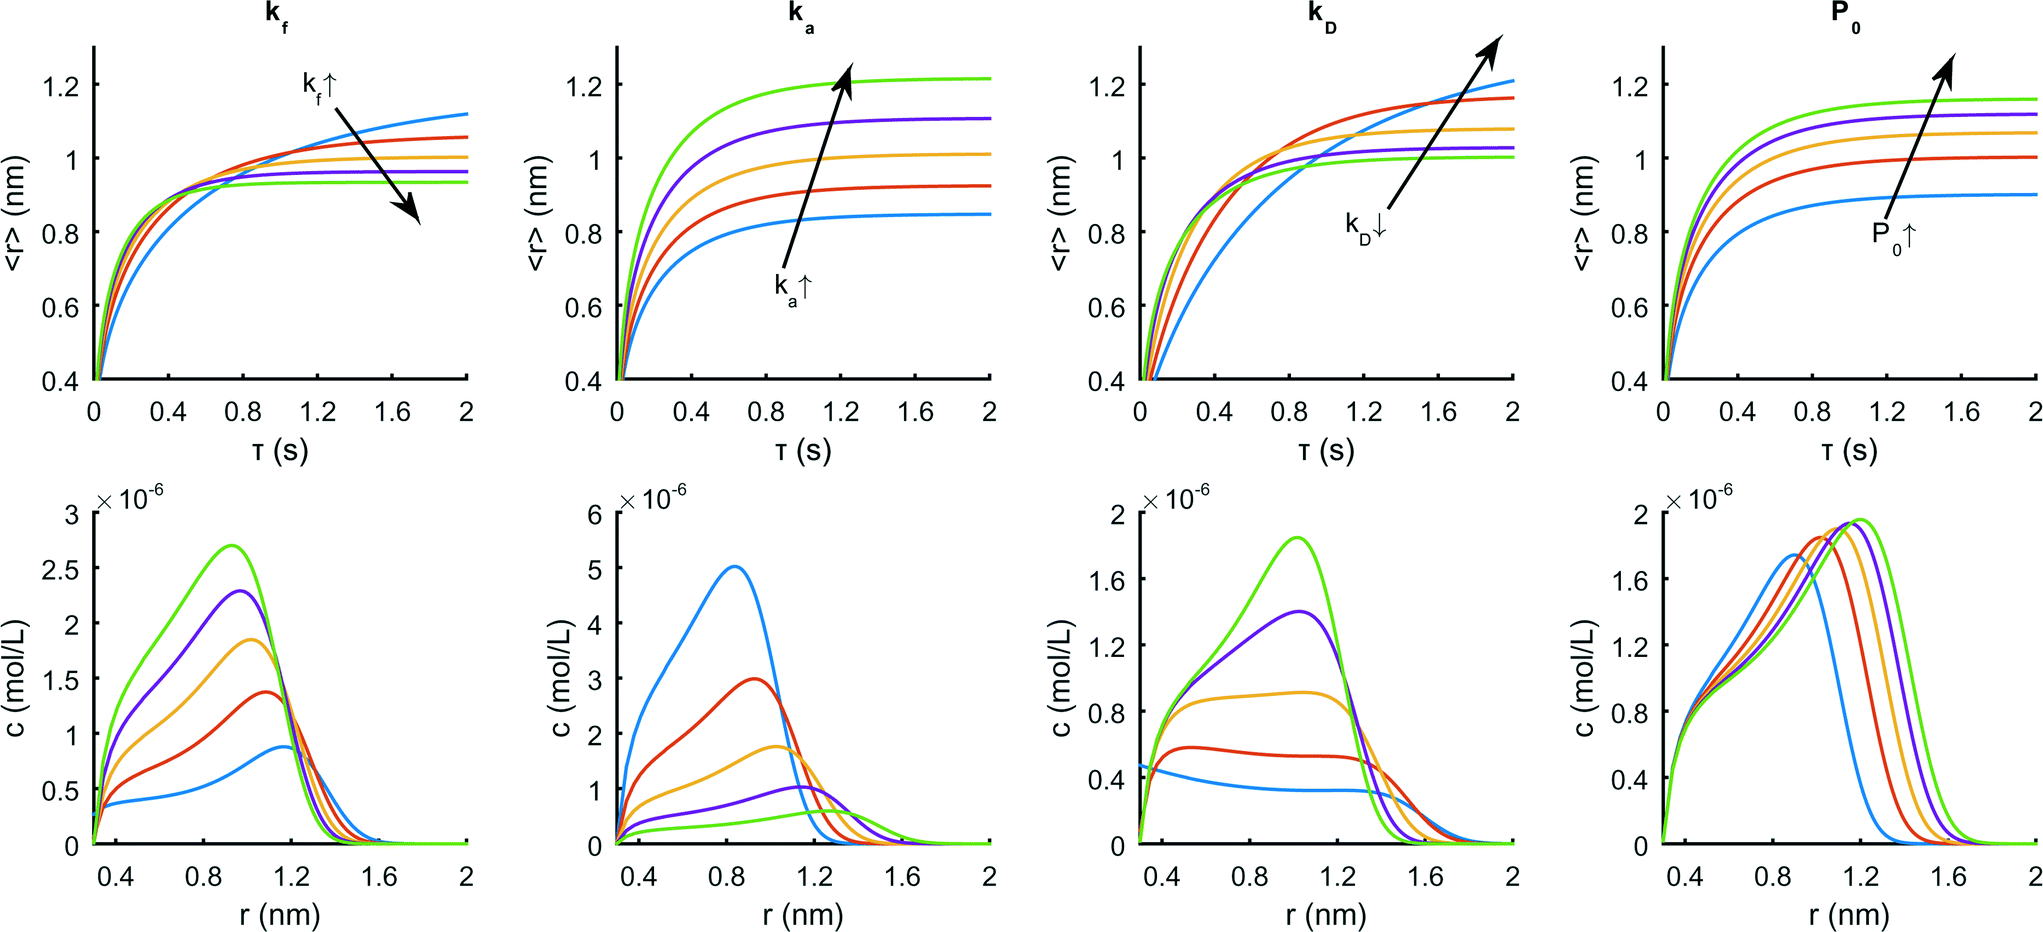 | ||
| Fig. 5 Effect of the model parameters on the mean radius as a function of time (upper row) and on the size distribution at 2 s (lower row) when changing kf from 1 to 5 s−1, ka from 106 to 107 L mol−1 s−1, kD from 100 to 1 s−1or P0 from 10 to 50 mmol L−1. The values for ka and kD are logarithmically spaced. | ||
As can be seen, an increase in kf (from 1 to 5 s−1) leads to a more rapid increase in 〈r〉 at early times, but also to a shorter time to saturation. This implies a larger total concentration of particles with smaller mean sizes. For large values of ka, quantum dot growth is rapid at early times, with the monomer concentration dropping quickly to terminate nucleation in favor of a larger 〈r〉. The effect of kD on the evolution of the size distribution is somewhat similar to that of kf but is more pronounced at early times, slowing down growth whilst having the same effect on the final 〈r〉. Finally, an increase in the precursor concentration (from 10 to 50 mmol L−1) produces larger particles without significantly changing the shape of the resulting size distribution.
To relate the model data with the experimental measurements, we extract the mean size of the synthesized particles from the first absorbance peak position using the calibration curve reported by Jasieniak et al.53 and iteratively fit the model parameters kf and ka to the experimental data using a non-linear least squares algorithm whilst keeping kD constant at a value of 100 s−1 (corresponding to a reaction limited regime). The iterative fitting is essential in preventing the algorithm from optimizing local minima. In addition, we systematically investigate the temperature and concentration dependence of the model parameters by taking measurements in 200 ms intervals between τ = 0.2 and 2 s, at three initial precursor concentrations (10, 20 and 30 mmol L−1) and three temperatures (T1 = 220, 240 and 260 °C) each. Since quantum dot syntheses are highly susceptible to small variations in precursor preparation, we conduct all the experiments in one sitting and access different concentrations by diluting aliquots from the same stock solution. Fig. 6 displays the raw absorbance spectra for the 20 mmol L−1 experiment and model fits. For all temperatures and concentrations, we observe excellent agreement between the model and experiment. (ESI† Fig. S1). The effective rates of conversion are independent of the concentration, with conversion following a first order rate law. Growth rates, however, are significantly dependent on the concentration and this dependence marginally increases with temperature. The treatment of particle growth in the model derivation will therefore miss important phenomena that are concentration dependent. Possible issues in this regard are the neglect of particle–particle interactions, as well as an oversimplified treatment of surface chemistry on the growing particles.
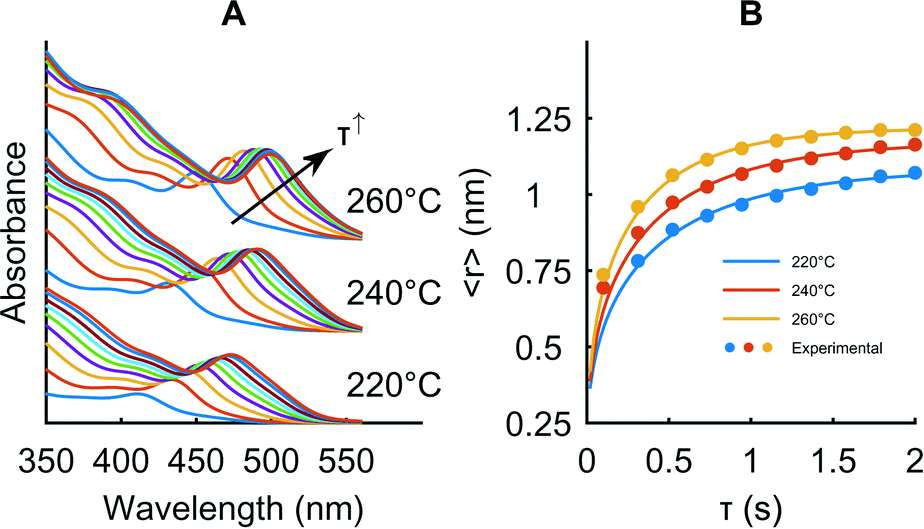 | ||
| Fig. 6 Example of fitting the model parameters ka and kf to the experimental data for a Cd precursor concentration of 20 mmol L−1. A: Absorbance spectra obtained online after the first stage. B: Mean size extracted from the absorbance spectra at ten different reaction times and three temperatures and model fits to the data. | ||
We are able to extract the activation energies and pre-exponential factors that allow prediction of rate constants at different temperatures by fitting ln(kf) and ln(ka) against 1/T (ESI† Fig. S2). The activation energy for kf is 20 kJ mol−1 for all concentrations studied, whereas the activation energies for ka are 53, 55 and 67 kJ mol−1 at initial precursor concentrations of 10, 20 and 30 mmol L−1, respectively. We validate these activation energies by comparing the size predicted by the model with measurements taken between 200 and 290 °C, at a reaction time of 300 ms and at an initial concentration of 10 mmol L−1. Fig. 7 indicates that the predicted radius is approximately 0.05 nm smaller than that observed in the experiment for all temperatures. This small deviation could either be due to minute differences in chemistry or an overestimation of the activation energies by the fitting process. The yield data in Fig. 7C shows that we access a wide range of reaction stages (depending on the temperature), ranging from very early (200 °C, 10% yield) to advanced (290 °C, 90% yield), even at a very short time of 300 ms. Despite the simplifications made in the derivation, the model is highly successful in predicting size over a wide range of reaction stages and with high precision. The particle concentration increases with temperature until it saturates at around 100 μmol L−1 (Fig. 7D). At this point, the model is unable to generate accurate estimations of yield and particle concentration, since in the rate constant determination we only focus on the mean particle size. We believe that inclusion of surface energy terms and dissociation processes could further increase the value of this model. However, with the fitting procedure described in this work, estimation of these terms is not possible, since a change in one of the parameters directly influences the rate constants and therefore makes it impossible to distinguish the component effects. An estimation of the absolute values for precursor conversion (e.g. via NMR experiments) or a precise estimation of the surface energy via first principles calculations has the potential to elucidate the appropriate model parameters for our reaction system.
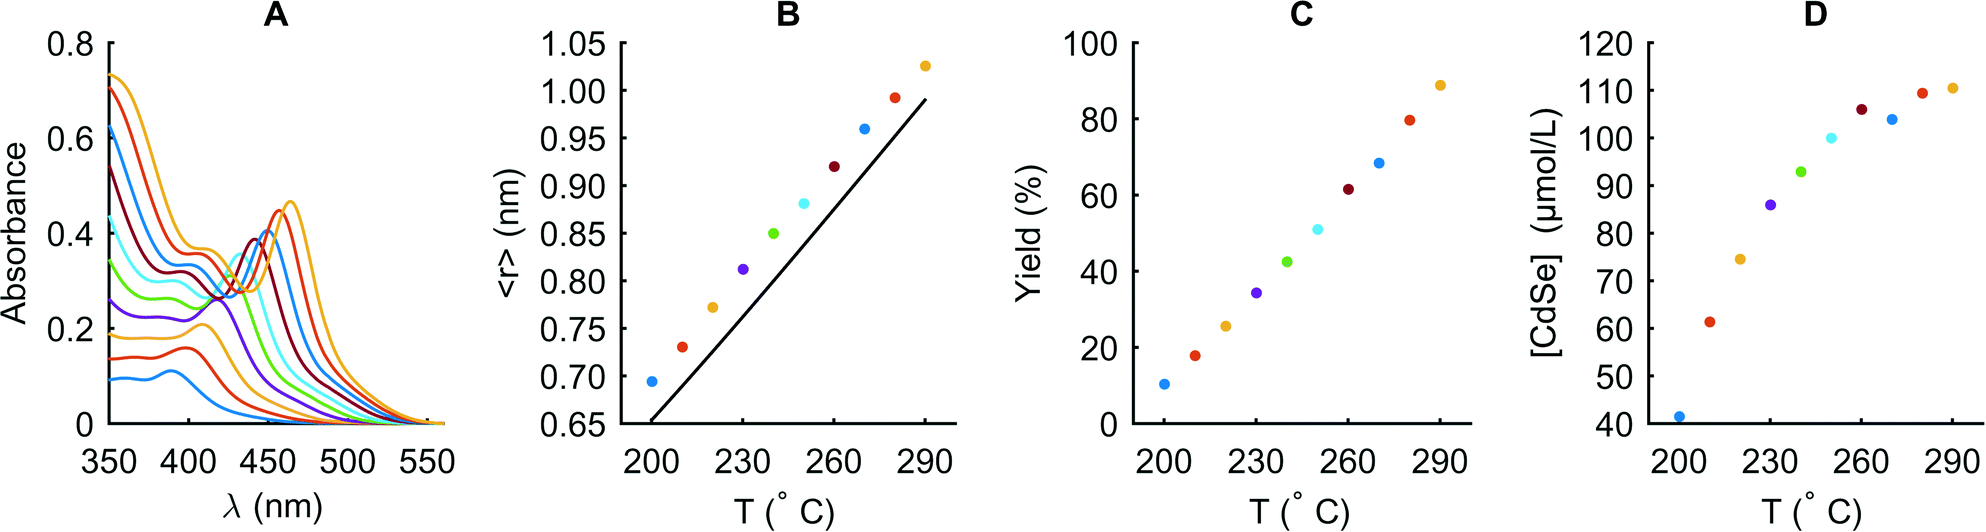 | ||
| Fig. 7 Evaluation of the temperature dependence extracted via the model at a CdOA concentration of 20 mmol L−1. Absorbance spectra obtained directly after the first stage at temperatures between 200 and 290 °C at 300 ms (A). Experimental (dots) and predicted (solid line) mean radius of the particles (B). Corresponding chemical yield (C) and CdSe particle concentration (D) extracted according to the method of Jaseniak et al.53 | ||
With that said, the current model is of significant theoretical and experimental value through its ability to quantitatively estimate rate constants. It is well recognized that surfactants and additives play an important role in nanocrystal synthesis and within the model framework we can quantitatively analyze how the additive (A0) and surfactant concentration (S0) influence both nucleation and growth. To this end, we finally investigate the influence of the concentration of the common additive diphenylphosphine (DPP) and of the total surfactant concentration (OA + TOP) on the rate constants (Fig. 8).
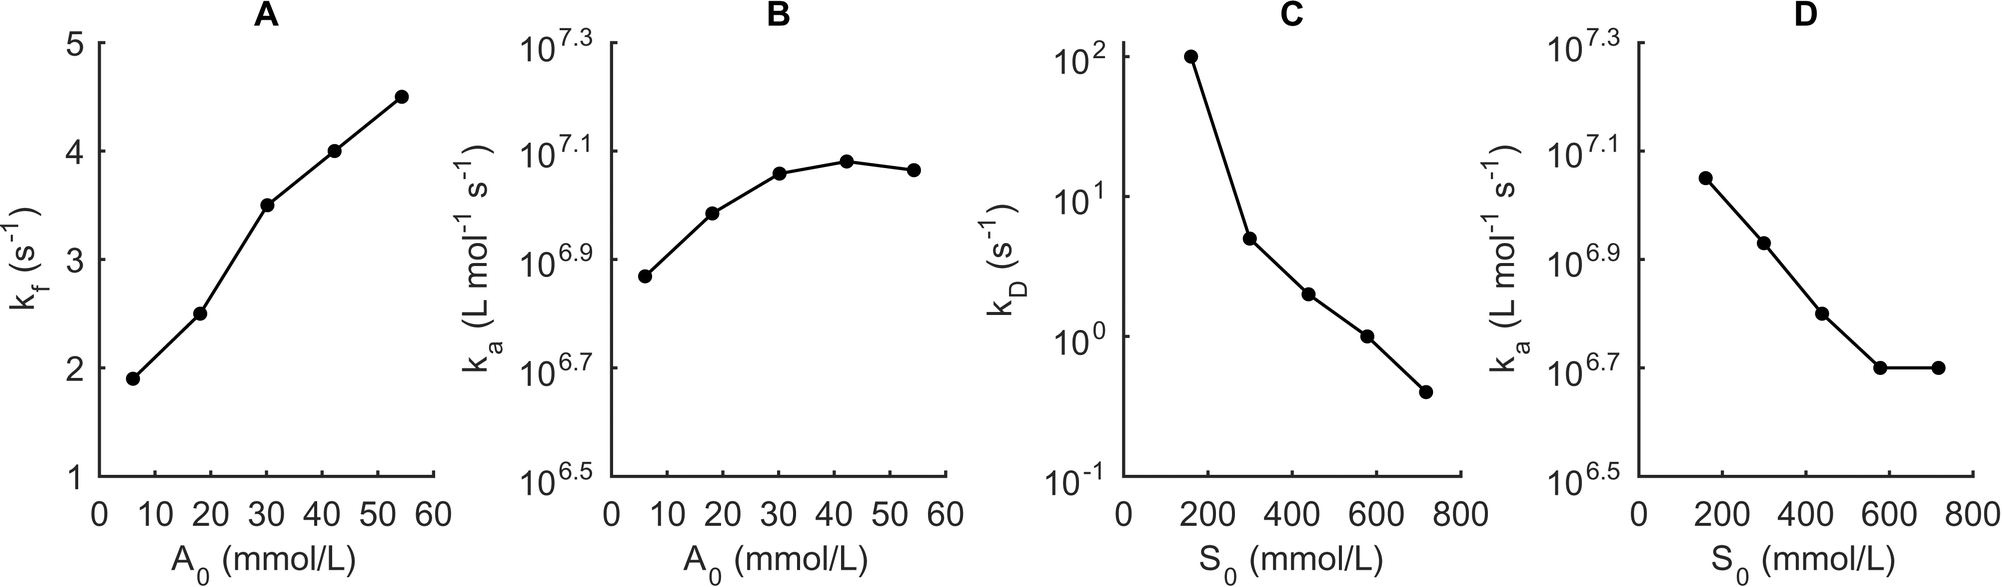 | ||
| Fig. 8 Experimental influence of the additive concentration, A0 and the total surfactant concentration, S0 on the model rate constants. The CdOA concentration is fixed at 10 mmol L−1. The effect of the DPP concentration A0 on kf (A) and ka (B). Effect of the total surfactant concentration S0 on kD (C) and ka (D). | ||
We quantify these effects by applying the same method as demonstrated in Fig. 6. Specifically we fix the temperature at 260 °C and for each value of A0 and S0 the reactor collects the absorbance spectra at different reaction times between 0.2 and 1 s for A0 and between 0.2 and 2 s for S0. By fitting the model to the size vs. reaction time data, we are then able to estimate the rate constants (see ESI† Fig. S3).
Studies have shown that secondary phosphines such as DPP are the reactive ligands in the conversion of a selenide precursor to a monomer.8,54 Accordingly, we expect DPP to have a large effect on kf and only a minor influence on the growth rate ka. Indeed, our results corroborate the experimental findings, since we observe a large linear increase of kf when we vary the DPP concentration from 6 to 54 mmol L−1 while kD remains constant at 100 s−1. However, we also observe a small (factor of 1.5) increase in ka that cannot be rationalized using chemical arguments. We attribute this increase to the limited accuracy of rate constant determination as well as the simplified representation of the actual reaction mechanisms. An increase in the total surfactant concentration (trioctylphosphine plus oleic acid) does not affect the precursor conversion rate but leads to a large decrease in the diffusion frequency due to a larger surfactant layer around the quantum dots. The growth rate also decreases rapidly with concentration, although this variation is not as dramatic as observed for kD. We attribute this behavior to a higher surface coverage on the particles and fewer reaction sites for growth. These results demonstrate that use of the current kinetic model allows the extraction of valuable and quantitative information on how different reagents influence quantum dot nucleation and growth.
3 Conclusion
We have presented a two-stage microfluidic reactor for the high temperature synthesis of quantum dots. The reactor enables detailed and efficient experimental investigations into the reaction processes during the synthesis through online absorbance and fluorescence measurements combined with precise control of the residence times and temperatures. The reactor gives highly reproducible results by automatically dosing reagents and controlling the flow rates, thereby eliminating user error. We have additionally adapted a kinetic model of nanocrystal synthesis, extended it by accounting for diffusional processes and solved the equations in dimensional form. Using the described reactor, we then experimentally evaluated the model and confirmed the excellent agreement with experimental findings, especially at short reaction times. We then implemented the model to quantify the influence of surfactant and DPP concentrations and found that the surfactant concentration has a profound influence on the diffusion rate constant, whereas the DPP concentration affects almost exclusively the conversion rate constant. This corroborates the current view in the literature that surfactants slow down the growth of nanocrystals whereas DPP accelerates the conversion of a precursor to monomers. Through these experiments, we have demonstrated how microfluidic reactors can be used to advance the theoretical understanding of nanocrystal synthesis. It should be noted, that in the current studies we have not included an analysis of how chemical yield, size distribution and particle concentration predicted by the model compare with experiment. To obtain accurate results for such values and to improve the model further, it will be necessary to include more complex terms that account for the surface energy, surface coverage, as well as dissociation and ripening effects.4 Experimental
Chemicals
Selenium (99.5+%), 1-octadecene (ODE, 90%) and oleic acid (OA, 90%) were purchased from Sigma-Aldrich. Cadmium oxide (99.999%) and trioctylphosphine (TOP, 97%) were purchased from abcr. GALDEN HT270 perfluorinated heat transfer fluid was purchased from Blaser Swisslube.Precursor preparation
We describe a typical procedure to prepare precursor solutions of CdOA and SeTOP at concentrations of 10 mmol L−1 and 20 mmol L−1, respectively. A 20 mL flame-dried Schlenk flask is charged with 25.7 mg (0.2 mmol, 1 eq.) of CdO, 0.5 mL (1.6 mmol, 8 eq.) and 9.5 mL of ODE. The slurry is degassed at 160 °C for 30 min and stirred vigorously under argon at 220 °C for 1 h. The resulting colorless solution is cooled rapidly to room temperature using a water bath to avoid precipitation. A second 20 mL flame-dried Schlenk flask is charged with 31.6 mg (0.4 mmol, 2 eq.) of selenium. 9.2 mL of dry ODE (dried over 0.4 Å molecular sieves) is added and the suspension is degassed at room temperature for 15 min. 0.72 mL (1.6 mmol, 8 eq.) of TOP and 70 μL (0.4 mmol, 2 eq.) of DPP are added to the heterogeneous solution. Stirring the mixture under an argon atmosphere for another 15 min yields a colorless solution. The two precursor solutions are mixed and charged in a glass syringe while air contact is avoided.Experimental setup
Precursors and solvents are loaded in glass syringes (Gastight 1000, Hamilton, Switzerland) and actuated using a Nemesys syringe pump (Cetoni, Germany). The syringes are connected to a stainless steel capillary (01/16′′ OD, various ID, IDEX Health & Science, USA) using a FEP capillary (01/16′′ OD, 700 μm ID, IDEX Health & Science, USA) and a T-junction (PEEK, 0.5 mm thru-hole, IDEX Health & Science, USA). The capillary can be maintained at temperatures between room temperature and 400 °C (T1) using a ceramic heater (Ultramic, Watlow, USA). After this first heating stage, the reaction mixture flows through a high-purity perfluoralkoxy (PFA) capillary (1/16′′ OD, 500 μm ID, IDEX Health & Science, USA) and passes an in-line absorbance spectrometer that consists of a fiber-coupled deuterium lamp (DH-2000, Ocean Optics, USA) and a fiber-coupled spectrometer (QE 65000, Ocean Optics, USA). After unification with a second reactant stream carrying additional precursor in another T-junction, a perfluorinated heat transfer fluid (Galden HT 270, Solvay, Belgium) segregates the solution into a stream of isolated droplets (500–1500 nL) using a T-junction. The formed droplets then enter a polytetrafluoroethylene (PTFE) capillary ((1/16′′ OD, 500 μm ID, AdTech, UK), which meanders for 80 cm through a second heating zone where a second ceramic heater controls the temperature between ambient temperature and 250 °C (T2). The droplets leave the reactor and are transferred directly to a high-purity PFA (1/16′′ OD, 500 μm ID) capillary. Fluorescence spectra are obtained in orthogonal configuration with a 365 nm mounted LED (190 mW, Thorlabs, USA) as an excitation source and a fiber coupled spectrometer (USB 2000, Ocean Optics, USA). Using such a setup, we are able to achieve a time resolution of approximately ten milliseconds in the first stage and one second in the second stage (τ1 and τ2, respectively). An in-house developed PID-controller implemented in LabView automatically adjusts the heating power to maintain the reaction temperatures constant within ±0.5 K at the set point. The operation of the reactor is entirely controlled using an in-house LabView script that accepts a set of experimental parameters.References
- P. D. Howes, R. Chandrawati and M. M. Stevens, Colloidal Nanoparticles as Advanced Biological Sensors, Science, 2014, 346, 53 CrossRef CAS PubMed.
- Y. Shirasaki, M. G. B. Geoffrey, J. Supran and V. Bulović, Emergence of Colloidal Quantum-Dot Light-Emitting Technologies, Nat. Photonics, 2013, 7, 13–23 CrossRef CAS.
- C. J. Stolle, T. B. Harvey and B. A. Korgel, Nanocrystal Photovoltaics: a Review of Recent Progress, Curr. Opin. Chem. Eng., 2013, 2, 160–167 CrossRef.
- D. V. Talapin, J.-S. Lee, M. V. Kovalenko and E. V. Shevchenko, Prospects of Colloidal Nanocrystals for Electronic and Optoelectronic Applications, Chem. Rev., 2010, 110, 389–458 CrossRef CAS PubMed.
- J. Park, J. Joo, S. G. Kwon, Y. Jang and T. Hyeon, Synthesis of Monodisperse Spherical Nanocrystals, Angew. Chem., Int. Ed., 2007, 46, 4630–4660 CrossRef CAS PubMed.
- T. W. Phillips, I. G. Lignos, R. M. Maceiczyk, A. J. deMello and J. C. deMello, Nanocrystal synthesis in microfluidic reactors: where next?, Lab Chip, 2014, 14, 3172–3180 RSC.
- X. Peng, An Essay on Synthetic Chemistry of Colloidal Nanocrystals, Nano Res., 2009, 2, 425–447 CrossRef CAS.
- C. M. Evans, M. E. Evans and T. D. Krauss, Mysteries of TOPSe Revealed: Insights into Quantum Dot Nucleation, J. Am. Chem. Soc., 2010, 132, 10973–10975 CrossRef CAS PubMed.
- L. Xie, D. K. Harris, M. G. Bawendi and K. F. Jensen, Effect of Trace Water on the Growth of Indium Phosphide Quantum Dots, Chem. Mater., 2015, 27, 5058–5063 CrossRef CAS.
- R. García-Rodríguez and H. Liu, Mechanistic Insights into the Role of Alkylamine in the Synthesis of CdSe Nanocrystals, J. Am. Chem. Soc., 2014, 136, 1968–1975 CrossRef PubMed.
- D. Franke, D. K. Harris, L. Xie, K. F. Jensen and M. G. Bawendi, The Unexpected Influence of Precursor Conversion Rate in the Synthesis of IIIV Quantum Dots, Angew. Chem., Int. Ed., 2015, 54, 14299–14303 CrossRef CAS PubMed.
- T. W. Phillips, I. G. Lignos, R. M. Maceiczyk, A. J. deMello and J. C. deMello, Nanocrystal synthesis in microfluidic reactors: where next?, Lab Chip, 2014, 14, 3172–3180 RSC.
- E. M. Chan, R. A. Mathies and A. P. Alivisatos, Size-Controlled Growth of CdSe Nanocrystals in Microfluidic Reactors, Nano Lett., 2003, 3, 199–201 CrossRef CAS.
- A. M. Nightingale, J. H. Bannock, S. H. Krishnadasan, F. T. F. O'Mahony, S. A. Haque, J. Sloan, C. Drury, R. McIntyre and J. C. deMello, Large-Scale Synthesis of Nanocrystals in a Multichannel Droplet Reactor, J. Mater. Chem. A, 2013, 1, 4067–4076 CAS.
- I. Lignos, S. Stavrakis, G. Nedelcu, L. Protesescu, A. J. deMello and M. V. Kovalenko, Synthesis of Cesium Lead Halide Perovskite Nanocrystals in a Droplet-Based Microfluidic Platform: Fast Parametric Space Mapping, Nano Lett., 2016, 16, 1869–1877 CrossRef CAS PubMed.
- J. B. Edel, R. Fortt, J. C. deMello and A. J. deMello, Microfluidic Routes to the Controlled Production of Nanoparticles, Chem. Commun., 2002, 1136–1137 RSC.
- A. M. Nightingale and J. C. de Mello, Controlled Synthesis of III–V Quantum Dots in Microfluidic Reactors, ChemPhysChem, 2009, 10, 2612–2614 CrossRef CAS PubMed.
- I. Lignos, L. Protesescu, S. Stavrakis, L. Piveteau, M. J. Speirs, M. A. Loi, M. V. Kovalenko and A. J. deMello, Facile Droplet-based Microfluidic Synthesis of Monodisperse IVVI Semiconductor Nanocrystals with Coupled In-Line NIR Fluorescence Detection, Chem. Mater., 2014, 26, 2975–2982 CrossRef CAS.
- S. He, T. Kohira, M. Uehara, T. Kitamura, H. Nakamura, M. Miyazaki and H. Maeda, Effects of Interior Wall on Continuous Fabrication of Silver Nanoparticles in Microcapillary Reactor, Chem. Lett., 2005, 34, 748–749 CrossRef CAS.
- D. Shalom, R. C. Wootton, R. F. Winkle, B. F. Cottam, R. Vilar, A. J. deMello and C. P. Wilde, Synthesis of Thiol Functionalized Gold Nanoparticles Using a Continuous Flow Microfluidic Reactor, Mater. Lett., 2007, 61, 1146–1150 CrossRef CAS.
- R. M. Maceiczyk, I. G. Lignos and A. J. deMello, Online Detection and Automation Methods in Microfluidic Nanomaterial Synthesis, Curr. Opin. Chem. Eng., 2015, 8, 29–35 CrossRef.
- Y. Orimoto, K. Watanabe, K. Yamashita, M. Uehara, H. Nakamura, T. Furuya and H. Maeda, Application of Artificial Neural Networks to Rapid Data Analysis in Combinatorial Nanoparticle Syntheses, J. Phys. Chem. C, 2012, 116, 17885–17896 CAS.
- A. Toyota, H. Nakamura, H. Ozono, K. Yamashita, M. Uehara and H. Maeda, Combinatorial Synthesis of CdSe Nanoparticles Using Microreactors, J. Phys. Chem. C, 2010, 114, 7527–7534 CAS.
- R. Maceiczyk and A. deMello, Fast and Reliable Metamodeling of Complex Reaction Spaces Using Universal Kriging, J. Phys. Chem. C, 2014, 118, 20026–20033 CAS.
- S. Krishnadasan, R. Brown, A. deMello and J. deMello, Intelligent Routes to the Controlled Synthesis of Nanoparticles, Lab Chip, 2007, 7, 1434–1441 RSC.
- I. Lignos, S. Stavrakis, A. Kilaj and A. J. deMello, Millisecond-Timescale Monitoring of PbS Nanoparticle Nucleation and Growth Using Droplet-Based Microfluidics, Small, 2015, 11, 4009–4017 CrossRef CAS PubMed.
- K. Yu, J. Ouyang and D. M. Leek, In-Situ Observation of Nucleation and Growth of PbSe Magic-Sized Nanoclusters and Regular Nanocrystals, Small, 2011, 7, 2250–2262 CrossRef CAS PubMed.
- J. Polte, R. Erler, A. F. Thnemann, S. Sokolov, T. T. Ahner, K. Rademann, F. Emmerling and R. Kraehnert, Nucleation and Growth of Gold Nanoparticles Studied via in situ Small Angle X-ray Scattering at Millisecond Time Resolution, ACS Nano, 2010, 4, 1076–1082 CrossRef CAS PubMed.
- M. Uehara, Z. H. Sun, H. Oyanagi, K. Yamashita, A. Fukano, H. Nakamura and H. Maeda, In Situ Extended X-Ray Absorption Fine Structure Study of Initial Processes in CdSe Nanocrystals Formation Using a Microreactor, Appl. Phys. Lett., 2009, 94, 063104 CrossRef.
- K. S. Krishna, C. V. Navin, S. Biswas, V. Singh, K. Ham, G. L. Bovenkamp, C. S. Theegala, J. T. Miller, J. J. Spivey and C. S. S. R. Kumar, Millifluidics for Time-resolved Mapping of the Growth of Gold Nanostructures, J. Am. Chem. Soc., 2013, 135, 5450–5456 CrossRef PubMed.
- E. M. Chan, M. A. Marcus, S. Fakra, M. ElNaggar, R. A. Mathies and A. P. Alivisatos, Millisecond Kinetics of Nanocrystal Cation Exchange Using Microfluidic X-ray Absorption Spectroscopy, J. Phys. Chem. A, 2007, 111, 12210–12215 CrossRef CAS PubMed.
- Z. H. Sun, H. Oyanagi, M. Uehara, H. Nakamura, K. Yamashita, A. Fukano and H. Maeda, Study on Initial Kinetics of CdSe Nanocrystals by a Combination of in Situ X-ray Absorption Fine Structure and Microfluidic Reactor, J. Phys. Chem. C, 2009, 113, 18608–18613 CAS.
- S. G. Kwon and T. Hyeon, Formation Mechanisms of Uniform Nanocrystals via Hot-Injection and Heat-Up Methods, Small, 2011, 7, 2685–2702 CrossRef CAS PubMed.
- N. T. K. Thanh, N. Maclean and S. Mahiddine, Mechanisms of Nucleation and Growth of Nanoparticles in Solution, Chem. Rev., 2014, 115, 7610–7630 CrossRef PubMed.
- C. R. Bullen and P. Mulvaney, Nucleation and Growth Kinetics of CdSe Nanocrystals in Octadecene, Nano Lett., 2004, 4, 2303–2307 CrossRef CAS.
- R. Xie, Z. Li and X. Peng, Nucleation Kinetics vs Chemical Kinetics in the Initial Formation of Semiconductor Nanocrystals, J. Am. Chem. Soc., 2009, 131, 15457–15466 CrossRef CAS PubMed.
- D. Erdemier, A. Y. Le and A. S. Myerson, Nucleation of Crystals from Solution: Classical and Two-Step Models, Acc. Chem. Res., 2009, 42, 621–629 CrossRef PubMed.
- J. Mullin, Crystallization (Fourth Edition), Butterworth–Heinemann, 2001 Search PubMed.
- D. V. Talapin, A. L. Rogach, M. Haase and H. Weller, Evolution of an Ensemble of Nanoparticles in a Colloidal Solution: Theoretical Study, J. Phys. Chem. B, 2001, 105, 12278–12285 CrossRef CAS.
- N. Varghese, K. Biswas and C. N. Rao, Investigations of the Growth Kinetics of Capped CdSe and CdS Nanocrystals by a Combined Use of Small Angle X-ray Scattering and Other Techniques, Chem. – Asian J., 2008, 3, 1435–1442 CrossRef CAS PubMed.
- X. Peng, J. Wickham and A. P. Alivisatos, Kinetics of II-VI and III-V Colloidal Semiconductor Nanocrystal Growth: “Focusing” of Size Distributions, J. Am. Chem. Soc., 1998, 120, 5343–5344 CrossRef CAS.
- N. V. Mantzaris, Liquid-Phase Synthesis of Nanoparticles: Particle Size Distribution Dynamics and Control, Chem. Eng. Sci., 2005, 60, 4749–4770 CrossRef CAS.
- D. T. Robb and V. Privman, Model of Nanocrystal Formation in Solution by Burst Nucleation and Diffusional Growth, Langmuir, 2008, 24, 26–35 CrossRef CAS PubMed.
- J. Y. Rempel, M. G. Bawendi and K. F. Jensen, Insights into the Kinetics of Semiconductor Nanocrystal Nucleation and Growth, J. Am. Chem. Soc., 2009, 131, 4479–4489 CrossRef CAS PubMed.
- D. Hess, A. Rane, A. J. deMello and S. Stavrakis, High-Throughput, Quantitative Enzyme Kinetic Analysis in Microdroplets Using Stroboscopic Epifluorescence Imaging, Anal. Chem., 2015, 87, 4965–4972 CrossRef CAS PubMed.
- H. Song and R. F. Ismagilov, Millisecond Kinetics on a Microfluidic Chip Using Nanoliters of Reagents, J. Am. Chem. Soc., 2003, 125, 14613–14619 CrossRef CAS PubMed.
- C. B. Murray, D. J. Noms and M. G. Bawendi, Synthesis and Characterization of Nearly Monodisperse CdE (E = S, Se, Te) Semiconductor Nanocrystallites, J. Am. Chem. Soc., 1993, 115, 8706–8715 CrossRef CAS.
- S. Abe, R. K. Capek, B. D. Geyter and Z. Hens, Tuning the Postfocused Size of Colloidal Nanocrystals by the Reaction Rate: From Theory to Application, ACS Nano, 2012, 6, 42–53 CrossRef CAS PubMed.
- D. Kashchiev, Nucleation, Butterworth–Heinemann, 2000 Search PubMed.
- J. S. Chang and G. Cooper, A Practical Difference Scheme for Fokker-Planck Equations, J. Comput. Phys., 1970, 6, 1–16 CrossRef.
- E. M. Epperlein, Implicit and Conservative Difference Scheme for the Fokker-Planck Equation, J. Comput. Phys., 1994, 112, 291–297 CrossRef CAS.
- T. Sinno and R. A. Brown, Modeling Microdefect Formation in Czochralski Silicon, J. Electrochem. Soc., 1999, 146, 2300–2312 CrossRef CAS.
- J. Jasieniak, L. Smith, J. van Embden and P. Mulvaney, Re–Examination of the Size–Dependent Absorption Properties of CdSe Quantum Dots, J. Phys. Chem. C, 2009, 113, 19468–19474 CAS.
- K. Yu, X. Liu, Q. Zeng, D. M. Leek, J. Ouyang, K. M. Whitmore, J. A. Ripmeester, Y. Tao and M. Yang, Effect of Tertiary and Secondary Phosphines on Low-Temperature Formation of Quantum Dots, Angew. Chem., Int. Ed., 2013, 52, 4823–4828 CrossRef CAS PubMed.
Footnote |
| † Electronic supplementary information (ESI) available. See DOI: 10.1039/c6re00073h |
| This journal is © The Royal Society of Chemistry 2016 |