 Open Access Article
Creative Commons Attribution 3.0 Unported Licence
First-order reversal curve analysis of magnetoactive elastomers†
Julia M.
Linke
 *,
Dmitry Yu.
Borin
* and
Stefan
Odenbach
Chair of Magnetofluiddynamics, Measuring and Automation Technology, TU Dresden, 01062 Dresden, Germany. E-mail: julia.linke@tu-dresden.de; dmitry.borin@tu-dresden.de
First published on 14th October 2016
Abstract
The first magnetization loop and the first stress–strain cycle of magnetoactive elastomers (MAEs) in a magnetic field differ considerably from the following loops and cycles, possibly due to the internal restructuring of the magnetic filler particles and the matrix polymer chains. In the present study, the irreversible magnetization processes during the first magnetization of MAEs with different filler compositions and tensile moduli of the matrix are studied by first-order reversal curve (FORC) measurements. For MAEs with mixed magnetic NdFeB/Fe fillers the FORC distributions and magnetization distributions of the first major loop reveal a complex irreversible magnetization behavior at interaction fields Hu < −50 kA m−1 due to the magnetostatic coupling between the magnetically hard NdFeB and the magnetically soft Fe particles. This coupling is enhanced either if the interparticle distance is reduced by particle motion and restructuring or by an increase in the particle densities. If the stiffness of the matrix is increased, the structuring and thus the interparticle interactions are suppressed and the magnetization reversal is dominated by domain processes in the NdFeB particles at high coercive fields of Hc > 600 kA m−1.
1 Introduction
Magnetoactive elastomers (MAE) combine the properties of non-magnetic elastic polymer matrixes with those of solid magnetic fillers, offering a number of fascinating magnetically controllable effects such as magnetostriction, magnetodeformation, magnetorheological and shape memory effects.1 In both isotropic and anisotropic MAE, the structure and mobility of the magnetic filler within the elastic matrix influences the macroscopic behavior of the MAE.2,3 The magnetic filler usually consists of magnetically soft particles such as magnetite or carbonyl iron, or magnetically hard particles such as CoFe2O4 or NdFeB. Combinations of magnetically soft and hard fillers have rarely been studied, although MAE with these mixed magnetic fillers are interesting candidates for technical applications since they allow active and passive control of the mechanical properties4,5 – the mixed magnetic filler can either be structured actively by applying an external magnetic field, or passively by inducing a specific inner remanent magnetization of the magnetically hard phase which keeps the soft phase partially or fully magnetized and structured when the external magnetic field is removed.A standard method for the magnetic characterization of magnetic materials is the measurement of major magnetization loops. The parameters derived from these measurements present bulk averages of the magnetic properties of all particles in a sample. To distinguish the magnetic response of different components of fine particle samples a more sophisticated approach is necessary, for example isothermal remanent magnetization unmixing or first-order reversal curve (FORC) measurements. The FORC method has the advantage that it provides not only a qualitative fingerprint of the magnetization processes but also quantitative information of the switching or coercive field distribution and the local interaction field.6
Initially, the method was applied in geo- and paleomagnetic studies for mineral and domain state discrimination.7–9 With recent advancements in measurement automation and data processing the FORC method has become a characterization tool for many hysteretic systems, including magnetic recording media,10–12 multi-layered nanowires13 and hard/soft exchange-spring composites.14–17 For the latter Panagiotopoulos18 derived a theoretical model based on a mean-field approach to explain the twin interference features in the FORC diagrams. Schrefl et al. simulated the FORC diagrams of sintered Nd2Fe14B with regions of magnetically soft defects by LLG-micromagnetics simulations and compared the diagrams to raw and desheared experimental data,19 while Chen et al. studied the difference between a common sintered Nd2Fe14B sample and Nd2Fe14B particles of a rapid solidification process embedded in a nonmagnetic varnish.20 In this work we apply for the first time the FORC method to magnetoactive elastomers with magnetically hard and hard/soft mixed magnetic fillers and compare the results with non-elastic systems to investigate the effect of the composition of the magnetic filler and the matrix elasticity on the irreversible magnetization processes and their local switching and interaction fields.
2 Experimental
2.1 Sample preparation
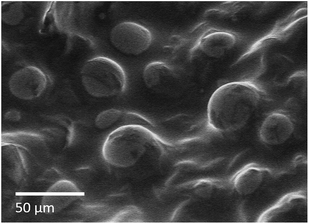
The MAE samples manufactured for the present study were based on a polydimethylsiloxane (PDMS) matrix which is identical to the SIEL®3,5 and Wacker Elastosil® material. An organometallic crosslinking agent has been used to initiate the polymerization process. To modify the elasticity of the matrix the liquid rubber component has been diluted with silicone oil (M100 Baysilone from Bayer) prior use.The magnetic filler in the samples were magnetically hard NdFeB alloy particles (MQP-S-11-9-20001-070 from Magnequench) or mixtures of NdFeB particles and magnetically soft carbonyl iron particles (precoated, grade CC from BASF). The NdFeB and the iron particles were spherical with mean diameters of 46.8 μm and 4.4 μm, i.e. magnetic multidomain particles. The SEM image in Fig. 1 shows as an example the spherical NdFeB particles embedded in the polymerized matrix. To prevent particle aggregation and to enhance the adhesion to the polymeric matrix the NdFeB particles were pretreated with a mixture of ether and silicone oil 100![[thin space (1/6-em)]](https://www.rsc.org/images/entities/char_2009.gif) :
:![[thin space (1/6-em)]](https://www.rsc.org/images/entities/char_2009.gif) 10
10![[thin space (1/6-em)]](https://www.rsc.org/images/entities/char_2009.gif) :
:![[thin space (1/6-em)]](https://www.rsc.org/images/entities/char_2009.gif) 1 by mass, which was evaporated before the particles were added to the rubber component of the matrix. The mixture of rubber and magnetic filler was degassed and subsequently mixed with the cross-linking agent of the matrix to yield a filler volume concentration of ∼28%. Finally the mixture of matrix chemicals and filler was degassed a second time and cured at 80 °C for three hours. In addition to the MAE samples, reference samples with an inelastic matrix of epoxy resin and an aliphatic amine hardener (plus endfest 300 from UHU) were prepared, one with 100% NdFeB and one with ∼75% NdFeB in the filler. The sample compositions and mechanical properties are summarized in Table 1 in Section 3.1.
1 by mass, which was evaporated before the particles were added to the rubber component of the matrix. The mixture of rubber and magnetic filler was degassed and subsequently mixed with the cross-linking agent of the matrix to yield a filler volume concentration of ∼28%. Finally the mixture of matrix chemicals and filler was degassed a second time and cured at 80 °C for three hours. In addition to the MAE samples, reference samples with an inelastic matrix of epoxy resin and an aliphatic amine hardener (plus endfest 300 from UHU) were prepared, one with 100% NdFeB and one with ∼75% NdFeB in the filler. The sample compositions and mechanical properties are summarized in Table 1 in Section 3.1.
| Sample | Matrix | ϕ soft (%) | ϕ hard (%) | E (kPa) |
|---|---|---|---|---|
| S1 | Siel | 0 | 100 | 41 |
| S2 | Siel | 24 | 76 | 36 |
| S3 | Siel | 43 | 57 | 26 |
| S4 | Siel | 64 | 36 | 28 |
| S5 | Elastosil | 45 | 55 | 50 |
| S6 | Elastosil | 45 | 55 | 120 |
| S7 | Elastosil | 45 | 55 | 440 |
2.2 Mechanical characterization
The elastic moduli of the manufactured MAE samples were measured within a quasi-static axial compression. In the test, the cylindrical sample is fixed in a movable upper and static lower fixture. The measurements were performed at a speed of 0.05 mm s−1 controlling the displacement, which was limited to approximately 5% of the initial sample length in order to avoid significant influence of the sample deformation in the radial direction. To determine the elastic modulus, the measured forces and displacements were transformed into stress (σ) and strain (ε) values, respectively, taking into account the cross-section and the height of the sample. The tensile modulus E is defined as E = dσ/dε, i.e. as the slope of the stress–strain curve which remains linear in the range of deformation used.2.3 Magnetic characterization
The magnetic properties were measured in a Lakeshore vibrating sample magnetometer 7400, which offers the advantage of high field intensities across a large sample space. The FORC measurement procedure was implemented according to the algorithm of the MicroMag software of the Princeton Measurements Corporation. This algorithm extends the chosen measurement range by a certain number of points, in the present work by five points, to avoid first point artefacts and to compensate for range losses caused by the smoothing in the subsequent data processing.Prior to measuring each FORC the sample was saturated in a magnetic field of 1750 kA m−1. Next a calibration measurement was recorded to monitor field drifts. Then the field was decreased to the reversal field Hr. Starting from this reversal field an ascending FORC was recorded as the magnetization M(Ha,Hr) when the applied magnetic field Ha was swept back to saturation with an average measuring time of two seconds per point. For the subsequent FORCs the reversal field Hr was decreased to obtain a set of FORCs, which covered the range of positive to negative coercive fields.
The FORC distribution of ascending FORCs is defined as the mixed derivative of the magnetization M(Hr,Ha) with respect to the reversal field Hr and the applied field Ha:6
 | (1) |
The distribution is calculated from a second order polynomial surface fit to the local magnetization of the FORCs. In the present work the analysis package FORCinel 2.05 with a LOESS smoothing factor of 10 has been used for the calculations.21 The resulting distributions were plotted rotated by 45° so that the horizontal axis relates to the coercive or switching field Hc and the vertical axis to the interaction field Hu. To preserve the information of the plots for black and white printing we have used a cubehelix color map which converts to a greyscale with a continuous decrease in brightness.22 In the FORC plots, distribution values of zero indicate reversible magnetization processes and non-zero values indicate irreversible magnetization processes.
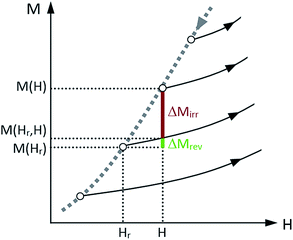
If the measured FORCs are free of first point artefacts, the initial slopes of consecutive FORCs can be used to calculate the initial irreversible and reversible magnetization changes, ΔMirr and ΔMrev, as illustrated in Fig. 2. From these differences the irreversible and reversible coercivity distributions, firr and frev, are calculated.20,23,24 Due to the finite size of the field increments in any experiments these experimentally determined distributions are, strictly spoken, only the distributions near the upper branch of the hysteresis loop but not of the upper branch (H → Hr) as defined in eqn (2).23,24
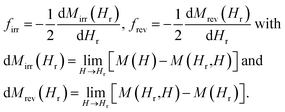 | (2) |
Compared to typical FORC measurements with 100 to 200 FORCs,6 we have recorded 699 FORCs with an averaging time of 2 s per point and field increments between 3.0 and 3.7 kA m−1 to assure the relaxation of the samples and a sufficiently high field resolution for the evaluation of the distributions.
Since Schrefl et al. have shown that the demagnetizing field related to the outer shape of the sample can introduce artefacts in FORC distributions,19 the FORCs in the present work have been desheared to present the magnetization in an effective internal field M(![[H with combining tilde]](https://www.rsc.org/images/entities/i_char_0048_0303.gif) r,
r,![[H with combining tilde]](https://www.rsc.org/images/entities/i_char_0048_0303.gif) a) with
a) with
![[H with combining tilde]](https://www.rsc.org/images/entities/i_char_0048_0303.gif) k = Hk − NshapeM(Hr,Ha), k = a,r k = Hk − NshapeM(Hr,Ha), k = a,r | (3) |
 | (4) |
The demagnetizing factors Nshape of the samples have been approximated by the demagnetizing factors of ellipsoids of revolution.25 For particle samples with a known internal structure a linear interpolation between the shape demagnetizing factor of the internal structure and the demagnetizing factor due to the outer shape of the sample has been proposed.26,27 Assuming that the internal structure are either spherical particles with N = 1/3 or elongated structures of particles aligned parallel to the direction of the magnetic field with N < 1/3, such interpolated demagnetizing factors would be lower than the demagnetizing factor of a continuous medium as assumed in this work. Thus, the demagnetizing factors Nshape used for the FORCs represent an upper limit in order to check for any artefacts arising from the outer sample shape.
3 Results and discussion
3.1 Mechanical characterization
The tensile modulus E has been evaluated for all manufactured MAE samples in a non-magnetized state using a quasi-static compression test as described above. The parameters of the samples are collected in Table 1. Samples S1 to S4 differ in the concentration ratio of magnetically soft iron (ϕsoft) and magnetically hard NdFeB particles (ϕhard) and have tensile moduli, which are in the same order of magnitude, while samples S5 to S7 have the same particle concentration ratio but they differ significantly in their stiffness.3.2 Standard magnetic characterization
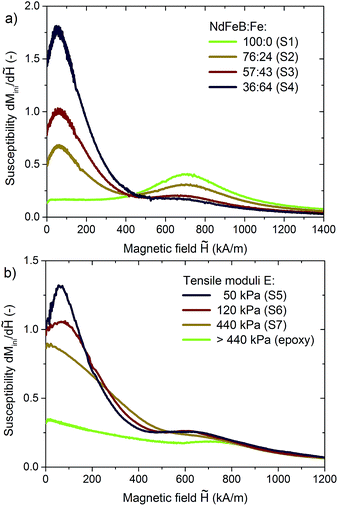
For the basic characterization the initial magnetization Mini from zero field to positive saturation, the first major magnetization loop and repeated major magnetization loops have been measured. The susceptibility of the initial magnetization curve dMini/d![[H with combining tilde]](https://www.rsc.org/images/entities/i_char_0048_0303.gif) of the MAEs with mixed magnetic filler (Fig. 3) displays two maxima – one in weak magnetic fields related to the magnetization of the iron particles and one in strong magnetic fields due to the magnetization of the NdFeB particles. In the samples S1 to S4 with similar tensile moduli and varied filler composition, shown in Fig. 3a, the magnetization of the iron particles occurs at a field of ∼60 kA m−1 and grows in intensity if the iron concentration of the magnetic filler is increased. The maximum in the susceptibility appears shifted to higher fields, i.e. 60 kA m−1, compared to the maximum in the susceptibility of compressed iron powder (<7 kA m−1) or in the mixed magnetic epoxy samples (∼21 kA m−1).
of the MAEs with mixed magnetic filler (Fig. 3) displays two maxima – one in weak magnetic fields related to the magnetization of the iron particles and one in strong magnetic fields due to the magnetization of the NdFeB particles. In the samples S1 to S4 with similar tensile moduli and varied filler composition, shown in Fig. 3a, the magnetization of the iron particles occurs at a field of ∼60 kA m−1 and grows in intensity if the iron concentration of the magnetic filler is increased. The maximum in the susceptibility appears shifted to higher fields, i.e. 60 kA m−1, compared to the maximum in the susceptibility of compressed iron powder (<7 kA m−1) or in the mixed magnetic epoxy samples (∼21 kA m−1).
A similar shift of the maximum susceptibility has already been observed in samples with solely soft magnetic fillers and has been attributed to the movement and restructuring of the filler particles.28 The formation of structures aligned parallel to the applied field reduces the local demagnetizing field and thus increases the susceptibility in a certain field interval more than the simultaneous decrease by the magnetic saturation of the particles. Inversely, the first maximum in the susceptibility flattens and shifts to lower fields, as seen in Fig. 3b, when the stiffness of the matrix is increased and the restructuring of the iron particles is suppressed. The second maximum in the susceptibility, related to the NdFeB particles, appears shifted to lower fields in MAEs with lower tensile moduli since the reduction of the local demagnetizing field due to the structuring of the iron particles aids the magnetization of the NdFeB particles.
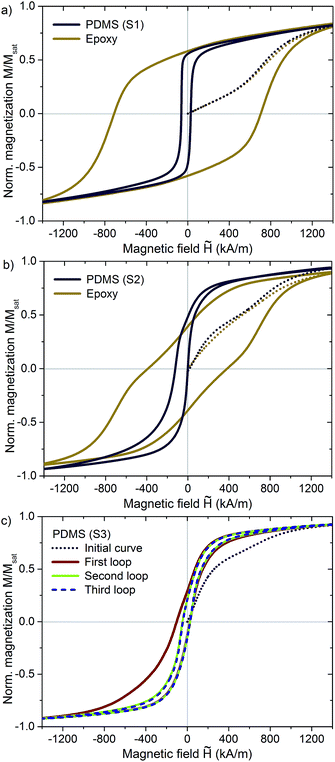
Compared to the major magnetization loops of epoxy samples, in which the magnetization of the immobilized filler particles reverses by nucleation and expansion of domains,19 the bulk coercivity of the MAE with mobile filler particles is significantly reduced (Fig. 4a). In the MAE samples with mixed magnetic fillers the saturation remanence decreases with increasing amount of the iron in the filler and the saturation magnetization increases as summarized in Table 2 in Section 3.3. Furthermore, the major hysteresis loops of the MAEs with mixed magnetic fillers display a continuous magnetization reversal in contrast to the stepped two-phase magnetization in the epoxy sample shown in Fig. 4b.
| Sample | Saturation magnetization (kA m−1) | FORC saturation remanence (kA m−1) | FORC bulk coercive fields (kA m−1) | Coercive fields and interaction fields of the main positive FORC features (kA m−1) |
|---|---|---|---|---|
| S1 | 366 | 174 | −57; 37 | 30/−20 |
| S2 | 395 | 167 | −180; 24 | 111/−149; 141/−104; 308/−245 |
| S3 | 418 | 107 | −99; 37 | 23/−53; 99/−59; 317/−257 |
| S4 | 543 | 73 | −45; 16 | 131/−176; 192/−138; 421/−368 |
| S5 | 514 | 175 | −103; 63 | 108/−51; 278/−201 |
| S6 | 482 | 155 | −131; 81 | 440/−146; 589/−26 |
| S7 | 458 | 128 | −152; 138 | 235/−139; 577/−25 |
Most remarkably, however, is that the first major magnetization loops of the MAEs with mixed magnetic fillers differ considerably from their repeated loops (Fig. 4c and ESI†) analogous to the first and repeated stress–strain cycles observed in MAEs in a magnetic field.29 In the descending branch of the first loop the magnetic particles have previously seen only a positive saturation field, hence there is only a positive remanence in the sample. In the repeated magnetisation curves the particles have already seen a positive and a negative saturation field. Therefore, the statistical distribution of the magnetic moments and thus also the inner structure are different compared to the first loop. Due to the preferential orientation and magnetization of the particles in the direction of the positive saturation field the first loop is asymmetric to both the field and the magnetization axis. Similar asymmetric loops are observed in ferroelectrics with preferential polarization and strain configurations.30
When the magnetic field is reduced from positive saturation the preferential orientation is removed and the filler particles and polymer chains progressively arrange themselves to the structures present in the repeated loops. These principal magnetization and restructuring processes are probed by FORC measurements with gradually reduced reversal fields.
3.3 FORCs of MAEs with a variation of the filler composition
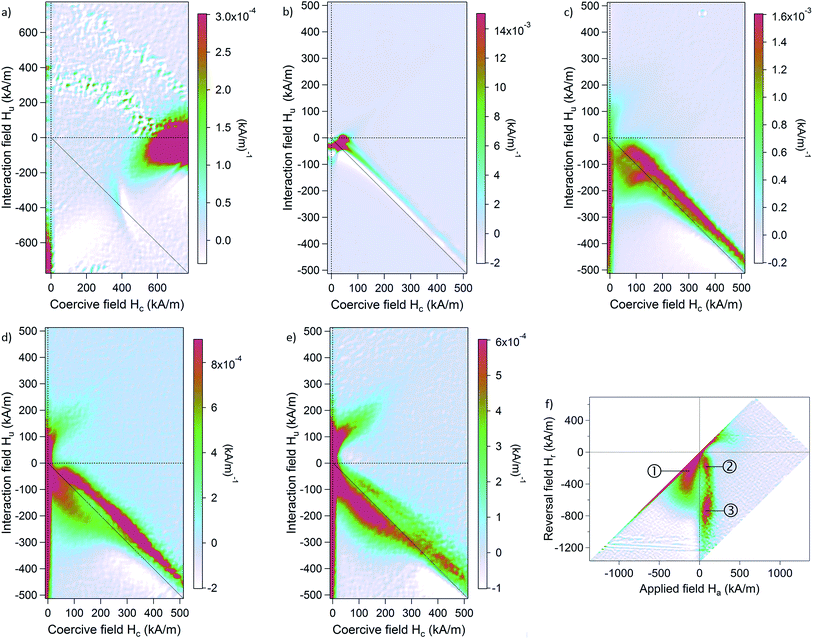
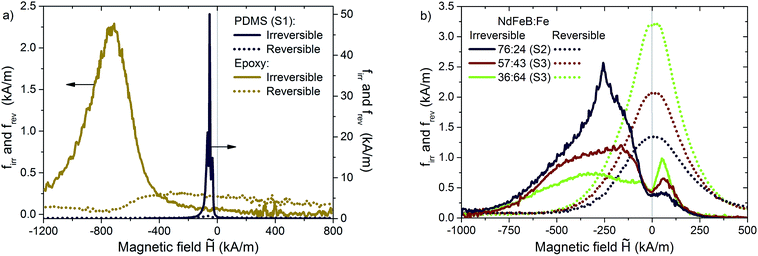
The deshearing of the FORCs according to eqn (3) did not remove or introduce any additional features in the majority of the FORC distributions compared to the distributions calculated from the raw FORCs. In these cases only the desheared data are presented, otherwise the changes in the distributions will be discussed.Similar to sintered permanent magnets or MQP-B NdFeB particles15,20 the MQP-S NdFeB particles exhibit two distinct positive regions of the FORC distribution in an epoxy resin matrix (Fig. 5a). The first irreversible magnetization region, related to the magnetically hard phase in the NdFeB particles, occurs at a high coercive field of Hc = 702 kA m−1 and the second region at a low coercive field Hc < 0 kA m−1 in the desheared FORC distribution, which corresponds to Hc = 0 kA m−1 in the raw FORC distribution. The positive regions are accompanied by negative twin features and an additional weak interference region at Hc = 403 kA m−1 and Hu = 392 kA m−1. In contrast to the FORC distribution of MQP-B particles the low coercivity region of the MQP-S particles is shifted to a strong negative interaction field of Hu = −776 kA m−1. According to Panagiotopoulos18 such a shift will occur in systems with a magnetically hard and a magnetically soft component, if these components interact with each other but have a negligible overlap of their coercivity distributions. NdFeB particles can contain an intrinsic soft phase, such as α-Fe or FeB,20 which exchange couples to the magnetically hard phase in the particles. However, the low coercivity region of the MQP-S particles is rather narrow compared to the wide spread regions observed in sintered NdFeB or MQP-B NdFeB particles and the magnetization distribution of the major loop (Fig. 6a) is dominated by irreversible magnetization, in contrast to the distribution of MQP-B particles,20 in which the reversible and irreversible contributions are balanced. This indicates that the MQP-S NdFeB particles of the present study do not contain excessive concentrations of a soft phase but mainly reverse their magnetization as a single hard magnetic phase.
If the NdFeB particles are embedded in the elastic matrix of a MAE the FORC distribution (Fig. 5b) changes drastically. The distribution exhibits only one major irreversible magnetization region at a weak interaction field of Hu > −50 kA m−1 and a coercive field of Hc = 30 kA m−1 since the particles reverse their magnetization by rotating and moving within the matrix rather than energetically unfavorable domain processes within the particles. The magnetization distribution of the first major loop (Fig. 6a) is therefore dominated by irreversible magnetization, which is stronger than in the epoxy sample, although both samples contain similar volume concentrations of NdFeB.
With the addition of magnetically soft iron particles to the filler of the MAE the FORC distributions (Fig. 5c–f) become more complex. An asymmetric reversible ridge along the Hu axis at Hc = 0 kA m−1 appears, which is caused by the coupling of the reversible magnetization of the added iron particles to the irreversible magnetization states of the system.31 The overall intensity of the irreversible FORC features decreases with increasing amount of iron particles and the reversible contributions to the magnetization of the major loop (Fig. 6b) increase. Furthermore, several regions of irreversible magnetization, listed in Table 2, occur at interaction fields Hu < −50 kA m−1 due to the magnetostatic coupling and the motion of the particles within the matrix. These features also occur in the FORC distributions of the unsheared FORCs, as exemplarily shown in Fig. 5f.
Based on the strength of the reversal field, we would assign the irreversible magnetization features at weakly negative reversal fields, labelled 1 and 2 in Fig. 5f, to the magnetization and structuring of the soft iron phase, and the irreversible magnetization at a strong negative reversal field, labelled 3 in Fig. 5f, to the hard NdFeB phase. Interestingly, the FORC features of the soft phase occur at a negative and a positive applied field. The feature at a negative applied field is likely to be related to the magnetization reversal of iron particles in the close vicinity to positively magnetized NdFeB particles. To reverse the magnetization of these particles the applied field has to be negative to compensate the positive remanent field of the neighboring NdFeB particles. The feature at a positive applied field, on the other hand, is likely to originate from the motion and restructuring of the iron particles in the matrix, similar to the structuring observed in the susceptibility measurements described in the previous section.
3.4 FORCs of MAEs with a variation of the matrix elasticity
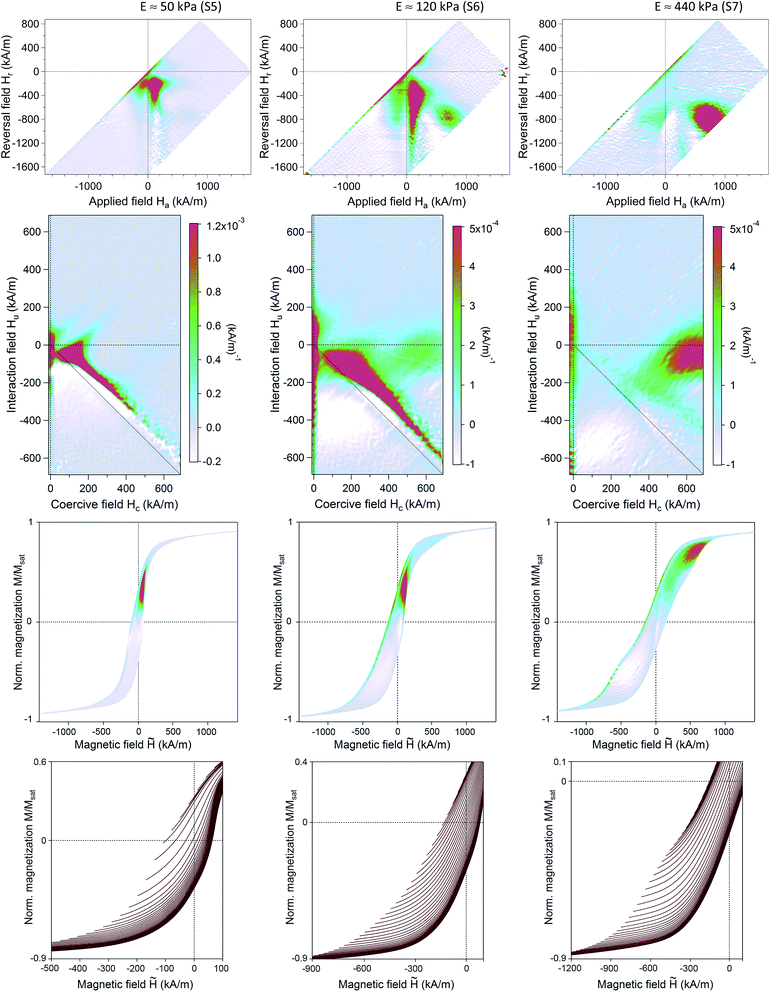
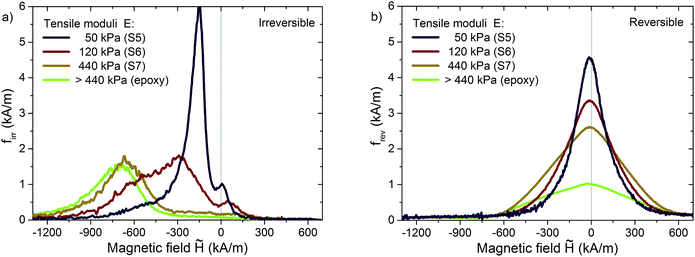
To investigate the influence of the matrix elasticity on the magnetization and structuring of the filler particles, the FORCs of MAEs with a constant sample composition but increasing tensile moduli E were measured. Fig. 7 shows the respective FORC distributions of the unsheared and desheared FORCs and a projection of the distributions onto the FORCs. All samples display a reversible ridge at Hc = 0 kA m−1 due to the soft iron particles in the filler. In contrast to the distribution of sample S3 the irreversible magnetization of the soft phase at negative applied fields in sample S5 and S6 is only observed in the distributions of the unsheared FORCs. In the distributions of the desheared FORCs it seems to be covered by the negative twin feature of the strong irreversible magnetization in positive applied fields. This demonstrates that the FORC method is able to detect even subtle differences between MAE samples, such as the rate of cross-linking of the matrix surrounding the particles or the adhesion of the polymer molecules to the particles, which are not apparent from major hysteresis loops.If the stiffness of the matrix is increased an additional FORC feature at high coercive fields Hc > 600 kA m−1 occurs (Fig. 7E ≈ 120 kPa and E ≈ 440 kPa) and the low coercivity features gradually disappear. The irreversible contribution to the magnetization of the first major loop (Fig. 8) decreases accordingly and shifts to lower fields. These changes in the magnetization processes can be explained by the progressive suppression of the particle motion. On the one hand, the reduced mobility reduces the interparticle interaction since the particles cannot rearrange themselves in structures close to each other. On the other hand, the magnetization reversal by domain processes is enhanced within the immobilized NdFeB particles. Hence, the FORC distributions of sample S6 with an intermediate tensile modulus display both, features of mobile coupled particles as well as immobile decoupled particles. Sample S7 with a stiff matrix resembles the FORC distribution of the epoxy sample S1 with an additional reversible ridge due to the iron particles and shows a stepped contour of the FORCs, which is typical for the magnetization switching of two decoupled phases.
4 Conclusion
The first stress–strain cycle29 and the first magnetization loop of magnetoactive elastomers in a magnetic field differ considerably from the following cycles and loops. The presented study provides an insight into the irreversible magnetization processes during the first magnetization of MAEs with magnetically hard and hard/soft mixed magnetic fillers. The magnetization processes were analyzed by high resolution first-order reversal curve measurements, which proved to be a powerful and sensitive tool to detect the local coercive and interaction fields in dependence of the magnetization history of the MAE samples. By a variation of the hard/soft filler composition and the matrix elasticity it has qualitatively been shown that the irreversible magnetization processes are the result of interparticle interactions and of a complex restructuring of the filler particles and the matrix polymer chains in an applied magnetic field.Future work could, on the one hand, investigate how other factors like the field ramp rate or the ratio of the particle sizes of the magnetically soft and hard component, which were kept constant in the present study, influence the reversible and irreversible magnetization processes in MAEs. On the other hand, 3D imaging techniques such as X-ray μ-computer-tomography32,33 should be enhanced, with respect to their resolution but also to the available magnetic field intensities, in order to provide microstructural information of MAEs which allows a precise correlation between the changes of the internal structure and the corresponding changes in the local demagnetizing field and thus in the FORC distributions. If we gain a deeper knowledge of the physics of MAEs in a magnetic field and the corresponding magnetomechanical properties we could ideally use the FORC method as a monitoring tool for the sample quality of MAEs for future technical applications.
Acknowledgements
We gratefully acknowledge the funding by the Deutsche Forschungsgemeinschaft within the German-Russian Research Collaboration PAK907, grant numbers Od18/24-1 and Bo3343/1-1, and would like to thank Dipl. Ing. Thomas Richter at the TU Dresden for the preparation of the first set of MAE samples and Dipl. Ing. Petra Fiala at the TU Dresden for the SEM image.References
- J. Thévenot, H. Oliveira, O. Sandre and S. Lecommandoux, Magnetic responsive polymer composite materials, Chem. Soc. Rev., 2013, 42, 7099–7116, 10.1039/c3cs60058k.
- G. Filipcsei, I. Csetneki, A. Szilágyi and M. Zrínyi, Magnetic Field-Responsive Smart Polymer Composites, Oligomers–Polymer Composites – Molecular Imprinting (Adv. Polym. Sci. 206), Springer, Berlin-Heidelberg, 2007, pp. 137–189, DOI:10.1007/12_2006_104.
- G. V. Stepanov, D. Y. Borin, Y. L. Raikher, P. V. Melenev and N. S. Perov, Motion of ferroparticles inside the polymeric matrix in magnetoactive elastomers, J. Phys.: Condens. Matter, 2008, 20, 204121–204127, DOI:10.1088/0953-8984/20/20/204121.
- D. Y. Borin and G. V. Stepanov, Oscillation measurements on magnetoactive elastomers with complex composition, J. Optoelectron. Adv. Mater., 2013, 15(3–4), 249–253 CAS , http://joam.inoe.ro/download.php?idu=3186.
- G. V. Stepanov, A. V. Chertovich and A. Y. Kramarenko, Magnetorheological and deformation properties of magnetically controlled elastomers with hard magnetic filler, J. Magn. Magn. Mater., 2012, 324, 3448–3451, DOI:10.1016/j.jmmm.2012.02.062.
- A. P. Roberts, D. Heslop, X. Zhao and C. R. Pike, Understanding fine magnetic particle systems through use of first-order reversal curve diagrams, Rev. Geophys., 2014, 52(4), 557–602, DOI:10.1002/2014rg000462.
- A. P. Roberts, C. R. Pike and K. L. Verosub, First-order reversal curve diagrams: a new tool for characterizing the magnetic properties of natural samples, J. Geophys. Res., 2000, 105(B12), 28461–28475, DOI:10.1029/2000jb900326.
- C. Carvallo, A. R. Muxworthy and D. J. Dunlop, First-order reversal curve (FORC) diagrams of magnetic mixtures: micromagnetic models and measurements, Phys. Earth Planet. Inter., 2006, 154, 308–322, DOI:10.1016/j.pepi.2005.06.017.
- A. R. Muxworthy and A. P. Roberts, First-Order Reversal Curve (FORC) Diagrams, Encyclopedia of Geomagnetism and Paleomagnetism, ed. D. Gubbins and E. Herrero-Bervera, Springer, Dordrecht, 2007, pp. 266–272, DOI:10.1007/978-1-4020-4423-6_99.
- C. Papusoi, K. Srinivasan and R. Acharya, Study of grain interactions in perpendicular magnetic recording media using first order reversal curve diagrams, J. Appl. Phys., 2011, 110, 083908, DOI:10.1063/1.3652846.
- B. F. Valcu, D. A. Gilbert and K. Liu, Fingerprinting inhomogeneities in recording media using the first-order reversal curve method, IEEE Trans. Magn., 2011, 47(10), 2988–2991, DOI:10.1109/tmag.2011.2146241.
- S. N. Piramanayagam and M. Ranjbar, Influence of magnetic viscosity on the first order reversal curves of antiferromagnetically coupled perpendicular recording media, J. Appl. Phys., 2012, 111, 07B728, DOI:10.1063/1.3680536.
- E. Jafari-Khamse, M. Almasi Kashi and A. Ramazani, First-order-reversal-curve (FORC) diagrams of alternative chain of soft/hard magnetic CoFe/Cu multilayer nanowires, Curr. Appl. Phys., 2015, 16, 486–496, DOI:10.1016/j.cap.2015.12.001.
- J. E. Davies, O. Hellwig, E. E. Fullerton, J. S. Jiang, S. D. Bader, G. T. Zimányi and K. Liu, Anisotropy dependence of irreversible switching in Fe/SmCo and FeNi/FePt exchange spring magnet films, Appl. Phys. Lett., 2005, 86, 262503, DOI:10.1063/1.1954898.
- H. Chiriac, N. Lupu, L. Stoleriu, P. Postolache and A. Stancu, Experimental and micromagnetic first-order reversal curves analysis in NdFeB-based bulk “exchange spring”-type permanent magnets, J. Magn. Magn. Mater., 2007, 316, 177–180, DOI:10.1016/j.jmmm.2007.02.049.
- D. R. Cornejo, T. R. F. Peixoto, S. Reboh, P. F. P. Fichtner, V. C. de Franco, V. Villas-Boas and F. P. Missell, First-order-reversal-curve analysis of Pr–Fe–B-based exchange spring magnets, J. Mater. Sci., 2010, 45, 5077–5083, DOI:10.1007/s10853-010-4353-3.
- D. Roy, K. V. Sreenivasulu and P. A. Anil Kuma, Investigation on non-exchange spring behaviour and exchange spring behaviour: a first order reversal curve analysis, Appl. Phys. Lett., 2013, 103, 222406, DOI:10.1063/1.4836015.
- I. Panagiotopoulos, A simple approach to the first order reversal curves (FORC) of two-phase magnetic systems, J. Magn. Magn. Mater., 2011, 323(16), 2148–2153, DOI:10.1016/j.jmmm.2011.03.021.
- T. Schrefl, T. Shoji, M. Winklhofer, H. Oezelt, M. Yano and G. Zimányi, First order reversal curve studies of permanent magnets, J. Appl. Phys., 2012, 111, 07A728, DOI:10.1063/1.3678434.
- P. A. Chen, C. Y. Yang, S. J. Chang, M. H. Lee, N. K. Tang, S. C. Yen and Y. C. Tseng, Soft and hard natures of Nd2Fe14B permanent magnet explored by first-order-reversal-curves, J. Magn. Magn. Mater., 2014, 370, 45–53, DOI:10.1016/j.jmmm.2014.06.027.
- R. J. Harrison and J. M. Feinberg, FORCinel: an improved algorithm for calculating first-order reversal curve distributions using locally weighted regression smoothing, Geochem., Geophys., Geosyst., 2008, 9(5), Q05016, DOI:10.1029/2008gc001987.
- D. A. Green, A colour scheme for the display of astronomical intensity images, Bull. Astron. Soc. India, 2011, 39, 289–295 Search PubMed.
- M. Winklhofer, R. K. Dumas and K. Liu, Identifying reversible and irreversible magnetization changes in prototype patterned media using first- and second-order reversal curves, J. Appl. Phys., 2008, 103, 07C518, DOI:10.1063/1.2837888.
- R. Egli and M. Winklhofer, Recent developments on processing and interpretation aspects of first-order reversal curves (FORC), Scientific notes of the Kazan University (Natural science series), 2014, 156(1), 14–53, http://kpfu.ru/portal/docs/F_201585826/156_1_est_2_e.pdf.
- E. D. Stoner, The demagnetizing factors for ellipsoids, London, Edinburgh Dublin Philos. Mag. J. Sci., 1945, 36, 803–821, DOI:10.1080/14786444508521510.
- B. Bleaney and R. A. Hull, The effective susceptibility of a paramagnetic powder, Proc. R. Soc. London, Ser. A, 1941, 178, 86–92, DOI:10.1098/rspa.1941.0045.
- J. M. Martínez-Huerta, J. de La Torre Medina, L. Piraux and A. Encinas, Configuration dependent demagnetizing field in assemblies of interacting magnetic particles, J. Phys.: Condens. Matter, 2013, 25, 226003, DOI:10.1088/0953-8984/25/22/226003.
- G. V. Stepanov, D. Yu. Borin, Y. L. Raikher, P. V. Melenev and N. S. Pero, Motion of ferroparticles inside the polymeric matrix in magnetoactive elastomers, J. Phys.: Condens. Matter, 2008, 20, 204121, DOI:10.1088/0953-8984/20/20/204121.
- V. V. Sorokin, G. V. Stepanov, M. Shamonin, G. J. Monkman, A. R. Khokhlov and E. Y. Kramarenko, Hysteresis of the viscoelastic properties and the normal force in magnetically and mechanically soft magnetoactive elastomers: effects of filler composition, strain amplitude and magnetic field, Polymer, 2015, 76, 191–202, DOI:10.1016/j.polymer.2015.08.040.
- V. Koval, G. Viola and Y. Tan, Biasing Effects in Ferroic Materials, Ferroelectric Materials – Synthesis and Characterization, InTech open access, 2015. DOI:10.5772/60764.
- C. R. Pike, First-order reversal-curve diagrams and reversible magnetization, Phys. Rev. B: Condens. Matter Mater. Phys., 2003, 68, 104424, DOI:10.1103/physrevb.68.104424.
- T. Gundermann and S. Odenbach, Investigation of the motion of particles in magnetorheological elastomers by X-μCT, Smart Mater. Struct., 2014, 23, 105013, DOI:10.1088/0964-1726/23/10/105013.
- S. Odenbach, Microstructure and rheology of magnetic hybrid materials, Arch. Appl. Mech., 2016, 86, 269–279, DOI:10.1007/s00419-015-1092-6.
Footnote |
| † Electronic supplementary information (ESI) available: Plots of first and repeated MH-curves and 16 bit cubehelix colorscale. See DOI: 10.1039/c6ra23435f |
| This journal is © The Royal Society of Chemistry 2016 |

