
 Open Access Article
 This Open Access Article is licensed under a
 Creative Commons Attribution 3.0 Unported Licence
Shiga toxin induces membrane reorganization and formation of long range lipid order†
Vita
Solovyeva
*a,
Ludger
Johannes
b and
Adam Cohen
Simonsen
a
aMemphys, Department of Physics, Chemistry and Pharmacy, University of Southern Denmark, Campusvej 55, DK-5230 Odense M, Denmark. E-mail: vita@memphys.sdu.dk
bInstitut Curie, UMR3666 CNRS, U1143 INSERM, 26 rue d'Ulm, 75248 Paris Cedex 05, France
First published on 7th November 2014
Abstract
Lateral variation of the in-plane orientation of lipids in a bilayer is referred to as texture. The influence of the protein Shiga toxin on orientational membrane texture was studied in phosphatidylcholine lipid bilayers using polarization two-photon fluorescence microscopy and atomic force microscopy. A content of 1% of glycosphingolipid globotriaosylceramide (Gb3) receptor lipids in a bilayer was used to bind the Shiga toxin B-subunit to the surface of gel domains. Binding of the Shiga toxin B-subunit to lipids led to the modulation of orientational membrane texture in gel domains and induced membrane reordering. When Shiga toxin was added above the lipid chain melting temperature, the toxin interaction with the membrane induced rearrangement and clustering of Gb3 lipids that resulted in the long range order and alignment of lipids in gel domains. The toxin induced redistribution of Gb3 lipids inside gel domains is governed by the temperature at which Shiga toxin was added to the membrane: above or below the phase transition. The temperature is thus one of the critical factors controlling lipid organization and texture in the presence of Shiga toxin. Lipid chain ordering imposed by Shiga toxin binding can be another factor driving the reconstruction of lipid organization and crystallization of lipids inside gel domains.
I. Introduction
Protein–lipid interactions are fundamental for the organization and function of biomembranes, but the mechanisms by which proteins can modify the membrane structure are incompletely understood, leaving many questions unanswered.1 An illustrative example, where the protein–lipid interaction plays a central role, is seen in the case of toxins binding to cellular membranes: the toxin proteins are known to impose a change in the membrane structure leading to various diseases.2,3 For instance, Shiga toxin is a bacterial toxin, produced by Shigella dysenteriae, known to be responsible for endocytosis, membrane bending4 and dysentery. Children infected with Shigella dysenteriae in some cases develop microangiopathic hemolytic anemia, thrombocytopenia and acute renal failure.5 The present work is focused on the study of the influence of Shiga toxin on the lipid texture: the lipid orientation, packing and alignment in bilayers. These lipid properties are known to play important roles in the occurrence of conditions like Fabry disease (see e.g. (ref. 6 and 7)).Recently, Shiga toxin was shown to induce endocytic membrane invaginations in a clathrin-independent manner in cell and model membranes.8–10 For this to happen, the toxin must bind to its cellular receptor, the glycosphingolipid globotriaosylceramide (Gb3).11,12 It has been proposed that membrane thickening underneath the Shiga toxin can be induced by accumulation of Gb3 lipids.9,13 Another member of the two component toxin family (AB5), Cholera toxin, was also suggested to induce membrane texture, which was experimentally presented in grazing incidence X-ray diffraction experiments.14,15 Shiga toxin could potentially participate in the creation of membrane texture in a similar way as cholera toxin. Therefore, the direct observation of texture in a lipid bilayer is needed to understand how Shiga toxin interacts with a lipid membrane.
A newly developed technique, based on polarization two-photon fluorescence microscopy (P2FM), enables the study of texture of gel domains in a lipid bilayer.16–18 We study phosphatidylcholine lipid bilayers, which allow mimicking the cellular membrane and tuning the length of the hydrocarbon chains, degree of saturation, etc. The technique is applicable to the lipid membranes at temperatures below the liquid to gel phase transition. The substrate supported lipid bilayer was used in the study because these systems can be well characterized by means of atomic force, fluorescence and two photon fluorescence microscopy techniques. Said that, a drawback of supported lipid bilayers such as lipid–substrate interactions has to be mentioned, however cell membranes in real biological systems are not freestanding as well because they interact with the cytoskeleton.
In the present work we study how Shiga toxin interacts with lipids in the supported bilayers. The Shiga toxin B-subunit was introduced at temperatures above and below the lipid chain melting point (Tm) into lipid bilayers, prepared by the spin-coating technique.16Tm means the onset of gel domain formation. Different temperatures were employed in order to elaborate the influence of the Gb3 receptor mobility and distribution on the Shiga toxin binding and on the lipid texture. The heating of Shiga toxin B-subunit to the temperature above lipid melting point is possible because of its thermal stability.19 The influence of Shiga toxin on lipid reorganization was studied in three model phosphatidylcholine lipid membrane systems forming gel domains at room temperature: DPPC![[thin space (1/6-em)]](https://www.rsc.org/images/entities/char_2009.gif) :DOPC, DSPC:POPC and DMPC:POPC. A texture study was performed at room temperature.
:DOPC, DSPC:POPC and DMPC:POPC. A texture study was performed at room temperature.
II. Results
The toxin binding to the lipid bilayer was initially studied by atomic force microscopy (AFM). AFM images of the DPPC:DOPC samples containing 1% of Gb3 were obtained at 20 °C and are presented in Fig. 1 for two types of samples: when Shiga toxin was added at a temperature well below and well above the phase transition temperature, Tm, at 20 °C and 60 °C, respectively. For both cases the binding of the Shiga toxin to the membrane surface was confirmed with single protein resolution, as can be seen in Fig. 1. The number of proteins on the bilayer surface was determined from AFM images using the ImageJ program.20 Approximately 100 proteins bound per 1 μm2 of gel domain can be counted for the sample, where Shiga toxin was added at 20 °C. When Shiga toxin was added at 60 °C and the sample was cooled to 20 °C afterwards, domain nucleation and growth take place in the presence of Gb3 and Shiga toxin. Here, an increased toxin binding to the gel domain surface was observed at 20 °C as can be seen in Fig. 1b. The number of toxins per 1 μm2 of the membrane surface is greater than 1000 as followed from the image analysis.
 | ||
| Fig. 1 AFM images of gel domains: (a) 1:1 DPPC:DOPC + 1% of Gb3, STxB was added at 20 °C and (b) 1:1 DPPC:DOPC + 1% of Gb3, STxB was added at 60 °C. Images were taken at 20 °C and at 1 hour after sample preparation. | ||
Addition of Shiga toxin to a membrane containing 1% Gb3 at a temperature above the melting point made a prominent change to the domain size and shape as can be seen from fluorescence images in Fig. 2. Therefore, to study the influence of Shiga toxin on the lipid orientation in the bilayers a series of samples was prepared: a binary mixture as a reference sample, a binary mixture with 1% of Gb3 lipids, a binary mixture with 1% of Gb3 lipids and with Shiga toxin added at 20 °C, and a binary mixture with 1% of Gb3 lipids and with Shiga toxin added at 60 °C for DPPC:DOPC samples and at 70 °C for DSPC:POPC samples.
 | ||
| Fig. 2 Epifluorescence microscopy images of the freshly prepared samples for DPPC:DOPC (left column) and DSPC:POPC (right column) lipid mixtures: (a) binary mixture reference sample, (b) lipid mixture containing 1% of Gb3, (c) +1% Gb3, STxB was added at 60 °C for the DPPC:DOPC sample and at 70 °C for the DSPC:POPC sample. The temperature when Shiga toxin was added is indicated on the images. Scale bar is applicable to all panels. Images were taken at taken at 20 °C. | ||
Reference samples contained pure DPPC:DOPC, DSPC:POPC, and DMPC:POPC lipids in the molar ratio 1:1, 1:2 and 3:1, respectively. Different lipid combinations were chosen due to different hydrophobic mismatches, which exist between liquid and gel phases in the lipid bilayers.18,21 The hydrophobic mismatch is correlated with the shape of gel domains and recently it was shown that differently shaped domains possess different texture of lipids.18 The fluorescence images of the reference samples are shown in Fig. 2a for DPPC:DOPC and DSPC:POPC lipid combinations, left and right columns, respectively. Gel domains of the DPPC:DOPC sample have a flower-like shape and consist of several petals. In the case of DSPC:POPC the gel domains have a form of fractal-like structure with several branches. The gel domains of the DMPC:POPC samples exhibit a rounded shape (see Fig. S1a†). The phase transition from the liquid to the gel phase was observed at about 38 °C for the DPPC:DOPC sample, at 53 °C for the DSPC:POPC sample and at about 22 °C for DMPC:POPC.
Addition of Gb3 lipids to a lipid mixture alters the phase behavior of the studied two-component membranes. The fluorescence images for the samples containing 1% of Gb3 are shown in Fig. 2b for DPPC:DOPC and DSPC:POPC. Data for DMPC:POPC are presented in Fig. S1b.† One notes, that the size and nucleation density of gel domains changed. Additionally the phase transition temperature, Tm, from the liquid to the gel phase dropped to 35.5 °C for the DPPC:DOPC:Gb3 sample and to 48.3 °C for the DSPC:POPC:Gb3 sample, being in agreement with an increased system entropy. But the change of Tm is not only governed by the classical depression of the freezing point caused by Gb3 acting as an impurity.22 A rough estimate of the freezing point depression gives us about 0.2–0.3 °C (ref. 23 and 24) in contrast to the observed 2–4 °C decrease in the chain melting temperature. Therefore, Gb3 lipids at only a level of 1% impacts lipid order in bilayers in a manner that leads to the observed change of phase transition temperature.
When Shiga toxin was introduced at the temperature above the chain melting point, the resulting shape and size of the gel domains were affected, compare the fluorescent images with and without Shiga toxin Fig. 2b and c. The gel domain nucleation was observed at about 38 °C for the DPPC:DOPC:Gb3:STxB sample and at 51.5 °C for the DSPC:POPC:Gb3:STxB sample. The increase of the melting temperature upon addition of Shiga toxin is striking and is similar to the effect observed for Cholera toxin in DMPC membranes.25 For the DSPC:POPC:Gb3:STxB sample the degradation of fractal-like structure and size with system complexity was observed, while for DPPC:DOPC:Gb3:STxB the domain size is changed but not the shape. For the DMPC:POPC:Gb3 membrane the domain shape remained the same (see Fig. S1c†). For all studied lipid mixtures, addition of Shiga toxin to the preformed gel domains at room temperature did not affect the domain shape and size, because the lipid diffusion is quite slow (about 300 times) at temperatures below the melting point compared to the liquid phase.26 Therefore, to see how Shiga toxin changes lipid orientation inside gel domains the texture measurements are essential.
P2FM was employed to study lipid orientation in gel domains with and without Shiga toxin. The P2FM technique allows the detection of the in-plane lipid orientation under polarized light.16 The detailed description of the technique can be found in Section 5 and in a previously published procedure.16Fig. 3 gives a representative overview of the texture evolution of the studied bilayers when Shiga toxin is introduced for DPPC:DOPC (left column) and DSPC:POPC (right column) mixtures. The texture for the lipid bilayers without Gb3 and with 1% of Gb3 is compared in Fig. 3a and b for DPPC:DOPC and DSPC:POPC mixtures. Gel domain growth starts from the center and the central defect of gel domains was characterized as a pair of point defects17,21,27 (½ point disclinations), the position where the growth of a gel domain starts initially. The central part of the gel domains demonstrates a continuous change of the lipid angle in a vortex like structure.
 | ||
| Fig. 3 Texture analysis of DPPC:DOPC (left) and DSPC:POPC (right) gel domains: (a) binary mixture reference sample, (b) lipid mixture containing 1% of Gb3, (c) lipid mixture containing 1% of Gb3, STxB was added at 20 °C, (d) lipid mixture containing 1% of Gb3, STxB was added at 60 °C for the DPPC:DOPC sample and at 70 °C for the DSPC:POPC sample. P2FM was done at 20 °C the same day as the sample preparation. The temperature when Shiga toxin was added to the bilayer is indicated. Scale bar is indicated in each panel. The inset illustrates the color-code for lipid c-directors, where the projection of the Laurdan probe on the substrate plane is called the c-director. | ||
Addition of Shiga toxin to the preformed gel domains at 20 °C does not make any visual and quantitative changes in the texture of domains as can be seen in Fig. 3c. In contrast when Shiga toxin was introduced at the temperature above the melting point, T > Tm, the lipid texture differs drastically from the sample without toxin (compare Fig. 3b and d). Lipids orient themselves uniformly inside each petal of gel domains in the DPPC:DOPC sample and inside each sector of the DSPC:POPC sample and overall long range lipid alignment emerges. The central double defect feature disappeared for both DPPC:DOPC and DSPC:POPC lipid mixtures when Shiga toxin was added at T > Tm. Instead the line defect between each petals/sector is present. The disappearance of the central double defect feature for the sample with Shiga added at T > Tm, observed in Fig. 3d, indicates that gel domain nucleation and following growth processes are affected by toxins and Gb3 lipids. Line defects between petals were also observed by alternative techniques. The pronounced border (line defect) between two petals in a gel domain can be identified in the AFM images (see Fig. 4), where the density of Shiga toxin is decreased along the defect line.
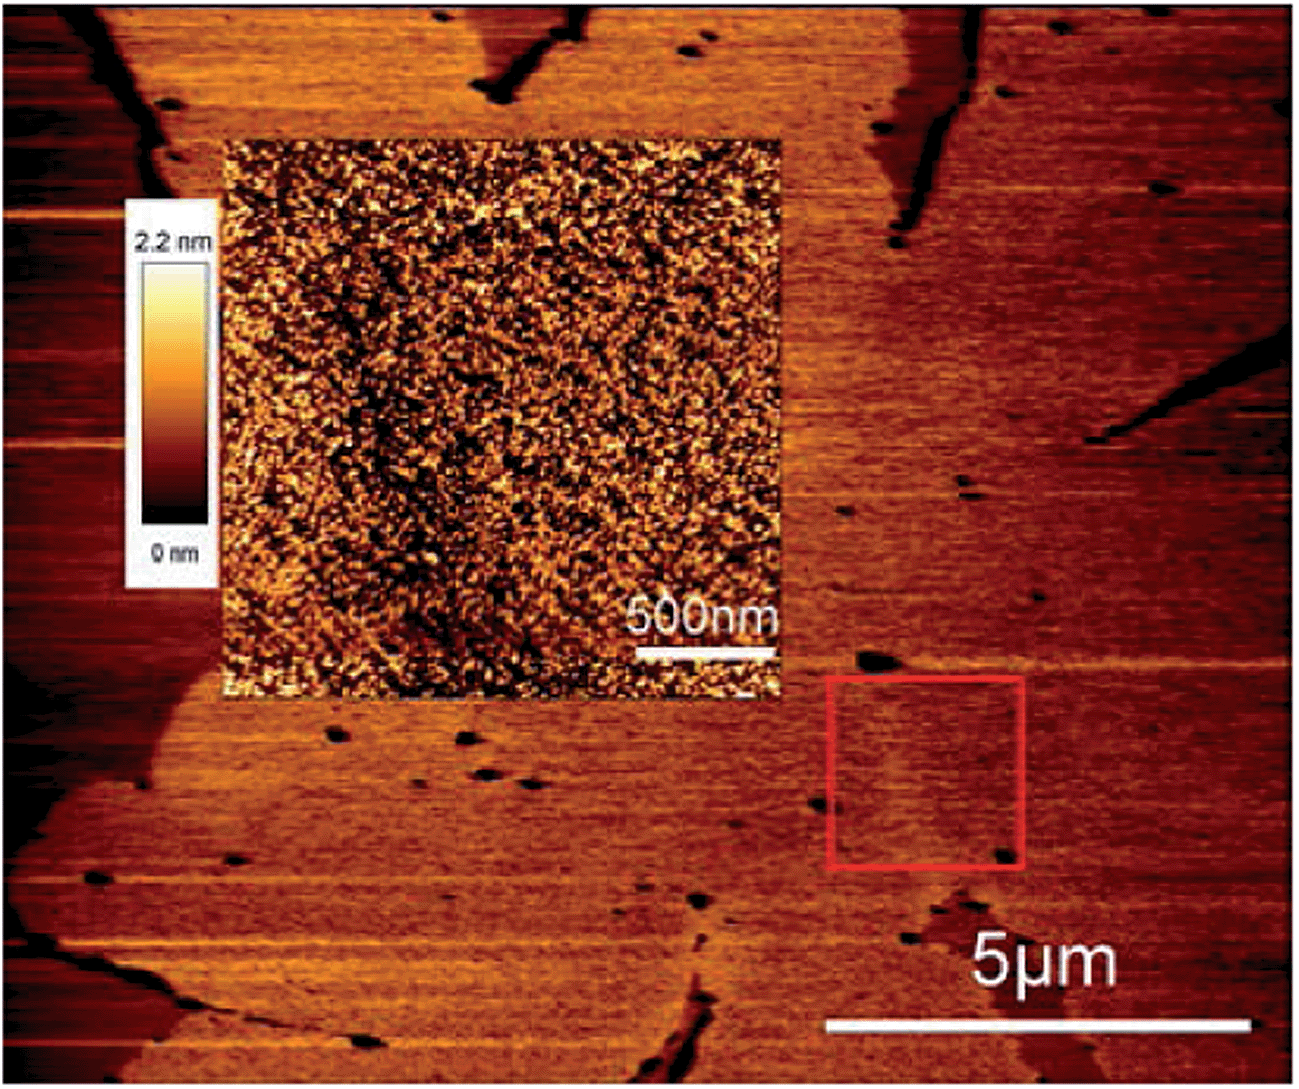 | ||
| Fig. 4 AFM topography image of a gel domain. The square highlights the area, which contains the border between two petals exhibiting different textures in a gel domain. The inset is the AFM image in normal mode and it shows the zoomed square area. 1:1 DPPC:DOPC + 1% of Gb3, STxB was added at 60 °C. Images were taken at 20 °C. | ||
Texture analysis of DMPC:POPC samples is not possible by the P2FM technique, because upon addition of Gb3 lipid to the lipid mixture, lipids change their tilt in gel domains of a lipid bilayer and become perpendicular to the substrate surface. In this case the P2FM technique cannot be used to study lipid orientation.
III. Discussion
Initially it is assumed that Gb3 lipids are distributed uniformly in the bilayer after spin-coating in the dry film. After the gel domain formation Gb3 lipids preferentially partition in the gel phase, as follows from our experiments with pure DOPC and Gb3 (see Fig. S3†). The exact percentage of Gb3 in DPPC:DOPC gel domains is not known precisely and for the estimation of the surface density of Shiga toxin we use 1% of Gb3. The density of Shiga toxin on the surface of gel domains depends on whether the toxin was added to the membrane above or below the melting point because of differences in the Gb3 diffusion coefficient. The Shiga toxin pentameric B-unit (≈7.7 kDa and diameter ≈ 5.5 nm (ref. 28 and 29)) binds up to 15 Gb3 lipids.30–32 Each monomer has three binding sites (called I, II and III) and most effectively the binding goes through sites I and II, whereas site III has lower affinity.32 Binding also strongly depends on the length of the Gb3 chain and lipid saturation.9,13,33 In the present study we used commercially available porcine Gb3 and for the determination of number of Shiga toxin bound to the membrane surface 15 Gb3 lipids were assumed per subunit. A simple estimate of the number of proteins expected to bind to DPPC:DOPC gel domains results in ≈1300 proteins per 1 μm2 assuming a uniform density of Gb3 everywhere being 1%, 15 Gb3 lipids per Shiga toxin unit and 0.52 nm2 as an area per lipid.34,35 From the AFM data (see Fig. 1) we obtained about 100 of Shiga toxin subunits bound to the gel domain surface per μm2, when Shiga toxin was added at 20 °C and more than 1000 toxins per 1 μm2 for the case, when Shiga toxin was introduced at 60 °C. One order of magnitude difference is attributed to the specific orientation and positioning of Gb3 lipids in the gel domains caused by Shiga toxin; to bind one STxB unit Gb3 lipids should be positioned close enough in a certain pentameric configuration30 that is less probable to exist in a solidified gel domain with low diffusion coefficients.26 When Shiga toxin is added at T > Tm, Gb3 lipids are in the liquid phase and are free to diffuse and adjust their position in order to bind Shiga toxin, which might cluster Gb3 lipids in its vicinity.36 After binding of Shiga toxin to the Gb3 lipids, gel domains were formed containing Shiga toxin and Gb3 lipids. The distribution of Gb3 lipids in gel domains depends, therefore, on the temperature, at which Shiga toxin was added, and Gb3 distribution in turn influences the density of Shiga toxin bound to the gel domain surface.
The texture analysis allows us to say that with available resolution, addition of Shiga toxin to the preformed domains with 1% of Gb3 at 20 °C does not induce measurable changes to the orientation of lipids on a short time scale (see Fig. 3c) for DPPC:DOPC and DSPC:POPC mixtures. It does not happen because the density of Shiga toxin on the membrane surface and Gb3 concentration in gel domains are not sufficient to impose perturbation and the distribution of Gb3 lipids is unchanged. The sample with a higher density of bound Shiga toxin (when the toxin is added above Tm) in contrast exhibits the redistribution of Gb3 lipids and the change of domain shape as follows from Fig. 2 and 3. Note, that the Gb3 concentration is the same in both cases, only the temperature when Shiga toxin was added varies. Lipid orientation, therefore, correlates with the toxin density on the domain surface.
The texture results were analyzed for all studied samples. For four DPPC:DOPC samples presented in Fig. 3 and denoted as a reference sample, the DPPC:DOPC:Gb3 sample, a sample with Shiga toxin added at 20 °C, and a sample with Shiga toxin added at 60 °C the analysis is presented in Fig. 5. The dependence of normalized pixel intensity from Fig. 3versus the c-director angle was plotted as a histogram, where the projection of the Laurdan probe on the substrate plane is called the c-director. The peak number and background level correspond to dominant orientations and alignment quality, respectively. The peak number varies from sample to sample between 3 and 5. The reference sample has 4 peaks and exhibits a high background level in the angle distribution (see Fig. 5a). The sample DPPC:DOPC:Gb3 has 3 peaks and also exhibits a high background level (see Fig. 5b). No specific quantitative change can be distinguished between the DPPC:DOPC:Gb3 sample and the sample with Shiga toxin added at 20 °C as can be seen from Fig. 2b and c. When Shiga toxin was added at 60 °C, at T > Tm, regular lipid texture was observed (see Fig. 3d). A distinct change in the c-director angle distribution can be identified by the peak shape becoming more Gaussian (red dashed line) with the standard deviation σ ≈ 8° and a significant background reduction (see Fig. 5d). Each petal of the gel domain has its own lipid orientation.
 | ||
| Fig. 5 Distribution of lipid c-director angle for domains presented in Fig. 3: (a) 1:1 DPPC:DOPC, (b) 1:1 DPPC:DOPC + 1% of Gb3, (c) 1:1 DPPC:DOPC + 1% of Gb3, STxB was added at 20 °C, (d) 1:1 DPPC:DOPC + 1% of Gb3, STxB was added at 60 °C, Gaussian fit is outlined by the red dashed line. | ||
Lipid texture in the presence of Shiga toxin depends on the temperature, at which the toxin was introduced. When Gb3 lipids can cluster under Shiga toxin freely, the density of Shiga toxin bound to the gel domains is one order of magnitude higher than if the Gb3 lipid position is fixed and can be named as the temperature regulated surface density of Shiga toxin. Enhanced lipid texture and ordering for the sample with high density of Shiga toxin are presumably governed by several factors. One factor is the specific distribution of Gb3 lipids in gel domains due to Shiga toxin binding: Gb3 lipids cluster, tighten the lipid packing and create an internal surface pressure. The effect of the high surface pressure on the long range order in lipid membranes was observed in plain lipid bilayers recently.37 On the other hand it was reported that Gb3 itself condenses packing in lipid monolayers.38 The DMPC:POPC sample with 1% of Gb3 is a good example of Gb3 induced domain compactization. In the case of the DMPC:POPC:Gb3 sample the inversion of the image contrast was registered (see Fig. S2†). The contrast inversion in two-photon images corresponds to the change of lipid tilt: upon addition of 1% of Gb3 lipids to a membrane the lipids inside gel domains have straightened up perpendicularly to the substrate surface, indicating a decrease of the surface area per lipid. This effect demonstrates the compactization of gel domains upon addition of the Gb3 component. However, the packing effect caused by Gb3 lipids is not enough to solely affect lipid organization as can be seen in Fig. 3b, where no significant change of lipid distribution was detected by P2FM for the sample without Shiga toxin. It follows that lipid packing in conjunction with specific Gb3 distribution in gel domains caused by Shiga toxin plays an important role in the formation of long range order.
Another factor that could be responsible for the lipid alignment and crystallization is the chain ordering under the influence of Shiga toxin. This argument arises when we consider the metamorphose in the melting point temperature upon addition of Gb3 and Shiga toxin. Addition of Gb3 suppresses Tm by 2–4 °C for DPPC:DOPC and DSPC:POPC mixtures and it cannot be explained only by simple freezing point depression and is attributed to changed lipid interactions. Upon addition of Shiga toxin at the temperature above liquid to gel phase transition, Tm increases by 2–3 °C. A similar dependence was observed for Cholera toxin bound to DMPC bilayers.25 The increase of the melting point temperature indicated the decrease of the system's entropy, which we attribute to the increased chain ordering.39,40
Cell membranes function either in the liquid ordered or in the liquid disordered phase, where lipid diffusion is enhanced compared to the gel phase. From our results for the case when Shiga toxin was added in the liquid phase (above the chain melting point) we can see the strong effect of Shiga toxin on lipid bilayers, resulting in membrane reorganization and reordering. Therefore, membrane fluidity is an important factor for toxin binding.
IV. Conclusions
We have studied the influence of Shiga toxin on the lipid orientation in bilayers. It was observed for DPPC:DOPC and DSPC:POPC lipid mixtures that, when Shiga toxin was added before the gel domain nucleation, i.e. at the temperature above the phase transition, the lipid alignment was induced and the in-plane lipid angle distribution narrowed. The diffusion and specific distribution of Gb3 lipids are responsible for Shiga toxin binding. This binding leads to redistribution of Gb3 lipids in gel domains that promotes lipid reordering through enhanced lipid packing and chain ordering. The effect observed for Shiga toxin added at temperatures above phase transition correlates with the biological function of the toxin: the ability to reorder and reorganize the membrane might be essential for Shiga toxin to induce endocytic membrane invagination.
V. Materials and methods
A. Materials
The lipids used in the study were 1,2-dioleoyl-sn-glycero-3-phosphocholine (DOPC), 1,2-dipalmitoyl-sn-glycero-3-phosphocholine (DPPC), 1-palmitoyl-2-oleoyl-sn-glycero-3-phosphocholine (POPC), 1,2-dimyristoyl-sn-glycero-3-phosphocholine (DMPC), and 1,2-distearoyl-sn-glycero-3-phosphocholine (DSPC), purchased from Avanti Polar Lipids; porcine globotriaosylceramide (Gb3) was purchased from Matreya LLC. The Shiga toxin B unit (STxB) was supplied by Prof. Ludger Johannes, Institut Curie, UMR144 Curie/CNRS, Paris, France.8 All lipids were dissolved in methanol before sample preparation. All used chemicals were of HPLC grade quality and Milli-Q water was used for the buffer preparation. HEPES buffer (5 mM, 150 mM NaCl), pH7.0 was prepared by mixing HEPES acid, HEPES base and NaCl components. Muscovite mica from Plano GmbH (Germany) was cut into approx. 10 × 10 mm2 pieces, freshly cleaved, and used as a substrate.B. Sample preparation
Dry spin-coated lipid films (DPPC:DOPC with a molar ratio 1:1, DSPC:POPC with a molar ratio 1:2, and DMPC:POPC with a molar ratio 3:1 with 0% and 1% Gb3) on the mica substrate were prepared using stock solutions of 5 mM lipid mixtures containing 0.5% DiD and 0.75% Laurdan probes. A droplet (40 μL) of the prepared lipid solution was applied to the freshly cleaved mica substrate and spun on a Chemat Technology KW-4A spinner at 3000 rpm for 40 s. After that the spinning samples were placed under vacuum for about 20 h to ensure full evaporation of the solvent. After drying the HEPES buffer was added to the sample for hydration, the sample was heated for 2 h at 60 °C (or 70 °C for DSPC:POPC). The spin coated films were hydrated either in a fluid cell for AFM (BioCell, JPK Instruments, AG, Berlin, Germany) or in an Instec TSA02i-JPK liquid cell. At 60 °C for DPPC:DOPC and DMPC:DPPC membranes, and 70 °C for DSPC:POPC membranes, samples were flushed with hot buffer using a pipette to fabricate a bilayer from a multilayered membrane. Samples were monitored by epifluorescence microscopy during the washing procedure. After each flushing the buffer was exchanged 10 times to remove the floating membrane fragments. After that, washing samples were controllably cooled to 20 °C with the cooling rate of 0.5 °C min−1 for DPPC:DOPC and DSPC:POPC samples and 0.04 °C min−1 for DMPC:POPC samples. During cooling the nucleation and growth of gel domains were observed and monitored. The temperature of the melting point, Tm, was assigned to the temperature when gel domains first emerged. After that, cooling samples were left to equilibrate for 30 min. A detailed sample preparation technique can be found in ref. 16, 41 and 42. 0.5 nmol of Shiga toxin B-unit was added either before the cooling process at the temperature above the melting point or after the cooling process was finished at 20 °C, and it was left to bind for 15 min.
C. Microscopy technique
To study the surface morphology of the lipid bilayers an atomic force microscope NanoWizard I(AFM) JPK Instruments, AG, Berlin, Germany was used. A fluorescence microscope, Till Photonics, was used to study the growth and nucleation processes of gel domains in lipid membranes with and without STxB. A ELWD 40× air objective was used, with numerical aperture of 0.60. A polarization two-photon fluorescence microscopy (P2FM) study was performed using a custom built microscope, based on an Olympus IX70 microscope. A 60× water immersion objective with a numerical aperture of 1.2 was used. The excitation source was a femtosecond Ti:Sa laser (Broad Mai Tai XF W25 with a 10 W Millennia pump laser, tunable excitation range of 710–980 nm, Spectra physics, Mountain View, CA, USA) and the working wavelength was 780 nm. A half-wave plate was used to control and rotate light polarization, where rotation of 5° of a half-wave plate corresponds to 10° rotation of the electric field. The emission wavelength of the Laurdan probe for the gel phase was 438 ± 12 nm. Detection was performed with photomultiplier tubes (Hamamatsu H742240).16 The P2FM technique allows the detection of the in-plane lipid orientation under polarized excitation. The direction of the excitation light is parallel to the surface normal and the electric field is linearly polarized along the surface. The Laurdan probe is especially useful here because it aligns itself along the lipid tails.43 The projection of the Laurdan probe on the substrate plane is called the c-director. The rotation of polarized light allows scanning the sample in-plane and extract information about the lipid orientation, i.e. c-director distribution. The study of lipid orientation in the gel domains by the P2FM technique is possible because lipids are inclined to the surface normal.27 The texture analysis of bilayers was carried out based on a custom-developed MATLAB GUI, for more details see ref. 16. AFM and P2FM techniques were carried out at 20 °C after gel domain formation. Fluorescence imaging was performed during the cooling process in order to control gel domain nucleation and growth. All measurements were performed the same day as samples were prepared.
Acknowledgements
The authors would like to thank Memphys Center for Biomembrane Physics for possibility to use the lab facility and Dr Jes Dreier and Dr Jonathan R. Brewer for their help with two-photon microscopy experiments. Financial support by the Villum foundation and the Danish Council for Independent Research (FNU grant no. DFF-1323-00134) is greatly acknowledged.References
- J. Rossy, Y. Ma and K. Gaus, Curr. Opin. Chem. Biol., 2014, 20C, 54–59 CrossRef PubMed.
- C. Lesieur, B. Vécsey-Semjén, L. Abrami, M. Fivaz and F. G. van der Goot, Mol. Membr. Biol., 1997, 14, 45–64 CrossRef CAS.
- M. R. Gonzalez, M. Bischofberger, L. Pernot, F. G. van der Goot and B. Frêche, Cell. Mol. Life Sci., 2008, 65, 493–507 CrossRef CAS PubMed.
- L. Johannes and S. Mayor, Cell, 2010, 142, 507–510 CrossRef CAS PubMed.
- P. Ray and X. Liu, Pediatr. Nephrol., 2001, 16, 823–839 CrossRef CAS.
- S. A. Cilmi, B. J. Karalius, W. Choy, R. N. Smith and J. R. Butterton, J. Infect. Dis., 2006, 194, 1135–1140 CrossRef CAS PubMed.
- J. Alroy, S. Sabnis and J. B. Kopp, J. Am. Soc. Nephrol., 2002, 13, S134–S138 Search PubMed.
- W. Römer, L. Berland, V. Chambon, K. Gaus, B. Windschiegl, D. D. Tenza, M. R. E. Aly, V. Fraisier, J.-C. Florent, D. Perrais, C. Lamaze, G. Raposo, C. Steinem, P. Sens, P. Bassereau, L. Johannes and Others, Nature, 2007, 450, 670–675 CrossRef PubMed.
- B. Windschiegl, A. Orth, W. Römer, L. Berland, B. Stechmann, P. Bassereau, L. Johannes and C. Steinem, PLoS One, 2009, 4, e6238 Search PubMed.
- L. Johannes and C. Lamaze, Traffic, 2002, 3, 443–451 CrossRef CAS.
- M. Jacewicz, H. Clausen, E. Nudelman, A. Donohue-Rolfe and G. Keusch, J. Exp. Med., 1986, 163, 1391–1404 CrossRef CAS.
- C. A. Lingwood, H. Law, S. Richardson, M. Petric, J. L. Brunton, S. De Grandis and M. Karmali, J. Biol. Chem., 1987, 262, 8834–8839 CAS.
- O. M. Schütte, A. Ries, A. Orth, L. J. Patalag, W. Römer, C. Steinem and D. B. Werz, Chem. Sci., 2014, 5, 3104–3114 RSC.
- C. E. Miller, J. Majewski, E. B. Watkins and T. L. Kuhl, Biophys. J., 2008, 95, 629–640 CrossRef CAS PubMed.
- E. B. Watkins, C. E. Miller, J. Majewski and T. L. Kuhl, Proc. Natl. Acad. Sci. U. S. A., 2011, 108, 6975–6980 CrossRef CAS PubMed.
- U. Bernchou, J. Brewer, H. S. Midtiby, J. H. Ipsen, L. A. Bagatolli and A. C. Simonsen, J. Am. Chem. Soc., 2009, 131, 14130–14131 CrossRef CAS PubMed.
- J. Dreier, J. Brewer and A. C. Simonsen, Soft Matter, 2012, 8, 4894 RSC.
- J. Dreier, J. R. Brewer and A. C. Simonsen, J. Phys. Chem. Lett., 2013, 4, 2789–2793 CrossRef CAS.
- D. G. Pina, J. Gómez, E. Villar, L. Johannes and V. L. Shnyrov, Biochemistry, 2003, 42, 9498–9506 CrossRef CAS PubMed.
- C. Schneider, W. Rasband and K. Eliceiri, Nat. Methods, 2012, 9, 671–675 CrossRef CAS.
- J. Dreier, J. Brewer and A. C. Simonsen, Langmuir, 2014, 30, 10678–10685 CrossRef CAS PubMed.
- W. E. Acree and J. S. Chickos, J. Phys. Chem. Ref. Data, 2006, 35, 1051 CrossRef CAS PubMed.
- S. Ali, S. Minchey, A. Janoff and E. Mayhew, Biophys. J., 2000, 78, 246–256 CrossRef CAS.
- P. Atkins and J. de Paula, Physical Chemistry, W. H. Freeman and Company, 2006 Search PubMed.
- M. B. Forstner, C. K. Yee, A. N. Parikh and J. T. Groves, J. Am. Chem. Soc., 2006, 128, 15221–15227 CrossRef CAS PubMed.
- J.-F. Tocanne, L. Dupou-Czanne and A. Lopez, Prog. Lipid Res., 1994, 33, 203–237 CrossRef CAS.
- J. Dreier, Ph.D. thesis, SDU, 2012.
- M. E. Fraser, M. M. Chernaia, Y. V. Kozlov and M. N. James, Nat. Struct. Biol., 1994, 1, 59–64 CrossRef CAS PubMed.
- A. Donohue-Rolfe, D. W. K. Acheson and G. T. Keusch, Rev. Infect. Dis., 1991, 13, S293–S297 CrossRef CAS PubMed.
- H. Ling, A. Boodhoo, B. Hazes, M. D. Cummings, G. D. Armstrong, J. L. Brunton and R. J. Read, Biochemistry, 1998, 37, 1777–1788 CrossRef CAS PubMed.
- H. Ling, N. S. Pannu, A. Boodhoo, G. D. Armstrong, C. G. Clark, J. L. Brunton and R. J. Read, Structure, 2000, 8, 253–264 CrossRef CAS.
- D. J. Bast, L. Banerjee, C. Clark, R. J. Read and J. L. Brunton, Mol. Microbiol., 1999, 32, 953–960 CrossRef CAS.
- S. Arab and C. A. Lingwood, Glycoconjugate J., 1996, 13, 159–166 CrossRef CAS.
- J. Marra and J. Israelachvili, Biochemistry, 1985, 24, 4608–4618 CrossRef CAS.
- J. F. Nagle and S. Tristram-Nagle, Biochim. Biophys. Acta, Rev. Biomembr., 2000, 1469, 159–195 CrossRef CAS.
- D. G. Pina, L. Johannes and M. A. R. B. Castanho, Biochim. Biophys. Acta, 2007, 1768, 628–636 CrossRef CAS PubMed.
- E. B. Watkins, C. E. Miller, W.-P. Liao and T. L. Kuhl, ACS Nano, 2014, 8, 3181–3191 CrossRef CAS PubMed.
- E. B. Watkins, H. Gao, A. J. C. Dennison, N. Chopin, B. Struth, T. Arnold, J.-C. Florent and L. Johannes, Biophys. J., 2014, 107, 1146–1155 CrossRef CAS PubMed.
- Physical Chemistry of Biological Interfaces, ed. A. Baszkin and W. Norde, CRC Press, 1999 Search PubMed.
- C.-H. Chen and D. Guard-Friar, Biopolymers, 1985, 24, 613–622 CrossRef CAS.
- A. C. Simonsen and L. A. Bagatolli, Langmuir, 2004, 20, 9720–9728 CrossRef CAS PubMed.
- A. C. Simonsen, in The Handbook of Modern Biophysics: Biomembrane Frontiers: Nanostructures, Models, and the Design of Life, ed. T. Jue, S. H. Risbud, M. L. Longo and R. Faller, Humana Press/Springer, 2009, vol. 2, pp. 141–169 Search PubMed.
- T. Parasassi, G. De Stasio, A. D'Ubaldo and E. Gratton, Biophys. J., 1990, 57, 1179–1186 CrossRef CAS.
Footnote |
| † Electronic supplementary information (ESI) available. See DOI: 10.1039/c4sm01673d |
| This journal is © The Royal Society of Chemistry 2015 |