Axonal conduction slowing induced by spontaneous bursting activity in cortical neurons cultured in a microtunnel device
Kenta
Shimba
*ab,
Koji
Sakai
a,
Takuya
Isomura
ab,
Kiyoshi
Kotani
c and
Yasuhiko
Jimbo
d
aDepartment of Human and Engineered Environmental Studies, Graduate School of Frontier Sciences, The University of Tokyo, Room 1122, Faculty of Engineering Building 14, 7-3-1 Hongo, Bunkyo-ku, Tokyo 113-8656, Japan. E-mail: shimba@neuorn.t.u-tokyo.ac.jp; Fax: +81-3-5841-1898; Tel: +81-3-5841-1898
bJapan Society for the Promotion of Science, Tokyo, Japan
cResearch Center for Advanced Science and Technology, The University of Tokyo, Tokyo, Japan
dDepartment of Precision Engineering, School of Engineering, The University of Tokyo, Tokyo, Japan
First published on 14th November 2014
Abstract
Recently, axons have been recognized as computational units in neuronal networks that can change their conduction properties along with their firing. However, little is known about the relationship between spontaneous activity and changes in the conduction velocity due to lack of a suitable method. Here, we studied changes in the conduction velocity during bursting activity using a new microfabricated device and the spike sorting method. The propagating action potentials were recorded from axons, which extended through a microtunnel in our device, comprised of a microfabricated chamber and a microelectrode array. By using waveforms recorded from a series of three electrodes along the bottom of a microtunnel, we achieved a sorting accuracy approximately 8.0% higher than that of the conventional one-electrode waveform method. We then demonstrated for the first time that conduction delays increased by 8.0% in action potentials of a mathematically isolated axon during one burst recorded at 10 days in vitro (DIV). Moreover, 79.4% of all clusters showed this conduction slowing during bursting activity at 10 DIV. Finally, we evaluated the days-in-culture dependence of the properties of bursting activity. These results suggest that our method is suitable for evaluating changes in conduction properties induced by spontaneous activity.
Insight, innovation, integrationAxonal computation plays a role in neural information processing. Particularly, changes in conduction velocity can modulate the synchronization of neuronal networks. However, it is unclear whether the spontaneous bursting activity can induce changes in axonal conduction velocity. Here, we developed a culture device having three electrodes crossing the floors of microtunnels at intervals, which allows us to record the axonal propagation of action potentials. An improved spike sorting method was used to achieve a significantly higher sorting accuracy and to extract the parameters of axonal conduction. We demonstrated for the first time conduction slowing induced by spontaneous bursting activity. With our system, it is feasible to study the effect of axonal modulation on the synchronized activity of neuronal networks. |
Introduction
The fundamental building blocks of the central nervous system (CNS) are neural assemblies formed from many neurons interconnected via their axons. Conventionally, axons are thought to be only cables through which the digital impulses of neurons propagate faithfully to other neurons. However, recently computational capabilities of axons have been reported1,2 and there has been remarkable interest in axonal information processing. Axonal computational ability takes two forms: (1) enhancement of synaptic transmission along a specific branch by broadening action potentials and (2) modulation of the timing of action potential arrival at postsynaptic neurons by changing membrane excitability. Modulators of axonal conduction on a short time scale (tens of milliseconds to seconds) are roughly divided into two types. The first is secretions of non-neuronal cells such as astrocytes. Glutamate released from astrocytes near the axon broadened the waveforms of action potentials via AMPA receptors.1 The other type of axonal change comprises alterations in the axonal membrane. Axons can change their ion channel expression, membrane excitability, and conduction velocity in an activity-dependent manner.3–5 In particular, activity-dependent changes in conduction velocity play a crucial role in the functions of neuronal networks because they can modulate neuronal synchronization.Conduction velocity can change spatially and temporally. A complementary metal oxide semiconductor (CMOS)-based microelectrode array (MEA) has previously been used to record axonal action potentials.6 With stimulation-triggered averaging, axonal signals were recorded with high spatial resolution. The CMOS-based MEA enabled us to demonstrate local differences in conduction velocity in a single axon. Axons are known to gradually hyperpolarize in response to repetitive stimulation and their conduction velocity slows down with such changes in membrane potential.7 Furthermore, to prevent excessive hyperpolarization caused by repetitive firing, some types of neurons have hyperpolarization-activated cyclic nucleotide-gated (HCN) channels in their axonal membranes. The hyperpolarization-activated inward current (Ih) due to the HCN channels can compensate for the activity-induced hyperpolarization. The experimental stimulation frequencies were in the same range as neural activity recorded in vivo, suggesting that this conduction slowing should occur spontaneously.7 However, the dynamics of neuronal firing depend on the membrane potential, which is altered by preceding action potentials. Therefore, the hyperpolarization that can be induced by electrical stimulation is not always induced by spontaneous activity. Therefore, to confirm that conduction slowing is a general phenomenon, it must be shown that spontaneous high frequency activity can induce it.
Action potentials propagating along an axon were recorded using a microfabricated device featuring microelectrode-embedded microtunnels.8 In this structure, because of high impedance between the recording and reference electrodes, large-amplitude signals could be recorded and their signal to noise ratio was found to be often hundreds of times larger than that observed under normal conditions in which the electrodes are located in open wells.9,10 Thus, by using these microtunnel devices, spontaneous activity propagating along the axons became recordable, obviating the need for any stimulation. Moreover, the direction and velocity of conduction could be recorded for each conduction event. This is advantageous if one seeks to evaluate the dynamics and the relationship between multiple neuronal sub-networks that are interconnected with microtunnels. For example, by using a microtunnel device, hippocampal sub-region specific neurons dissected from CA1, CA3, and DG could be cultured and connected through microtunnels.11
Generally, multiple axons can enter one microtunnel. In such a situation, a requirement for spike sorting is inevitable to sort a mixed signal into clusters representing individual axons. However, during a form of high-frequency firing called bursting activity, spike sorting is a difficult task because spike waveforms are distorted and some spikes may be overlapped. Thus, in a previous study, bursting activities were excluded from the analysis.12 Consequently, because there has been no suitable method for evaluating the conduction delays of individual axons in spontaneous high frequency firing, very little is known about changes in the conduction of propagating action potentials during bursting activity.
In this study, we evaluated changes in the conduction delays of axons during spontaneous bursting activity in a microtunnel device. An existing spike sorting method was improved to enable it to fit microtunnel-enhanced axonal action potentials. The conduction delays of axons of cortical neurons cultured in our device were evaluated during bursting activity. Finally, days-in-culture-dependent changes in axonal conduction were evaluated.
Materials and methods
Culture device preparation
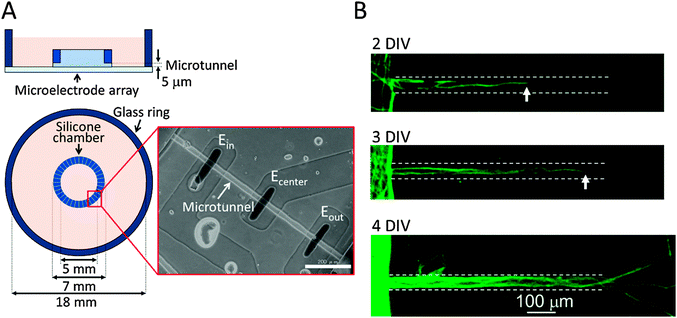
Fig. 1 shows the structure of our culture device, which is composed of a culture chamber and an MEA substrate. The culture chamber has a concentric ring structure with inner and outer diameters of 5 mm and 7 mm, respectively. The inside and outside of the chamber are interconnected with 36 microtunnels whose length, width and height are 750 μm, 30 μm, and 5 μm, respectively. Their narrow structure prevents cell somata from entering the microtunnels so that only neurites enter because of their smaller diameters. The culture chamber's structure thus divides the cultured neurons into two populations that can only interact via axons passing through the microtunnels. Three electrodes are located in the floor of each microtunnel with a 300 μm-long tunnel separation. This configuration of microtunnels and electrodes amplifies neuronal signals as previously demonstrated9 and enables us to record action potentials propagating along the axons.The fabrication procedure for the MEA substrate has been previously described.13 First, a transparent circuit was fabricated by etching an indium-tin-oxide (ITO) sputtered glass substrate (15 ohm square−1, 1500 Å, Sanyo Sinku, Japan) with ITO-02 (Kanto Chemical, Japan). Then an insulation layer was applied by spin-coating OFPR-800LB photoresist (Tokyo Ohka, Japan). The OFPR over the future electrodes and pads for connection to an external amplifier was removed using NMD-3 (Tokyo Ohka, Japan) by photolithography. Finally, the electrodes were platinized electrochemically to decrease impedance.
The culture chamber was fabricated by a method described in our previous paper.14 First, a master mold was developed on a silicon wafer. Five-micrometer-high structures for microtunnels were developed using SU-8 3005 photoresist and then 100 μm-high structures for culture spaces were developed using SU-8 3050 photoresist. Next, de-aerated PDMS (polydimethylsiloxane) prepolymer (10![[thin space (1/6-em)]](https://www.rsc.org/images/entities/char_2009.gif) :
:![[thin space (1/6-em)]](https://www.rsc.org/images/entities/char_2009.gif) 1 mixture of a PDMS precursor and a curing agent; Silpot 184, Dow Corning Toray) was cast in the master mold and cured at 80 °C for 1 h. The cured PDMS was peeled off the mold and punched to form culture areas.
1 mixture of a PDMS precursor and a curing agent; Silpot 184, Dow Corning Toray) was cast in the master mold and cured at 80 °C for 1 h. The cured PDMS was peeled off the mold and punched to form culture areas.
The MEA substrate was coated with 0.1% w/v polyethyleneimine solution dissolved in 25 mM borate buffer (pH 8.4) overnight and rinsed with distilled water before attachment of the culture device. Then the culture chamber was aligned to the MEA in a laminar hood. The culture device was then coated with 20 μg mL−1 laminin in culture medium for 30 min in a CO2 incubator immediately before seeding with neurons.
Cell culture
All procedures were approved by the local ethics committee of the University of Tokyo. Cortical tissues were dissected from E16 ICR mouse embryos (Charles River) and dissociated with 0.25% w/v trypsin (Life Technologies) and 10 μg mL−1 DNase (Sigma Aldrich). The cortical cells were plated onto the culture device at an initial density of 5000 cells per mm2. Cultures were maintained in Neurobasal medium supplemented with 2.5 mM GlutaMAX, a set of B-27 supplements, and 100 U ml−1–100 μg ml−1 penicillin–streptomycin (all from Life Technologies) in a CO2 incubator (5% CO2, 37 °C, humidified air). Half the medium was replaced every three days.Immunofluorescence staining
The cortical neurons were fixed and permeabilized by 4% v/v paraformaldehyde (Wako, Japan) in phosphate buffered saline (PBS) and 0.25% w/v Triton X-100 (Calbiochem) in PBS, respectively. Non-specific staining was blocked by 4% w/v Block Ace (DS-Pharma) in PBS. The cells were then treated with a mouse anti-beta III tubulin antibody (Abcam) diluted in 0.4% w/v Block Ace in PBS (1![[thin space (1/6-em)]](https://www.rsc.org/images/entities/char_2009.gif) :
:![[thin space (1/6-em)]](https://www.rsc.org/images/entities/char_2009.gif) 1000). After washing with PBS three times, cells were incubated in AlexaFluor 488 goat anti-mouse IgG diluted in 0.4% w/v Block Ace in PBS (1
1000). After washing with PBS three times, cells were incubated in AlexaFluor 488 goat anti-mouse IgG diluted in 0.4% w/v Block Ace in PBS (1![[thin space (1/6-em)]](https://www.rsc.org/images/entities/char_2009.gif) :
:![[thin space (1/6-em)]](https://www.rsc.org/images/entities/char_2009.gif) 500, Molecular probes). Fluorescent images were taken using a cooled CCD camera (c8800, Hamamatsu Photonics, Japan) attached to an inverted microscope (IX-71, Olympus).
500, Molecular probes). Fluorescent images were taken using a cooled CCD camera (c8800, Hamamatsu Photonics, Japan) attached to an inverted microscope (IX-71, Olympus).
Data acquisition
Neural activities were recorded using an MEA recording system previously developed by Jimbo et al.13 The extracellular voltages recorded from each electrode were amplified with a gain of 5000 and band-pass filtered at 100–2000 Hz. Signals were then sampled at 50 kHz and recorded. The atmosphere around the culture device was maintained at 37 °C and 5% CO2 content during experiments.Detection of axonal conduction
To analyze the relationship between axonal conduction and network bursts, we recorded the axonal conduction using our culture device. The action potentials of multiple neurons were always recorded from a given microtunnel because many axons were able to enter one microtunnel. Thus, spike sorting was needed to analyze the properties of individual axons. When axonal conduction was successfully recorded, spikes were detected from the three electrodes spaced along the bottom of the same microtunnel with high reliability and low variability of time jitters. We therefore employed a spike sorting method originally developed for tetrode recordings under conditions resembling ours.15 Then clusters that contained propagating action potentials were selected and false positive spikes in each cluster were excluded.First, neural activities were detected from each electrode by assessing the amplitude threshold. Negative peaks beyond the threshold were considered to be neuronal spikes. The thresholds were set to five times the standard deviation of the signal recorded from the electrode at the center of the microtunnel (Ecenter). For each spike detected at Ecenter, 151 data points (3 ms, 50 kHz time resolution; spike time ±75 points) were collected from all electrodes in the same microtunnel to record the spike shape. Since there were three electrodes in the microtunnel, 453 points were saved for each spike.
Second, spike sorting was carried out using Efficient Technology of Spike-sorting (EToS).16 Briefly, a wavelet transform was applied to characterize the features of waveforms saved at each spike. Then, the most variable eight coefficients whose distributions had multiple peaks were extracted from the wavelet coefficients processed using multimodality-weighted principal component analysis (mPCA). To select clustering models and classify the spikes, a variational Bayes algorithm with a Student's t mixture model was run.
Third, to select clusters showing axonal conduction, we used a detection method developed by Bakkum et al. with minor modifications.17 For each cluster, spikes detected within ±8 ms of spike times at Ecenter were saved from the electrodes at the outside (Eout) and inside (Ein) of the microtunnel, respectively. Then the spikes were partitioned into 0.04 ms time windows and spike time histograms were constructed for each electrode. Since clusters containing propagating action potentials show a sharp peak in the histogram because of synchronization of the Ecenter spike, a peak in the histogram beyond a threshold was defined as indicating propagation. For detection purposes, all peaks and valleys of the histogram were detected after smoothing with a Gaussian kernel (kernel size = 31 samples). If the histogram had peaks beyond the threshold, the cluster was considered to contain propagating action potentials. The threshold was set to two times the height of the highest valley around the peak plus 0.5. Only when propagating action potentials were detected from both Ein and Eout the cluster was considered to show axonal conduction. If multiple peaks were detected in the histogram, the peak that contained the largest number of spikes was used.
Finally, contaminating noises (false-positive spikes) were further excluded. The ratio of delay times between Eout and Ecenter to those between Ein and Ecenter was calculated for each conduction event. Only events with ratios between 0.4 and 2.5 were selected for further analysis.
Evaluation of spike sorting accuracy
To evaluate the improvement in the spike sorting efficacy resulting from using waveforms recorded from multiple electrodes, a two-source separation test was performed. Raw data recorded from Ej for 10 min were added to the data recorded from Ei for the same 10 min and spike sorting was carried out. Clusters containing more than 50% of Ei spikes were considered to be Ei clusters and the other clusters were considered to be Ej clusters. The ratio of spikes included in the correct cluster to all spikes was defined as the accuracy of spike sorting. This test was repeated 250 times using different electrode pairs in each of the seven combinations. Data recorded at 15 days in vitro (DIV) were used.Burst detection
Bursting activity in each cluster was defined as spike trains composed of five or more spikes whose interspike intervals were shorter than 500 ms. This threshold was based on a report that unmyelinated hippocampal axons change their conduction properties in response to stimulation at frequencies > 1 Hz.7Statistical analysis
For a comparison of the spike sorting accuracy and age-dependent changes in bursting activity, statistical significance was detected using Welch's and paired t-tests with Bonferroni correction, respectively.Results
Efficacy of spike sorting
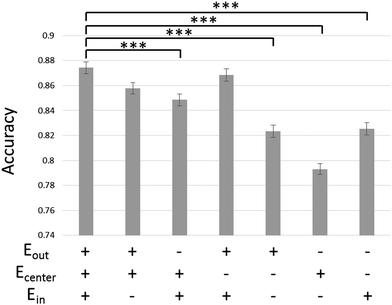
We confirmed the efficacy of the spike sorting method employed in this study. Fig. 2 shows the effect of the electrode set used for spike sorting on the sorting accuracy with mixed spikes. The larger the number of electrodes used, the more accurately the spikes were sorted. When waveforms were extracted from all three electrodes, the mixed spikes were sorted most accurately (accuracy: 0.87). This accuracy is significantly higher than in cases where waveforms were extracted from Ein and Ecenter or from one electrode (p < 0.001). Accuracy was the second highest when waveforms were extracted from Ein and Eout and spike events were detected from Ecenter. The least accurate method was the conventional one, using only Ecenter (accuracy: 0.79).Axonal extension and conduction
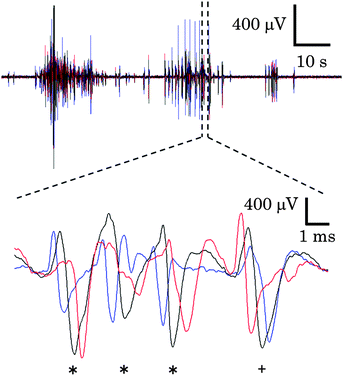
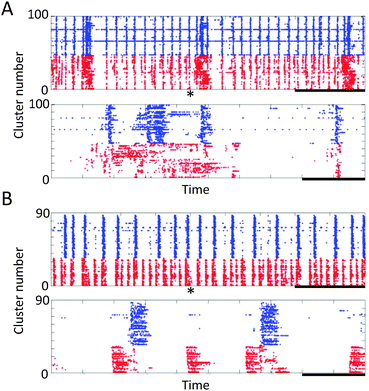
Cortical cells were cultured in the microfabricated device shown in Fig. 1. These cells maintained a healthy shape throughout the experimental period. Fig. 1(B) shows immunofluorescent images of neurites of cortical neurons in the microtunnels. Typically, neurites of cortical neurons entered and passed through the microtunnels two and four days after seeding, respectively.Spontaneous activity was recorded every five days. Fig. 3 shows the representative waveforms recorded from electrodes spaced along the floor of a microtunnel at 10 DIV. Both inward (from Eout to Ein) and outward (from Ein to Eout) conduction events are observed in a given microtunnel (Fig. 3, magnified view). After spike sorting, each cluster gave information about the direction and conduction delay. The conduction delays were 2.19 ± 0.45 ms at 5 DIV and 2.12 ± 0.59 ms at 20 DIV. Since the distance spanned by the electrodes was 600 μm, conduction velocities were calculated to be 0.23 to 0.34 m s−1 at 5 DIV and 0.22 to 0.39 m s−1 at 20 DIV. Fig. 4 shows raster plots of firing at 10 and 20 DIV. Blue and red dots show the outward and inward conduction, respectively. At 5 DIV, almost all bursts show only outward conduction and few bursts show in both directions. At 10 DIV, many bursts show conduction in both directions and super-burst activities comprised of clustered sub-bursts are present. The latter were observed in five out of eight samples. The last sub-burst of each super-burst lasted more than 10 seconds. At 20 DIV, bursts are composed of only inwardly conducted spikes or of conduction in both directions. While conduction in both directions occurred simultaneously at 10 DIV, at 20 DIV the directions of conduction alternated with no pause between.
Changes in conduction during bursting activity
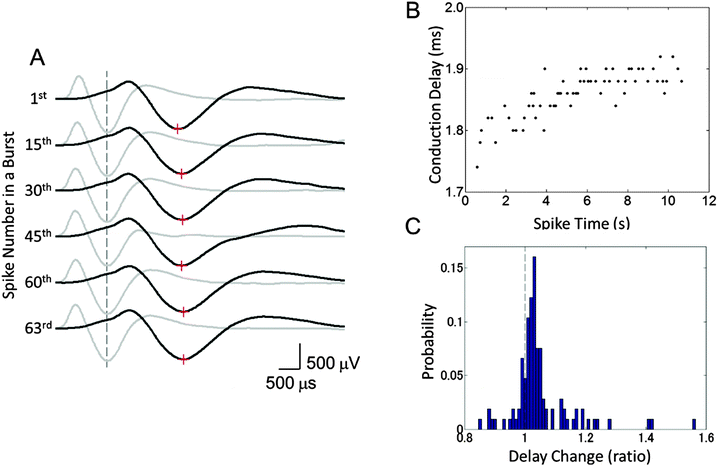
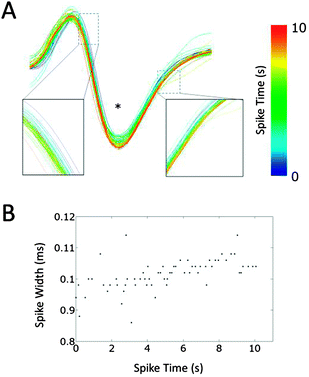
To study the changes in the conduction parameters, we evaluated conduction delays in bursting activity. Fig. 5 shows the changes in conduction delay. While no apparent change in the waveform was observed, the spike latencies between Ein and Eout increased during a burst as shown by red “+” signs in Fig. 5(A). Moreover, positive correlations between the spike time measured from the start of a burst and the conduction delay were observed. In the case of Fig. 5(B), a high positive correlation was observed (r = 0.802, p < 0.0001) and the conduction delay increased by 8.0% during the burst (n = 63 conduction events). We then quantified the change in the delay as the ratio of the conduction delays of the first and last spike in a burst. The delay changes in each cluster were calculated by averaging the associated delay ratios. The peak in the histogram of a mean delay change indicates that the distribution shows an increase in delay time between the first and last spikes (Fig. 5(C)). Delay times increased in 79.4 ± 3.6% of clusters at 10 DIV (mean ± SD, n = 8 samples). In some clusters, spike waveforms widened during a burst. Fig. 6 shows such changes in the waveform recorded from Ecenter of the cluster during the burst shown in Fig. 5(B). Spike widths at half the average peak amplitude were positively correlated with spike times (r = 0.599, p < 0.001), as shown in Fig. 6(B).Age-dependent changes in bursting activity
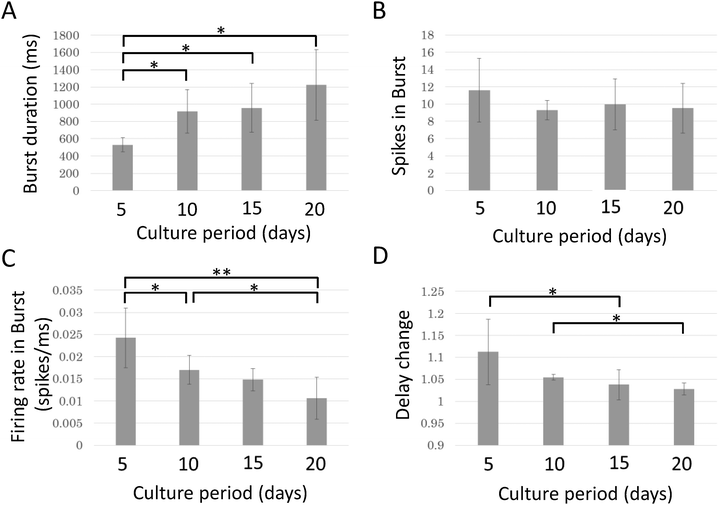
Bursting activity was recorded from all samples (n = 8) during the entire experiment. To evaluate changes in bursting activity during maturation, electrical activity was recorded every five days. Fig. 7 shows the relationship between the culture period and the properties of bursting activity. While the burst duration and spike frequency changed significantly in opposite directions, the spike count per burst was not significantly changed. Burst duration increases with the culture day and a significant increase is observed between 5 DIV and all later days (p < 0.05, paired t-test with Bonferroni correction). Spike frequency in a burst decreases with the culture day and a significant change is observed between 5 DIV and 10 DIV (p < 0.05), 5 DIV and 20 DIV (p < 0.01), and 10 DIV and 20 DIV (p < 0.05). The changes in delay decreased with the culture day. Significant decreases were observed between 5 DIV and 15 DIV and between 10 DIV and 20 DIV (p < 0.05).Discussion
The changes in axonal conduction are thought to have an important role in neural computation. In a previous study, axons were stimulated electrically to evoke responses for evaluation of the parameters of conduction.6,7,17 However, it is not known whether a spontaneous burst can induce conduction slowing. This study demonstrates spontaneous-activity-dependent conduction slowing without the use of electrical stimulation.With spike sorting, we can evaluate action potentials recorded from individual axons during bursting activity. Bursting activity is highly characteristic of cultured neuronal networks, and is reported to have important roles in maturation, signal transduction, and activity-dependent plasticity.18–20 During bursting, spike waveforms are distorted and overlapped with the following spike because of the high-frequency firing. This makes spike sorting difficult. Thus, previous studies on axonal conduction excluded spikes within bursting activity from the analysis of conduction parameters and network activity.8,12 However, we succeeded in evaluating axonal conduction during bursting activity. The main reason may be the spike sorting method we employed. The method originally had a capacity to sort bursting neurons as previously described.16 Moreover, we added further modifications to improve the efficacy of the analysis. First, we used waveforms recorded from multiple electrodes when spike features were extracted. Propagating action potentials recorded from microtunnel-embedded electrodes have information about the direction and propagation delays; this information can be used to sort spikes. In fact, the sorting accuracy significantly increased compared with the conventional method, which extracts features from waveforms recorded from one electrode. Furthermore, because we have considered that the false- negative spikes have not brought much worse effects on results of delay change analysis, we could concentrate on eliminating false-positive spikes, thereby improving the efficiency with which contamination errors were excluded from sorted clusters. These modifications are thought to be important points of our method.
Our method of recording axonal conduction has two main advantages compared with previous methods in the field of axonal conduction study. First, we can evaluate tens of axons simultaneously without any special manipulation. Many studies have used glass pipettes to record intra- or extra-cellular potentials from axons.21,22 In these studies, activities can be recorded from only one axon at a time and steering the pipette requires a high degree of technical skill. In the case of CMOS-MEA recording, pre-experiments using scanning stimulation were required to detect the positions of cell somata and to select recording electrodes.6 In contrast, the culture device herein allows us to record axonal action potentials easily, because axons are guided by the microtunnels and thus aligned on the recording electrodes. Second, we can record the conduction of spontaneous spikes, obviating the need for electrical stimulation. In previous studies, electrical stimulation was required to evoke spikes for axonal conduction measurements.6,7,23 The spike timing of evoked responses can be controlled precisely. However, stimulation strength varies with distance and with the impedance between the neuron and the stimulation electrode. Since it was reported that changes in axonal conduction varied with stimulation strength7 and since it is difficult to stimulate axons with a reproducible strength, this may lead to variation of results between experiments. Thus, with our method, no biases due to the complications of electrical stimulation were introduced into the results.
In the present study, we recorded conduction delays and demonstrated for the first time that conduction delays increased with repetitive firing during spontaneous bursting, suggesting that electrical stimulation is not a necessary requirement to induce conduction slowing, although previous studies had reported that conduction delays increased with repetitive electrical stimulation.7,23 Conduction delays recorded in our device were in the same range as those reported previously using a microtunnel device,8 glass pipettes23 and a CMOS-MEA.8 Thus, our results are consistent with previous reports. The main causative factor of conduction slowing is thought to be hyperpolarization of the axonal membrane. When a neuron fires with relatively high frequency, the intracellular Na+ concentration increases, and subsequent Na–K ATPase activation hyperpolarizes the axonal membrane. We think that this hyperpolarization is a possible reason for the conduction slowing recorded from our device.
Alternatively, a main factor contributing to our conduction slowing results could be related not to the previously described hyperpolarization, but to the microtunnel environment specifically. Many axons entered each microtunnel and the amount of medium around the axons was restricted. Thus, when the neurons fired synchronously, extracellular K+ concentration in the microtunnel was expected to have increased rapidly. A high concentration of extracellular K+ induces Na+ channel inactivation. In unmyelinated sensory axons innervating cranial meninges, it was reported that Na+ channel inactivation was a main regulator of activity-dependent slowing of conduction velocity.5 However, the above inactivation primarily affected the slowly-inactivating Na+ channels (Nav1.8),5,21 which are expressed in peripheral nerves predominantly.24 The Na+ channels expressed in the CNS, Nav1.2, Nav1.3, and Nav1.6, have fast dynamics in activation and inactivation.24 Thus, these channels are expected to recover from inactivation during the interspike intervals. Taken together, the evidence suggests that conduction slowing of cortical neuron axons is independent of Na+ channel inactivation induced by the high concentration of extracellular K+.
Our spike waveforms widened during bursting activity in some clusters. As axonal conduction slows, the current source is near the recording electrodes for longer periods. While it may be reasonable to expect a broadening of waveforms with an increase of conduction delays, extended current source exposure is not the only possible cause. For example, both astrocyte-derived glutamate release and inactivation of voltage-gated K+ channels can produce broadening of action potential waveforms.1,25 Thus, further studies using computational simulation of equivalent circuits, or simultaneous recording of intra- and extra-cellular potentials, are needed to clarify this phenomenon.
The firing frequency during bursting activity decreased with the number of days in culture. However, previous studies showed that intraburst frequency did not change significantly from 14 DIV to 18 DIV.19,26 This difference is thought to be due to differences in the connections between the recorded neuron and the other nearby neurons. Usually, neurons cultured on MEAs form recurrent feedback connections with the surrounding local neurons as previously described.27 However, our recorded neurons, whose axons extended >750 μm through microtunnels, cannot form recurrent networks with local neurons. This difference may change the spontaneous activity, which is shaped by synaptic inputs from other neurons. Because spontaneous activity is an important modulator of the development and firing properties of cultured neurons,28 there is a possibility that the firing properties of our recorded neurons were different from those of others under the same culture conditions. Further studies will be needed to characterize the relationship between the network structure and the firing properties.
Delay ratios decreased with days in culture. The possible reasons for this decrease include developmental changes in activities of the neuronal network, and changes in the expression of some proteins in specific neurons. At the network level, the neuronal firing frequency within each burst decreased in steps with an increase in days in culture. Thus, it is reasonably possible that the decreased firing frequency resulted in the decrease in the delay change. In addition, developmental changes in Ih expression in individual neurons could be an additional reason. A previous study showed that the activation rate of Ih in the hippocampal pyramidal neurons increased as the neurons matured.29 An increase in the activation rate of Ih would effectively compensate the activity-dependent hyperpolarization and decrease the amount of conduction slowing due to a burst. Further research on ZD7288, an inhibitor of Ih, should help to test this hypothesis. It will also be interesting to study the extent to which the change in delay ratios affects synchronized activity within the neuronal network. Once the relationship between neuronal maturation and changes in the delay ratio is clearly described, our device will be able to evaluate neuronal maturation based on conduction properties.
Conclusions
Previous studies involving the application of electrical stimulation to axons pointed to changes in the axonal conduction properties as having an important role in neuronal information processing. However, little is known as to whether spontaneous high-frequency firing induces changes in axonal conduction. Here, we developed a culture device to record axonal spike propagation and a method to sort signals recorded from multiple axons into clusters representing individual axons. After spike sorting, each conduction event had information on the direction and speed of conduction. Thus, we could evaluate interactions between sub-networks during network bursts. We then demonstrated that spontaneous bursting activity can induce conduction slowing. Additionally, the firing rate during bursts and the change ratio in conduction delays decreased as the cultured neurons matured. These results suggest that our device and method have potential for evaluating network interactions, activity-dependent changes in axonal conduction, and developmental changes in cultured neurons, based on recordings of axonal conduction.Acknowledgements
This work was partially supported by the Japan Society for the Promotion of Science (JSPS) through a Grant-in-Aid for JSPS Fellows (25-4923) and Grants-in-Aid for Scientific Research (23240065 and 24650249).Notes and references
- T. Sasaki, N. Matsuki and Y. Ikegaya, Science, 2011, 331, 599–601 CrossRef CAS PubMed.
- D. Bucher and J. M. Goaillard, Prog. Neurobiol., 2011, 94, 307–346 CrossRef PubMed.
- Y. Fan, D. Fricker, D. H. Brager, X. Chen, H. C. Lu, R. A. Chitwood and D. Johnston, Nat. Neurosci., 2005, 8, 1542–1551 CrossRef CAS PubMed.
- M. Shin and D. M. Chetkovich, J. Biol. Chem., 2007, 282, 33168–33180 CrossRef CAS PubMed.
- R. De Col, K. Messlinger and R. W. Carr, J. Physiol., 2008, 586, 1089–1103 CrossRef CAS PubMed.
- D. J. Bakkum, U. Frey, M. Radivojevic, T. L. Russell, J. Muller, M. Fiscella, H. Takahashi and A. Hierlemann, Nat. Commun., 2013, 4, 2181 Search PubMed.
- A. F. Soleng, K. Chiu and M. Raastad, J. Physiol., 2003, 552, 459–470 CrossRef CAS PubMed.
- B. J. Dworak and B. C. Wheeler, Lab Chip, 2009, 9, 404–410 RSC.
- L. Pan, S. Alagapan, E. Franca, T. DeMarse, G. J. Brewer and B. C. Wheeler, IEEE Trans. Neural Syst. Rehabil. Eng., 2013, 22, 453–459 CrossRef PubMed.
- L. Wang, M. Riss, J. O. Buitrago and E. Claverol-Tinture, J. Neural Eng., 2012, 9, 026010 CrossRef PubMed.
- G. J. Brewer, M. D. Boehler, S. Leondopulos, L. Pan, S. Alagapan, T. B. Demarse and B. C. Wheeler, Front. Neural Circuits, 2013, 7, 165 Search PubMed.
- L. Pan, S. Alagapan, E. Franca, G. J. Brewer and B. C. Wheeler, J. Neural Eng., 2011, 8, 046031 CrossRef PubMed.
- Y. Jimbo, N. Kasai, K. Torimitsu, T. Tateno and H. P. Robinson, IEEE Trans. Biomed. Eng., 2003, 50, 241–248 CrossRef PubMed.
- A. Takeuchi, K. Shimba, M. Mori, Y. Takayama, H. Moriguchi, K. Kotani, J. K. Lee, M. Noshiro and Y. Jimbo, Integr. Biol., 2012, 4, 1532–1539 RSC.
- T. Takekawa, Y. Isomura and T. Fukai, Eur. J. Neurosci., 2010, 31, 263–272 CrossRef PubMed.
- T. Takekawa, Y. Isomura and T. Fukai, Front. Neuroinform., 2012, 6, 5 Search PubMed.
- D. J. Bakkum, Z. C. Chao and S. M. Potter, PLoS One, 2008, 3, e2088 Search PubMed.
- E. Maeda, H. P. Robinson and A. Kawana, J. Neurosci., 1995, 15, 6834–6845 CAS.
- M. Chiappalone, M. Bove, A. Vato, M. Tedesco and S. Martinoia, Brain Res., 2006, 1093, 41–53 CrossRef CAS PubMed.
- J. J. Sun, W. Kilb and H. J. Luhmann, Eur. J. Neurosci., 2010, 32, 1289–1299 CrossRef PubMed.
- R. De Col, K. Messlinger and R. W. Carr, J. Physiol., 2012, 590, 725–736 CAS.
- J. P. Meeks and S. Mennerick, J. Neurophysiol., 2007, 97, 3460–3472 CrossRef PubMed.
- M. Raastad and G. M. Shepherd, J. Physiol., 2003, 548, 745–752 CrossRef CAS PubMed.
- J. S. Trimmer and K. J. Rhodes, Annu. Rev. Physiol., 2004, 66, 477–519 CrossRef CAS PubMed.
- J. R. Geiger and P. Jonas, Neuron, 2000, 28, 927–939 CrossRef CAS.
- E. Biffi, A. Menegon, F. Piraino, A. Pedrocchi, G. B. Fiore and M. Rasponi, Biotechnol. Bioeng., 2012, 109, 166–175 CrossRef CAS PubMed.
- C. Y. Dong, D. Shin, S. Joo, Y. Nam and K. H. Cho, Bioinformatics, 2012, 28, 2146–2153 CrossRef CAS PubMed.
- H. Kamioka, E. Maeda, Y. Jimbo, H. P. Robinson and A. Kawana, Neurosci. Lett., 1996, 206, 109–112 CrossRef CAS.
- D. V. Vasilyev and M. E. Barish, J. Neurosci., 2002, 22, 8992–9004 CAS.
| This journal is © The Royal Society of Chemistry 2015 |

