 Open Access Article
High-resolution insights into the early stages of silver nucleation and growth†
Cornelia M.
Völkle
,
Denis
Gebauer
* and
Helmut
Cölfen
*
Department of Chemistry, Physical Chemistry, University of Konstanz, Universitätsstr. 10, D-78457 Konstanz, Germany. E-mail: denis.gebauer@uni-konstanz.de; helmut.coelfen@uni-konstanz.de
First published on 12th January 2015
Abstract
Nucleation and growth of silver nanoparticles has already been investigated with various experimental and computational tools. However, owing to inherent problems associated with the analytical characterization of nucleation processes, there is a general lack of experimental data regarding the earliest precursors and smallest Ag(0) clusters. Here, we address this problem by the application of Synthetic Boundary Crystallization Ultracentrifugation, utilizing a multiwavelength detector for the first time, complemented by a specialized titration assay. These techniques shed new light on silver nanoparticle precursors existing in the pre-nucleation regime, and the initially nucleated ensemble of nanoclusters. For the first time, we present experimental data of UV-Vis spectra for fractionated silver clusters. These allow for unsurpassed insights into the sequence of nucleation and early growth species as well as their optical properties.
Introduction
Nucleation is the fundamental event in many phase transitions, and thus is of great importance for various reactions and processes.1 Thanks to its great relevance, nucleation has been intensely studied for more than 100 years. The first quantitative concept to describe nucleation phenomena, Classical Nucleation Theory (CNT), was based upon the ideas of Gibbs,2 and was eventually finalized by the pioneering work of Becker and Döring.3 This theory has been modified over the years,4–7 and alternative approaches have also been introduced, which do not rely upon any assumptions about the homogeneity of nuclei, and do not require the division of their free energy into a bulk and a surface contribution.8 Later, the so-called two-step mechanism was introduced to explain the considerable deviations between experimentally determined nucleation rates and CNT predictions, especially close to the critical point.9–11 Recently, the view on nucleation has been further extended by the so-called pre-nucleation cluster pathway.12 In this case, thermodynamically stable (with respect to monomers in solution) pre-nucleation clusters serve as fundamental solute precursors to phase-separated entities via a nanoscopic liquid–liquid separation event.All of these different pathways require experimental verification, and detailed molecular insights are needed to expand and refine the models—or even refute their applicability. This is, by principle, very difficult to obtain for nucleation processes, since the relevant species are small, highly dynamic, and also transient. A further complication arises from the fact that nucleation processes can be very fast, owing to the high levels of supersaturation that are, for example, crucial to achieve narrow particle size distributions,13 and thus challenge existing analytical methods.
Currently, one of the best-suited techniques to time-resolved studies of nucleation, as well as early particle growth processes, is X-ray scattering. With synchrotron light sources, a time resolution of 200 ms can be achieved.14 More recently, reaction times down to 100 ms could be studied even on a standard laboratory instrument, by taking advantage of a continuous flow experiment.15 With a stopped-flow device and synchrotron radiation, species can be observed in time intervals as short as 10 ms after mixing.16 The same time resolution was achieved in a reaction tube and free reactant jet, coupled to a rapid mixing device; this was achieved by observing the reaction products with SAXS and TEM, after shooting the grids through the free jet and rapidly cooling in liquid nitrogen.17 Here, the formation of liquid droplets was observed during the very early stages, strongly suggesting that CNT is not applicable in this case. With a free jet set-up coupled to laminar mixing, the time resolution at a synchrotron beamline could be increased by an impressive factor of 100, allowing the observation of reaction times as short as 75–100 μs.18,19 This time resolution seems to be the current limit of SAXS or WAXS experimentation at synchrotron beamlines. While this is certainly sufficient to observe early growth species, and perhaps also nucleation phenomena for many systems, SAXS gives only average particle size and shape information, which can be complemented by crystal structure information via simultaneous WAXS investigation. Nevertheless, it is certainly desirable to observe a sequence of growth species from pre-nucleation species and intermediates to larger nanoparticles, and to determine their composition and properties. While a free reactant jet is in principle highly suitable for such analyses – since it allows different analytical methods to be applied along the jet and thus the capture of species formed at different times even if they require long integration times – it is not always possible to capture the nucleation and early growth species, due to the current time resolution limit of approximately 75–100 μs.18,19
To circumvent this problem, an analytical ultracentrifuge (AUC) method was developed, called “Synthetic Boundary Crystallization Ultracentrifugation”.20,21 The idea behind this approach is to bring two reactants together in a so-called synthetic boundary cell. Speeding up the ultracentrifuge rotor leads to the formation of a sharp reaction boundary. If the overlaid reactant is added in tiny amounts, the chemical reaction that leads to the nucleation and growth of particles will occur only for a short time. Following this, particle growth of nucleated species is no longer possible, because they leave the reaction zone and become subject to fractionation, and characterization, in the AUC.20,21 AUC was shown to provide very high particle size resolution in the Ångström range, even for complex mixtures and sizes down to below 1 nm, with ultimate statistical relevance, as every particle of the ensemble is detected.22,23 Moreover, it proved to be one of the very few reliable techniques to quantitatively characterize pre-nucleation clusters,24 since electron microscopy is limited by insufficient statistical sample sizes, leading to fundamental issues when it comes to the statistically significant detection of very small and rare species in solution.25–27 Mass spectrometry, on the other hand, has the inherent problem that it is not clear per se if the detected species truly reflect the solution composition, since some species might be problematic to transfer into the gas phase, or might be even generated artificially upon ionization.25
The advantage of Synthetic Boundary Crystallization Ultracentrifugation is that the technique works especially well for fast reacting systems, where the chemical reaction is finished within the first seconds of the experiment; this therefore provides well-defined initial conditions for the nucleation of the ensemble of sedimenting particles and the startpoint of sedimentation. However, the advantage of high resolution analysis could not be utilized at the time when the method was first introduced, due to the lack of suitable methods for the evaluation of the experiments.20,21 Nowadays, powerful evaluation programs like SEDFIT28 and ULTRASCAN29 are available, and provided that the reaction is fast, a static sample (i.e. the particles do not grow upon fractionation) will be investigated, which can be evaluated with algorithms developed for band sedimentation experiments.30 These yield the sedimentation coefficient distribution – even corrected for diffusion broadening – that can be converted into the corresponding particle size distribution.
In addition, a UV-Vis multiwavelength detector has been developed within the so-called open AUC project,31 which allows for the measurement of UV-Vis spectra at each point in the AUC cell, and thus combines the excellent size resolution of AUC with spectral information for each of the detected species.32–34 Such a detector is especially promising for the investigation of the nucleation and early growth species of semiconductors and metal nanoparticles, because of their size-dependent optical and electronic properties.35,36 This would allow for particle size analyses with Ångström resolution, yielding the UV-Vis absorption spectra for each identified species, potentially even starting in the pre-nucleation regime.
The nucleation of silver nanoparticles has been investigated with a series of different techniques.37 The reduction of silver salts by sodium borohydride and tetraoctylammonium acetate was first studied utilizing UV-Vis spectrometry by Rothenberg et al.38 Henglein et al. studied the γ-irradiation induced formation of colloidal silver from AgClO4 solutions, where citrate was used as a stabilizer.39 They postulated two growth mechanisms that depend on the citrate concentration: the condensation of small silver clusters (type-I), and the reduction of Ag+ on the particles via radical-to-particle electron transfer (type-II). When the concentration of citrate was too low, coalescence of the formed silver nanoparticles occurred. Harada and Katagiri studied the photo-reduction of AgClO4 solutions in the presence of poly(N-vinyl-2-pyrrolidone) (PVP) utilizing SAXS.40 They found that the rate of nucleation strongly depends on the initial metal concentration, which is at least qualitatively consistent with CNT, whereas the early growth processes can be subdivided into three distinct stages; reduction–nucleation, Ostwald ripening, and particle coalescence. The nucleation process yielded small particles of ∼2.5 nm average radius, whereas the ripening and coalescence processes led to particles of ∼11.5 nm average radius. All of this is, in principle, consistent with the Finke–Watzky mechanism;41 this stipulates that the first step in metal nanocluster formation via reduction with hydrogen is slow continuous nucleation, and the second step is autocatalytic surface growth, which is not controlled by diffusion. This mechanism provides several key predictions, such as a certain predominance of magic-number size nanoclusters, or the use of face-selective capping agents as a way to block the autocatalytic surface growth and, thereby, to provide a means to develop tailor-made nanoclusters. Richards et al. utilized a combination of TEM and UV-Vis techniques to study the growth of Ag-nanoparticles from a [(PPh3)2Ag(O2CC13H27)] precursor.42 They found that classical nucleation and growth, aggregative nucleation and growth, and Ostwald ripening occurred in consecutive experimental stages, whereby growth was dominated by the aggregative regime. Takesue et al. utilized time resolved SAXS experimentation (0.18 ms time resolution) to elucidate the aggregation-based formation of silver nanoparticles from silver nitrate solutions, and corroborated the existence of three distinct stages.43 Their analyses showed that the silver nanoparticles were essentially formed from precursors that related to a peak diameter of ∼0.7 nm, which corresponds to the size of the Ag13 cluster. The study suggests that this magic cluster is most likely the elementary growth unit which agglomerates to form silver nanoparticles. Woehl et al. studied the electron-beam induced nucleation of silver nanoparticles from silver nitrate solutions by means of liquid-cell TEM, whereby the electron beam current could be used to control the growth mechanism.44 Low electron beam dosage led to reaction-limited growth (yielding faceted nanocrystals), but high electron beam dosage resulted in diffusion-limited growth that yielded spherical crystals. Quantitative assessments of nucleation and growth rates suggested that the results could be explained by classical models. A gradual colour change from clear to yellow in silver nitrate solutions with sodium acrylate in the presence of NaOH was observed by Nishimura et al., who utilized UV-Vis and XAFS spectroscopy to study the process of Ag-nanoparticle formation in detail.45 They found that the nucleation rate dramatically increased with an increase in NaOH concentration, and developed an alternative reaction channel via Ag+ species (such as Ag(OH)x). These can serve as intermediates in the reduction, increasing the formation rate of the nanoparticles in the presence of NaOH. Investigating the formation of silver nanoparticles from silver perchlorate, with and without PVP, by means of time-resolved in situ SAXS, Polte et al. found a four-stage mechanism.15 Without PVP, within the first 100 ms, particles of ∼1 nm size almost instantaneously formed, followed by a rapid increase in their number. The particles then grew to an average size of 4.6 nm, whereas the particle number decreased. Again, this is consistent with a growth mechanism via aggregation of nanoscale entities. With PVP, the precursor particles of ∼1 nm in size could be stabilized significantly before coalescence occurred.
All of the above shows that there is a general lack of high-resolution data, especially for the formation of the first tiny nanoparticle – or rather nanocluster – precursors, which appear to be fundamental growth units for subsequent Ag nanoparticle growth.43 The motivation of the present study is to apply, for the first time, a multiwavelength UV-Vis detection in Synthetic Boundary Ultracentrifugation experiments, and obtain unsurpassed information about the nucleation and early particle growth stages of silver nanoparticles. This model system has been chosen because it is literature known (see above), and allows for the combination of AUC experiments with titration experiments, which have proven to be very successful for the characterization of the early stages of CaCO3 precipitation.24
The titration assay is based upon the slow mixing of precursor solutions, and the continuous generation of supersaturation, which eventually leads to precipitation. This process can be followed in situ by parallel pH titration and ion potential measurements, and can be further complemented by redox potential and conductivity measurements.46 The titration assay thus provides quantitative information on free and bound precursor species, which can be used to characterize pre- and post-nucleation solute associates using suitable thermodynamic models of speciation.24 Moreover, the experimentation can be used to identify, categorize and quantify the multiple effects of additives during precipitation, and can thus provide novel insights into the mechanisms of additive-mediated crystallization control.47,48
Materials and methods
Analytical ultracentrifugation
For the AUC measurements, an UV-Vis multiwavelength AUC has been used. The setup has been described in the literature.32–34 The rotor speed was 60![[thin space (1/6-em)]](https://www.rsc.org/images/entities/char_2009.gif) 000 rpm. All experiments were performed at 25 °C. In this work, we applied a 12 mm charcoal filled Epon double-sector synthetic boundary cell of the Vinograd type. This cell utilizes the centrifugal force to form a reaction boundary by layering NaBH4 (ρ = 0.9974 g mL−1) in a reservoir onto a more dense AgNO3/CTAB solution (ρ = 1.1044 g mL−1) in one sector of a double-sector centrepiece via a thin capillary. The two solutions build a sharp boundary, at which the reaction takes place. Although the diffusion rate of the ions is very high, the fast reaction to an insoluble Ag cluster/nanoparticle43 prevents extensive diffusion broadening of the boundary.
000 rpm. All experiments were performed at 25 °C. In this work, we applied a 12 mm charcoal filled Epon double-sector synthetic boundary cell of the Vinograd type. This cell utilizes the centrifugal force to form a reaction boundary by layering NaBH4 (ρ = 0.9974 g mL−1) in a reservoir onto a more dense AgNO3/CTAB solution (ρ = 1.1044 g mL−1) in one sector of a double-sector centrepiece via a thin capillary. The two solutions build a sharp boundary, at which the reaction takes place. Although the diffusion rate of the ions is very high, the fast reaction to an insoluble Ag cluster/nanoparticle43 prevents extensive diffusion broadening of the boundary.
The synthesis of the silver nanoparticles is roughly based on the recipe of Pal et al.49 6 μL 10 mM NaBH4 were layered onto 290 μL 0.1 mM AgNO3 and 0.05 M CTAB solution in a 1![[thin space (1/6-em)]](https://www.rsc.org/images/entities/char_2009.gif) :
:![[thin space (1/6-em)]](https://www.rsc.org/images/entities/char_2009.gif) 1 mixture of H2O and D2O. AgNO3 was purchased from Roth, NaBH4 from Merck and cetyltrimethylammoniumbromid (CTAB) from Acros. All chemicals were used as received.
1 mixture of H2O and D2O. AgNO3 was purchased from Roth, NaBH4 from Merck and cetyltrimethylammoniumbromid (CTAB) from Acros. All chemicals were used as received.
The data were evaluated using the SEDFIT software Vers. 14.1 and the models Analytical Zone Centrifugation ls-g*(s) called g(s) in the following for simplicity, and Analytical Zone Centrifugation c(s). The partial specific volume of the sample was taken as 0.0953 mL g−1.
Titration assay
The principal set-up is described in detail elsewhere.46 Here, we utilized an Ag-redox electrode (Metrohm, no. 6.0430.100), and a double junction pH probe (Metrohm, no. 6.0269.100), where the outer reference electrolyte was 3 M KNO3. Solutions for the titration were based on a recipe by Doty et al.50 In brief, an aqueous 2.5 mM AgNO3 and 2.5 mM trisodium citrate hydrate solution was dosed into 50 mL freshly prepared 10 mM NaBH4 solution at a rate of 0.1 mL min−1. The pH of the NaBH4 solution was initially around ∼9.8, was then set to pH 9.73, and was subsequently held constant by automatic counter-titration with 0.25 M HNO3. The experimental duration was 1500 s.For the measurements of UV-Vis spectra, a 600 μL sample was drawn after 148 s, 370 s, 570 s, 750 s, 940 s, 1130 s, 1320 s and 1500 s of silver addition, and was directly measured each time on a Varian Cary 50 UV-Vis spectrometer, utilizing the software Varian UV Scan Version 3.99(339). In another set of experiments, 600 μL samples were drawn after 100 s, 160 s, 190 s, 220 s, 250 s, 280 s, 310 s, 340 s, 370 s, 400 s, 500 s, 600 s, 800 s, 1000 s, 1200 s and 1400 s of silver addition, and were measured accordingly, but after the titration assay was finished (ripening for ca. 10–15 minutes for each sample).
AgNO3 was purchased from Roth, NaBH4 from Merck and trisodium citratehydrate from Sigma-Aldrich. All chemicals were used as received.
Results and discussion
Analytical ultracentrifugation
Overlaying of a NaBH4 solution onto the AgNO3 solution upon speeding up the ultracentrifuge rotor leads to an immediate reaction and the formation of Ag nanoparticles. Due to the fast reaction, particles can be generated and analysed at the very early stages, which is immediately obvious from their very slow sedimentation, even at the AUC’s maximum speed of 60![[thin space (1/6-em)]](https://www.rsc.org/images/entities/char_2009.gif) 000 rpm (corresponding to a centrifugal field strength of 280
000 rpm (corresponding to a centrifugal field strength of 280![[thin space (1/6-em)]](https://www.rsc.org/images/entities/char_2009.gif) 000g). The raw data show that the sedimentation is so slow that the peak in the sedimentation profile spreads out completely, thanks to diffusion broadening, before the sample has reached the bottom of the AUC cell (Fig. 1 and Movie SI 1†).
000g). The raw data show that the sedimentation is so slow that the peak in the sedimentation profile spreads out completely, thanks to diffusion broadening, before the sample has reached the bottom of the AUC cell (Fig. 1 and Movie SI 1†).
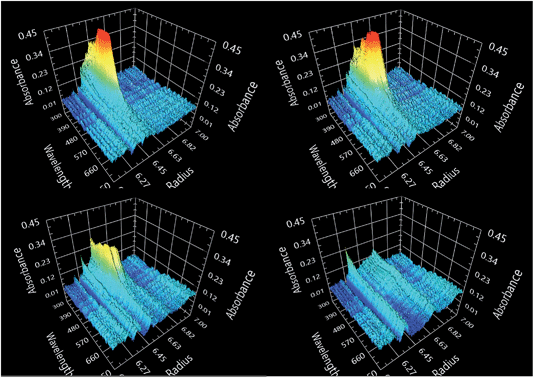 | ||
| Fig. 1 Experimental scans taken at different times of sedimentation (top left 13.7 min, top right 38.8 min, bottom left 80.9 min, bottom right 169.1 min). See also Movie SI 1.† | ||
Following the sedimentation profile peak intensity evolution with time (Fig. 2), the intensity increases during the first 6 scans (red scans in Fig. 2). This indicates that the amount of reducing agent was still slightly too high, so it was only used up completely after 617 seconds, due to the need for ion diffusion for further reaction, despite the very fast reduction in the ms time range.43 Therefore, these scans were excluded from further evaluation of the sedimentation coefficient distribution, as this requires static conditions for the sample, which were only reached after 617 seconds. Although the relevant ion diffusion coefficients are 1.6 × 10⁻¹⁰ m2 s−1 (Ag+)51 and 8.4 × 10⁻¹⁰ m2 s−1 (BH4−),52 which would correspond to diffusion ranges of ca. 0.75 mm resp. 1.8 mm after 617 s, the reaction boundary still does not spread significantly, as a result of the opposite diffusion direction of the reacting ions and the immediate reaction.
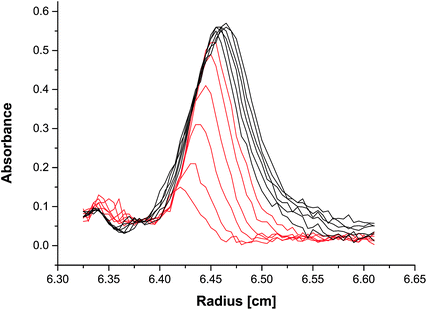 | ||
| Fig. 2 Experimental radial absorption scans at 450 nm after the NaBH4 solution was overlaid over the AgNO3 solution. A slight movement of the reaction boundary towards the cell bottom can be observed as a result of the ca. 2-times faster BH4− diffusion as compared to Ag+.51,52 | ||
The sedimentation coefficient distribution g(s) confirms the slow sedimentation of the nanoparticles, showing a maximum of 0.92 S (Fig. 3). After correcting the distribution for peak broadening due to diffusion, much finer details of the sedimentation coefficient distribution can be observed, indicating the presence of eight species in the mixture. Since the model-free calculated g(s) envelopes the diffusion-corrected c(s), the diffusion-corrected distribution is relevant.
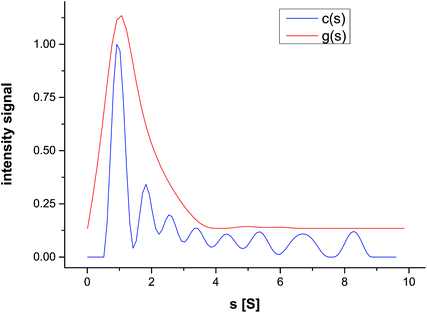 | ||
| Fig. 3 Sedimentation coefficient distribution g(s) and the diffusion broadening-corrected distribution c(s), for silver nanoparticles formed in a CTAB solution. | ||
The sedimentation coefficient s can be converted to the particle diameter d using a modified form of the Svedberg equation valid for hard spheres:
 | (1) |
The problem with this conversion is that the particle density is typically unknown – especially for very small particles, or clusters, where the stabilizer shell contributes significantly to the particle density. Therefore, the density has to be estimated by applying a core–shell model, with the core having the bulk silver density of 10.49 g mL−1 and the shell having the density of CTAB (0.50 g mL−1). This approach yields particle-size dependent densities.53 For these calculations, the thickness of the shell is very important – much more than the density of the surface layer. This is beneficial, since the density of a surface layer consisting of solvent and surfactant is not precisely known.53
We have performed a calculation of the particle size distribution, assuming a CTAB double layer with a thickness of the stretched CTAB molecule of 1.89 nm (Table 1). It becomes immediately obvious that very small species were detected in the performed AUC experiment. The very small particle size further confirms that the reaction leading to Ag(0) formation was definitely finished, and that the species, which were detected, no longer grew during the sedimentation experiment, at least after 617 seconds. Otherwise, much larger particle sizes would have been detected, since time-resolved synchrotron XRD has revealed nanoparticle sizes >5 nm already after 1 ms after reactant mixing.43
| Sedimentation coefficient (s) | Particle Ag-core size with CTAB layer (nm) | Particle size for neat silver particles (nm) |
|---|---|---|
| 0.9 | 1.38 | 0.40 |
| 1.8 | 1.50 | 0.56 |
| 2.5 | 1.58 | 0.66 |
| 3.3 | 1.66 | 0.76 |
| 4.4 | 1.76 | 0.86 |
| 5.4 | 1.86 | 0.96 |
| 6.7 | 1.96 | 1.06 |
| 8.3 | 2.08 | 1.18 |
However, it appears unrealistic that a continuous CTAB layer coats nanoparticles as small as 1.5–5 nm. Therefore, this calculation is certainly a limiting case, that does not reflect reality particularly well. The other extreme case is to assume that no CTAB stabilizer adsorbs on the very early-formed particles. In this case, the density of silver can be used directly as the particles' density. This particle size distribution is shown in Fig. 4. The real particle density will then be somewhere in between these two extremes, which gives us the possibility of determining a realistic particle size range for each of the 8 detected species.
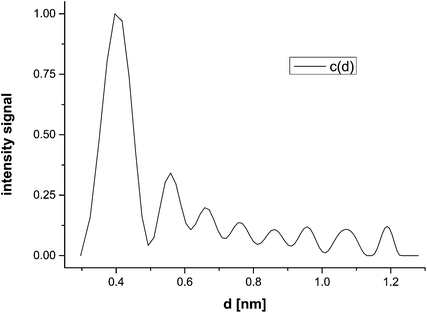 | ||
| Fig. 4 Particle size distribution of silver nanoparticles formed in a CTAB solution calculated with the bulk density of silver. The presented particle sizes are those of the silver core. | ||
The range of particle sizes determined for the eight detected species between the two particle density extremes is rather large in terms of relative deviations (Table 1). However, when considering the absolute deviations resulting from the two limiting cases of realistic densities, it is obvious that the resolution between the detected species is in the Ångström range.
It is certainly realistic to assume that the stabilizer shell is, unlike the CTAB bilayer, very small, and therefore the particle core sizes should be closer to that for the uncoated silver than to the CTAB coated nanoparticles. Certainly, hydration layers will play a role, but adding a monolayer of water to the nanoparticles leaves the calculated particle size virtually unchanged (data not shown). Making this assumption, we can preliminarily allocate literature known species to the species detected in the AUC experiment.
It has been suggested that Ag as well as Au clusters grow as icosahedra, representing thermodynamically preferable states.54 Therefore, the first fully completed silver icosahedron is the Ag13 cluster of 0.7 nm diameter (diameter Ag(0) 0.288 nm; Ag(I) 0.252 nm).37 The second full-shell silver icosahedron, Ag55, is 1.2 nm in diameter.37 Unfortunately, although we can detect the particle sizes with Ångström resolution, the unknown particle density still creates a certain level of uncertainty, so that the direct identification of distinct species is not yet directly possible with the data in Table 1.
However, due to the unique possibilities of the multiwavelength detector, which can often already provide important information on samples directly from the experimental raw data,55,56 we can try to allocate the UV-Vis spectra of the eight detected species in Fig. 4. Currently, SEDFIT28,30 allows for the evaluation of synthetic boundary experiments but does not yet allow for evaluation of multiwavelength data, and so far ULTRASCAN57 only has commonly available routines for multiwavelength evaluation of boundary sedimentation runs. This currently hinders us in directly allocating a spectrum to a certain nanoparticle size in the diffusion corrected particle size distribution c(d).
However, we can rearrange the equation for the calculation of sedimentation coefficient s from the boundary position r at a certain time:
| r = rmesω2t | (2) |
This allows for the allocation of UV-Vis spectra taken at a location r corresponding to a scan time t for a given sedimentation coefficient of one of the eight species in Fig. 3. It is therefore possible to obtain one UV-Vis spectrum for each scan. Since a number of scans were taken, several UV-Vis spectra can be averaged, improving the data quality. The overlay of these scans is shown in Fig. 5 for all eight species. We notice two absorption maxima for the smallest species at 400 and 450 nm. The maximum at 400 nm decreases for the next three larger species until it vanishes completely, while the 450 nm peak slightly but continuously blue-shifts from 451 nm to 443 nm with increasing particle size.
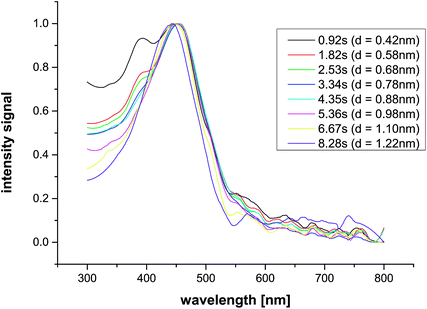 | ||
| Fig. 5 Overlay of UV-Vis scans calculated according to eqn (2) for silver nanoparticles for all species. The particle size is given including a water monolayer. | ||
It must be noted that these spectra are still affected by neighbouring species in the sedimenting boundary, because a diffusion correction of the radial and spectral range is not yet possible for synthetic boundary experiments. However, since the sedimentation transport prevails over diffusion transport with time, due to the t1/2 dependence of mean displacement by diffusion, averaging the scans – especially those at later experimental times – sharpens out the spectra for the species identified in the particle size distribution.
Titration assay
In order to complement the AUC analyses, we have investigated the early stages of Ag-nanoparticle formation, utilizing a titration assay. In brief, 2.5 mM aqueous AgNO3 solution was dosed at a constant rate of 0.1 mL min−1 into 50 mL aqueous 10 mM NaBH4, where 2.5 mM citrate was present as a capping agent in the silver solution. A direct conceptual transfer of the AUC experiment was unfortunately not possible, owing to the rather low solubility of CTAB at room temperature. This did not matter that much in the AUC experiments; the low solubility of CTAB is a problem in the titration assay, as these experiments take a while, and so the CTAB precipitates. The AUC experiments are faster and require a 25 times smaller AgNO3 concentration than the titrations. Therefore, in the AUC experiments, CTAB typically does not precipitate.In order to avoid precipitation of the CTAB capping agent in the titration experiments, and any possible interference with the early stages of Ag precipitation, we utilized citrate instead (note that citrate does not act as a reduction agent in the case of silver).39
The pH of the sodium borohydride solution was kept constant at pH 9.73 ± 0.05 using 0.25 M HNO3 in an automatic counter-titration. On one hand, this is necessary, owing to the continuous decomposition of borohydride, NaBH4 + 4H2O → NaB(OH)4 + 4H2↑, which produces hydroxide ions according to B(OH)4− ⇌ B(OH)3 + OH−.
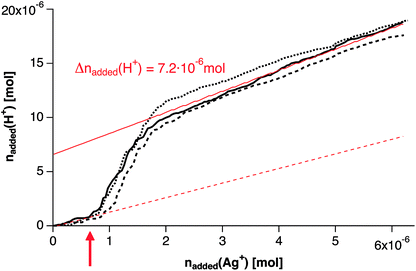
However, on the other hand, there is a sudden increase in the HNO3 titration upon the continuous addition of the silver solution (Fig. 6, red arrow), while maintaining a constant pH of 9.73 ± 0.05. The curves are well reproducible, and show a distinct increase in the titration rate when 7–8 × 10⁻⁷ mol Ag+ have been added, indicating a sudden release of base in the system (the pH offset before and after this event is <0.02 pH units). Considering the chemistry of silver(I) reduction by borohydride, 2Ag+ + 2BH4− → 2Ag(0) + B2H6 + H2↑ and B2H6 + 6H2O → 2B(OH)3 + 6H2↑, and given the weak Lewis acidity of boric acid, this observation cannot be explained by a sudden reduction of Ag+ at this point (red arrow, Fig. 6). Quite the contrary; reduction of Ag+ by BH4− is expected to lead to a minor decrease in pH, due to the generation of boric acid.
Considering the signal of the redox electrode (Fig. 7A), we cannot detect any significant changes that would not directly correlate with the minute changes in pH (Fig. 7B). This suggests that Ag(I) reduction cannot be detected within experimental accuracy throughout the experiment. Furthermore, any decrease in pH due to Ag(I) reduction by BH4− is likely to be concealed by the continuous decomposition of NaBH4 (see above). Consequently, the redox reactions alone cannot explain the distinct release of base after the addition of ca. 7–8 × 10⁻⁷ mol Ag+ to 50 mL 10 mM NaBH4 solution (red arrows in Fig. 6 and 7).
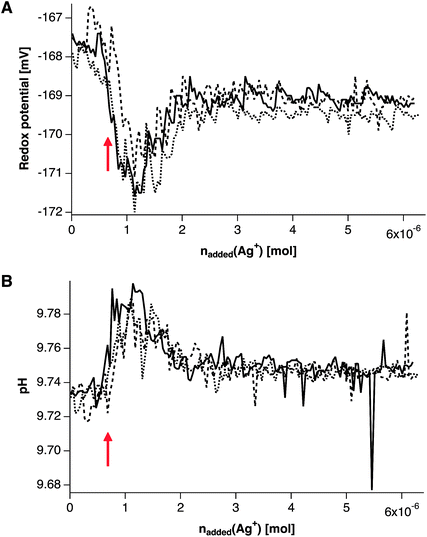 | ||
| Fig. 7 Redox potential (A) and pH (B) upon continuous addition of Ag+ to 50 mL 10 mM sodium borohydride solution. Three independent repetitions are shown, (continuous, dashed, and dotted black lines, according to Fig. 6). The pH constancy is maintained within ±0.05 pH units (B), whereas the changes in redox potential are due to the concurrent minute pH changes within experimental accuracy. Red arrows indicate the nucleation point as in Fig. 6. For explanation see text. | ||
UV-Vis spectra drawn from samples from the titration assay at different times are shown in Fig. 8, which highlight that a distinct change occurs upon crossing this characteristic point. Before the obvious sudden release of base (which occurs at an added amount of 0.62 μmol Ag+, black spectra in Fig. 8), there is no shoulder at the onset of the water absorption band at ∼250 nm, and the peak at ∼394 nm is absent. Directly after the characteristic event (at an added amount of 1.5 μmol Ag+, red spectra in Fig. 8), a shoulder develops at around 210 nm, and the peak at ∼395 nm steadily increases upon further addition of silver, indicative of the generation of more and more silver nanoparticles. Altogether, we can conclude that the characteristic event of base release (red arrows in Fig. 6 and 7) corresponds to the nucleation event of metallic silver nanoparticles. It remains unclear whether or not there is a sudden onset of the redox reaction, but our data clearly shows a sudden release of base.
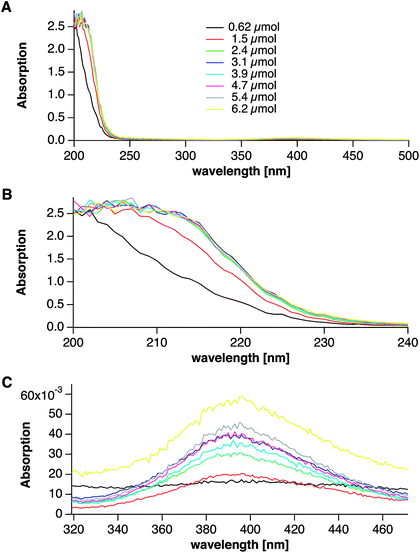 | ||
| Fig. 8 UV-Vis spectra directly measured after solutions were drawn at different times from the titration assay. The respective amounts of substance quoted in the legend (A, overview) correspond to the added amounts of Ag+ at the time of sampling. The spectra were collected directly after the samples were drawn, and ripening effects do occur (see Fig. 9). B and C show magnified spectral regions. For explanation see text. | ||
When the solutions are allowed to ripen for ca. 25 minutes, the spectra of the samples drawn at different times throughout the experiment no longer differ with regard to the absorption at ∼250 nm (Fig. 9A). This suggests that all states are critically metastable, with induction times on the order of minutes. However, the continuous increase in the intensity of the absorption peak at ∼395 nm shows that more and more silver nanoparticles are formed when an increasing amount of silver has been added (Fig. 9B). Within experimental accuracy, we cannot detect any shift in this absorption band during the experimental duration.
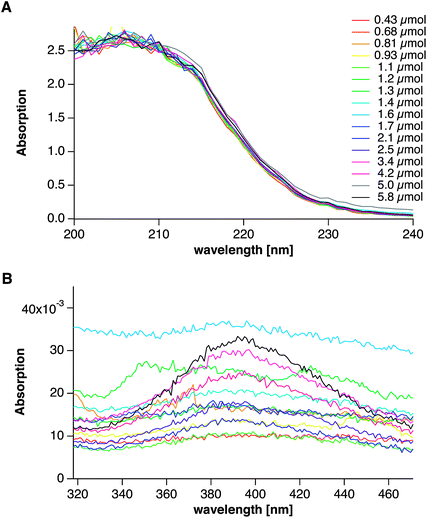 | ||
| Fig. 9 UV-Vis spectra of solutions drawn at different times from the titration assay and allowed to ripen for ca. 10–15 minutes prior to measurement. The respective amounts of substance quoted in the legend correspond to the added amounts of Ag+ at the time of sampling. A and B correspond to the spectral regions shown in Fig. 8B and C, respectively. | ||
In any case, the titration data provide evidence that there is a distinct pre-nucleation regime, and show that the transformation of pre-nucleation precursors towards nucleated silver(0) clusters/nanoparticles leads to a distinct generation of free base. In our experiments, this occurs at an overall silver concentration of ∼20 μM, whereas basic species released from an amount of 0.7–0.8 μmol silver ions – and/or atoms – require neutralization by ca. 7 μmol H+ (Fig. 6, red arrow). This may be explained by the formation of alternative Ag+ species within the silver precursor solution, as well as upon addition of the silver solution to the borohydride solution. These may be Ag(OH)x as suggested by Nishimura et al.45 Thus, significant amounts of hydroxide ions may be released from nucleation precursors upon the nucleation of silver(0) clusters and nanoparticles. However, the release of bound citrate molecules upon nucleation cannot be excluded, and likely contributes to the increased counter-titration rate. Thus, determination of the average composition of Ag-pre-nucleation species requires further experiments, e.g. employing silver ion-specific electrodes, and varying the capping agent concentration. In addition, future AUC experiments may provide insight into the sizes of these species, and whether they may or may not relate to highly dynamic pre-nucleation clusters, which are observed in an increasing number of systems.12
Conclusions
The titration assay shows that the nucleation of metallic silver nanoparticles/clusters is preceded by a distinct pre-nucleation stage, which involves silver species bound to OH− (ref. 45) and most likely citrate ions. The redox state of silver species bound within these precursors remains currently unknown, however. It is a matter of speculation as to whether the structural form of these pre-nucleation species relates to highly dynamic chain-like assemblies, as suggested for calcium carbonate and phosphate pre-nucleation clusters.58 In analogy to the pre-nucleation cluster pathway,12 internal condensation of such precursors could underlie the event of phase separation, and be accompanied by a sudden release of distinct amounts of base, most likely OH−, and citrate. This event occurs at minor overall silver concentrations in NaBH4, showing that the nucleation of metallic silver is virtually instantaneous in the Synthetic Boundary Crystallization Ultracentrifugation experiment discussed herein. Thus, the titration assay provides new insights, especially into the very early (pre-)nucleation stages of silver nanoparticle/cluster formation. Future experiments will be designed to characterize these precursors, with respect to composition and size, in more detail.The multiwavelength AUC experimentation allows the identification of different spectra for 8 distinct species formed upon virtually instantaneous nucleation in the reactive boundary zone (Fig. 3). However, the differences between the spectra are not very pronounced, since they have not (yet) been corrected for the diffusion of neighbouring species. Diffusion correction is at present only possible for the radius domain, yielding c(s).28 Thus, the hydrodynamic information has Ångström resolution, but not yet the corresponding spectra; this is a future task for the open AUC project.31
Extraction of spectra from the multiwavelength scans (Fig. 5) shows that the nanoparticle/cluster species exhibit UV-Vis absorption maxima at ∼400 nm and ∼450 nm. This shows that the AUC experimentation can be utilized to extract UV-Vis spectra of defined Ag nanoclusters. This allows quantitative investigations into the effects of ligands and additives on size-dependent UV-Vis spectra, which could be complemented by ab initio modelling and simulation approaches in the future, potentially yielding novel insights into quantum effects.
The detected absorption maxima are typical for silver nanoclusters and nanoparticles. However, it must be noted that the interface of the Ag nanoparticles, the surrounding phase, and the type and quantity of the capping agent have profound effects on absorption maxima, as small changes in the electronic properties of the surrounding medium lead to strong peak shifts.59 Hence, the UV-Vis spectra from the titration assay (citrate-capped) cannot be directly compared to those from the multiwavelength AUC experimentation (CTAB-capped). A 400 nm absorption peak was reported for Ag5 and Ag9 mixtures in water;60 although the capping agent differs, this may be the early species also observed in the AUC and titration experiments. This comparison, albeit with differing capping agents, suggests the occurrence of Ag5 and Ag9 clusters in both titrations and AUC experimentation. Regarding the evaluation of the derived sedimentation coefficients with respect to particle sizes, this in turn suggests that no CTAB is adsorbed on the very small Ag clusters. Instead, calculation of the particle size, taking into account the density effect of a single water hydration layer, appears most realistic for the very small species detected. Assuming spherical particles and cubic dense sphere packing allows the calculation of the corresponding atom numbers for each of the species (Table 2). The absence of any CTAB layer on small Ag clusters may be crucial to explain aggregative growth regimes.
| Sedimentation coefficient (s) | Particle core size with water layer (nm) | Atoms |
|---|---|---|
| 0.9 | 0.42 | 1–2 |
| 1.8 | 0.58 | 4 |
| 2.5 | 0.68 | 7 |
| 3.3 | 0.78 | 11 |
| 4.4 | 0.88 | 15 |
| 5.4 | 0.98 | 21 |
| 6.7 | 1.10 | 30 |
| 8.3 | 1.22 | 41 |
The derived atom numbers are very small, underpinning the idea that the earliest species formed upon nucleation have been detected. The smallest and most abundant species appears to be a single atom of Ag(0), or linear nanoclusters consisting of Ag3, which may not be unambiguously differentiated given the uncertainty of particle densities. Larger clusters appear to form from this basic unit, whereas we cannot detect Ag13-mediated growth, or a preferable cluster of this size assuming spherical particles. However, the thermodynamically preferable icosahedral Ag13 (0.7 nm) and Ag55 (1.2 nm)37 could be also allocated to the 2.5 s resp. 8.3 s species.
However, the formation of silver nanoclusters is clearly kinetically controlled during the initial stages investigated here, which does not necessarily lead to the formation of thermodynamically preferable states.61 Sizes seem to be defined from AUC but so far, no distinct correlation to a particle structure/size is possible due to the unknown particle density.
Within the notions of CNT, the very small sizes of silver clusters suggest that the size of the critical nucleus is already close to n = 1 at very low silver concentrations, and the barrier to phase separation observed in the titration experiments cannot be immediately rationalized. However, the occurrence of alternative silver pre-nucleation precursors could give rise to barriers within the notion of a pre-nucleation cluster pathway towards silver nanoparticles. Thus, silver nucleation in aqueous solution may be another example for phase separation via pre-nucleation clusters.
Acknowledgements
DG is a Research Fellow of the Zukunftskolleg of the University of Konstanz, and is supported by the Fonds der Chemischen Industrie. We acknowledge funding within the NSF-DFG Materials World Network (GE 2278/6-1; CO 194/12-1).Notes and references
- D. Kashchiev, Nucleation: Basic Theory with Applications, Butterworth-Heinemann, Oxford, 2000 Search PubMed.
- J. W. Gibbs, Trans. Conn. Acad. Arts Sci., 1876, 3, 108–248 Search PubMed.
- R. Becker and W. Döring, Ann. Phys., 1935, 24, 719–752 CrossRef CAS PubMed.
- J. Frenkel, J. Chem. Phys., 1939, 7, 538–547 CrossRef PubMed.
- J. B. Zeldovich, Acta Physicochim. URSS, 1943, 18, 1–22 Search PubMed.
- A. Dillmann and G. E. A. Meier, Chem. Phys. Lett., 1989, 160, 71–74 CrossRef CAS.
- I. J. Ford, A. Laaksonen and M. Kulmala, J. Chem. Phys., 1993, 99, 764–765 CrossRef CAS PubMed.
- J. W. Cahn and J. E. Hilliard, J. Chem. Phys., 1959, 31, 688–699 CrossRef CAS PubMed.
- P. R. tenWolde and D. Frenkel, Science, 1997, 277, 1975–1978 CrossRef CAS.
- P. G. Vekilov, Cryst. Growth Des., 2004, 4, 671–685 CAS.
- P. G. Vekilov, Nanoscale, 2010, 2, 2346–2357 RSC.
- D. Gebauer, M. Kellermeier, J. D. Gale, L. Bergström and H. Cölfen, Chem. Soc. Rev., 2014, 43, 2348–2371 RSC.
- V. K. Lamer and R. H. Dinegar, J. Am. Chem. Soc., 1950, 72, 4847–4854 CrossRef CAS.
- T. Narayanan, O. Diat and P. Bosecke, Nucl. Instrum. Methods Phys. Res., Sect. A, 2001, 467, 1005–1009 CrossRef.
- J. Polte, R. Erler, A. F. Thunemann, S. Sokolov, T. T. Ahner, K. Rademann, F. Emmerling and R. Kraehnert, ACS Nano, 2010, 4, 1076–1082 CrossRef CAS PubMed.
- J. Bolze, D. Pontoni, M. Ballauff, T. Narayanan and H. Cölfen, J. Colloid Interface Sci., 2004, 277, 84–94 CrossRef CAS PubMed.
- H. Haberkorn, D. Franke, T. Frechen, W. Goesele and J. Rieger, J. Colloid Interface Sci., 2003, 259, 112–126 CrossRef CAS.
- B. Marmiroli, G. Grenci, F. Cacho-Nerin, B. Sartori, E. Ferrari, P. Laggner, L. Businaro and H. Amenitsch, Lab Chip, 2009, 9, 2063–2069 RSC.
- B. Marmiroli, G. Grenci, F. Cacho-Nerin, B. Sartori, P. Laggner, L. Businaro and H. Amenitsch, Nucl. Instrum. Methods Phys. Res., Sect. B, 2010, 268, 329–333 CrossRef CAS PubMed.
- L. Börger and H. Cölfen, Prog. Colloid Polym. Sci., 1999, 113, 23–28 Search PubMed.
- L. Börger, H. Cölfen and M. Antonietti, Colloids Surf., A, 2000, 163, 29–38 CrossRef.
- H. Cölfen and T. Pauck, Colloid Polym. Sci., 1997, 275, 175–180 Search PubMed.
- H. Cölfen, H. Schnablegger, A. Fischer, F. C. Jentoft, G. Weinberg and R. Schlogl, Langmuir, 2002, 18, 3500–3509 CrossRef.
- D. Gebauer, A. Völkel and H. Cölfen, Science, 2008, 322, 1819–1822 CrossRef CAS PubMed.
- M. Kellermeier, R. Rosenberg, A. Moise, U. Anders, M. Przybylski and H. Cölfen, Faraday Discuss., 2012, 159, 23–45 RSC.
- E. M. Pouget, P. H. H. Bomans, J. Goos, P. M. Frederik, G. de With and N. Sommerdijk, Science, 2009, 323, 1455–1458 CrossRef CAS PubMed.
- H. Lange, Part. Part. Syst. Charact., 1995, 12, 148–157 CrossRef CAS PubMed.
- P. Schuck, Biophys. J., 2000, 78, 1606–1619 CrossRef CAS.
- B. Demeler, T. L. Nguyen, G. E. Gorbet, V. Schirf, E. H. Brookes, P. Mulvaney, A. O. El-Ballouli, J. Pan, O. M. Bakr, A. K. Demeler, B. I. H. Uribe, N. Bhattarai and R. L. Whetten, Anal. Chem., 2014, 86, 7688–7695 CrossRef CAS PubMed.
- P. Schuck, http://www.analyticalultracentrifugation.com/default.htm, 2014.
- H. Cölfen, T. M. Laue, W. Wohlleben, K. Schilling, E. Karabudak, B. W. Langhorst, E. Brookes, B. Dubbs, D. Zollars, M. Rocco and B. Demeler, Eur. Biophys. J., 2010, 39, 347–359 CrossRef PubMed.
- S. K. Bhattacharyya, P. Maciejewska, L. Börger, M. Stadler, A. M. Gülsün, H. B. Cicek and H. Cölfen, Prog. Colloid Polym. Sci., 2006, 131, 9–22 CAS.
- H. M. Strauss, E. Karabudak, S. Bhattacharyya, A. Kretzschmar, W. Wohlleben and H. Cölfen, Colloid Polym. Sci., 2008, 286, 121–128 CAS.
- J. Walter, K. Lohr, E. Karabudak, W. Reis, J. Mikhael, W. Peukert, W. Wohlleben and H. Cölfen, ACS Nano, 2014, 8, 8871–8886 CrossRef CAS PubMed.
- Y. Wang and N. Herron, J. Phys. Chem., 1991, 95, 525–532 CrossRef CAS.
- W. P. Halperin, Rev. Mod. Phys., 1986, 58, 533–606 CrossRef CAS.
- N. T. K. Thanh, N. Maclean and S. Mahiddine, Chem. Rev., 2014, 114, 7610–7630 CrossRef CAS PubMed.
- J. Wang, H. F. M. Boelens, M. B. Thathagar and G. Rothenberg, ChemPhysChem, 2004, 5, 93–98 CrossRef CAS PubMed.
- A. Henglein and M. Giersig, J. Phys. Chem. B, 1999, 103, 9533–9539 CrossRef CAS.
- M. Harada and E. Katagiri, Langmuir, 2010, 26, 17896–17905 CrossRef CAS PubMed.
- M. A. Watzky and R. G. Finke, J. Am. Chem. Soc., 1997, 119, 10382–10400 CrossRef CAS.
- V. N. Richards, N. P. Rath and W. E. Buhro, Chem. Mater., 2010, 22, 3556–3567 CrossRef CAS.
- M. Takesue, T. Tomura, M. Yamada, K. Hata, S. Kuwamoto and T. Yonezawa, J. Am. Chem. Soc., 2011, 133, 14164–14167 CrossRef CAS PubMed.
- T. J. Woehl, J. E. Evans, L. Arslan, W. D. Ristenpart and N. D. Browning, ACS Nano, 2012, 6, 8599–8610 CrossRef CAS PubMed.
- S. Nishimura, D. Mott, A. Takagaki, S. Maenosono and K. Ebitani, Phys. Chem. Chem. Phys., 2011, 13, 9335–9343 RSC.
- M. Kellermeier, H. Cölfen and D. Gebauer, in Research Methods in Biomineralization Science, ed. J. J. D. Yoreo, 2013, vol. 532, pp. 45–69 Search PubMed.
- D. Gebauer, H. Cölfen, A. Verch and M. Antonietti, Adv. Mater., 2009, 21, 435–439 CrossRef CAS PubMed.
- A. Verch, D. Gebauer, M. Antonietti and H. Cölfen, Phys. Chem. Chem. Phys., 2011, 13, 16811–16820 RSC.
- T. Pal, T. K. Sau and N. R. Jana, Langmuir, 1997, 13, 1481–1485 CrossRef CAS.
- R. C. Doty, T. R. Tshikhudo, M. Brust and D. G. Fernig, Chem. Mater., 2005, 17, 4630–4635 CrossRef CAS.
- R. R. Johnston and M. Spiro, J. Phys. Chem., 1967, 71, 3784–3790 CrossRef CAS.
- H. P. Mo and T. C. Pochapsky, J. Phys. Chem. B, 1997, 101, 4485–4486 CrossRef CAS.
- J. A. Jamison, K. M. Krueger, C. T. Yavuz, J. T. Mayo, D. LeCrone, J. J. Redden and V. L. Colvin, ACS Nano, 2008, 2, 311–319 CrossRef CAS PubMed.
- G. Schmid, Chem. Soc. Rev., 2008, 37, 1909–1930 RSC.
- E. Karabudak, C. Backes, F. Hauke, C. D. Schmidt, H. Cölfen, A. Hirsch and W. Wohlleben, ChemPhysChem, 2010, 11, 3224–3227 CrossRef CAS PubMed.
- E. Karabudak, W. Wohlleben and H. Cölfen, Eur. Biophys. J., 2010, 39, 397–403 CrossRef CAS PubMed.
- B. Demeler, http://www.ultrascan.uthscsa.edu/, 2014.
- R. Demichelis, P. Raiteri, J. D. Gale, D. Quigley and D. Gebauer, Nat. Commun., 2011, 2, 590 CrossRef PubMed.
- M. Farrag, M. Thamer, M. Tschurl, T. Burgi and U. Heiz, J. Phys. Chem. C, 2012, 116, 8034–8043 CAS.
- A. Ledo-Suarez, J. Rivas, C. F. Rodriguez-Abreu, M. J. Rodriguez, E. Pastor, A. Hernandez-Creus, S. B. Oseroff and M. A. Lopez-Quintela, Angew. Chem., Int. Ed., 2007, 46, 8823–8827 CrossRef CAS PubMed.
- W. W. Laxson and R. G. Finke, J. Am. Chem. Soc., 2014, 136, 17601–17615 CrossRef CAS PubMed.
Footnote |
| † Electronic supplementary information (ESI) available: Movie showing the sedimentation in the AUC, which is presented as snapshots in Fig. 1. See DOI: 10.1039/c4fd00269e |
| This journal is © The Royal Society of Chemistry 2015 |

