 Open Access Article
Creative Commons Attribution 3.0 Unported Licence
Towards an understanding of the nucleation of alpha-para amino benzoic acid from ethanolic solutions: a multi-scale approach
D.
Toroz
*,
I.
Rosbottom
,
T. D.
Turner
,
D. M. C.
Corzo
,
R. B.
Hammond
,
X.
Lai
and
K. J.
Roberts
Institute of Particle Science and Engineering and Institute of Process, Research and Development, School of Chemical and Process Engineering, University of Leeds, Leeds, LS2 9JT, UK
First published on 29th April 2015
Abstract
The molecular assembly and subsequent nucleation of para-amino benzoic acid (PABA) from ethanolic solutions is probed using a multi-scale and multi-technique approach. This is applied by examining and interrelating information regarding the molecular, solution-state, cluster, solid-state and surface structures to understand why the alpha form of PABA is crystallised in preference to its low temperature beta form. Calculations suggest that conformational changes within the solute molecule play little or no role in directing the nucleation of either the alpha or beta crystal forms. Combined ab initio and molecular dynamics calculations of the stability of small clusters in solution suggests that the hydrogen-bonded carboxylic acid dimers, present in the alpha structure, are the most stable in solution and play a major role in the self-assembly and polymorphic expression of the alpha form in ethanol in preference to the beta form. These calculations are in good agreement with X-ray small-angle scattering analysis which reveals the presence of PABA clusters in ethanol which are consistent with the size and shape of a carboxylic acid dimer. SAXS studies also reveal the presence of larger cluster structures in a size range 10–40 nm which appear to grow, perhaps reflecting a change in the balance between monomers and dimers within the solution during the nucleation process. The results of crystallisation-kinetics experiments indicate an instantaneous nucleation mechanism where the number of instantaneously nucleated crystallites is calculated to be 1360–660 nuclei per ml and the subsequent growth is found to be only rate limited by diffusion of the growth unit to the crystallite surface. A linear dependence of growth rate with respect to supersaturation is observed for the (0 1 −1) capping face, which is associated with strong π–π stacking interactions. This is consistent with a solid-on-solid mechanism associated with surface roughened growth and concomitant poor lattice-perfection. Conversely, the side (1 0 −1) surface has a growth mechanism consistent with a 2D nucleation birth and spread mechanism. Hence, these mechanisms result in very fast growth along the b-axis and the needle-like morphology that is observed for alpha-PABA.
1 Introduction
Research into the molecular-scale mechanism that underpins the directed assembly of crystalline materials from the solution phase into a solid-state structure through a crystallisation process is currently of significant interest.1,2 The crystallisation of organic crystals is important to the pharmaceutical and fine chemicals industries in terms of their application as crystalline ingredients or formulation components as used for a variety of materials and products such as drugs, pigments, agrochemicals and confectionery. Crystallisation under moderate supersaturation conditions is generally understood to comprise an initial 3D nucleation stage followed by the faceting of the nucleated cluster and its subsequent development to macroscopic dimensions through the 2D surface-mediated growth on the crystal's habit planes. Both the nucleation and growth stages are important with respect to their role in directing many of the key physico-chemical properties (see Fig. 1) of a crystal and/or the same when formulated into a product. Such attributes can be important in terms of a material's or product's practical utility and subsequent performance.3–6 Examination of Fig. 1 thus reveals the importance of being able to understand and potentially control the initial stages of the crystallisation process and, in particular, the inter-relationship between the structural nature of the initial nucleated clusters and the kinetics associated with their formation and the physical and chemical properties of the crystalline materials produced.7,8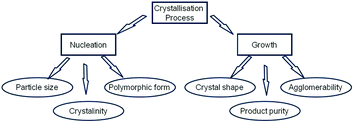 | ||
| Fig. 1 Schematic showing the role played by crystallisation fundamental parameters (nucleation and growth) on directing the physical properties of solid forms. | ||
In general, the process of nucleation is postulated to occur from the initial formation of molecular clusters to which further molecules attach to the cluster until it exceeds a critical size and a particle nucleates9,10 and subsequently further develops through growth. There is a rich body of literature in the elucidation of thermodynamic data concerning the nucleation process, and this was covered in a recent review by Davey et al.11 However, elucidation of the kinetic and structural aspects of the nucleation process has proved more challenging. Recent studies have demonstrated how advancements in experimental methods, at the one millilitre scale, have resulted in further development of theory describing the kinetic aspects and solution structure of the nucleation process utilising statistical methods.12–14 As an alternative, increases in computing power have vastly improved the sophistication and physical relevance of simulations of solution structure, self-assembly and pre nucleation clustering.15–18 This has, in turn, further increased the information about aspects of the nucleation process that are difficult, or even impossible, to measure experimentally. Reflecting these developments, a combination of advanced experimental and simulation techniques have been utilised to probe the nucleation process for the alpha form of a model compound para-amino benzoic acid (PABA) in ethanol (EtOH).
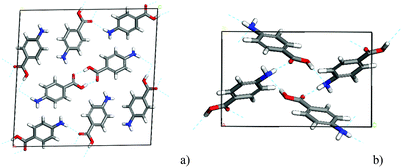
PABA contains the kind of hydrogen bonding (H-bonding) functional groups that are typical of those present in many pharmaceutical compounds and is known to crystallise in two well-defined polymorphs, alpha and beta (Fig. 2). A more recent study of the crystallisation of PABA from aqueous solutions containing selenous acid has identified a third polymorph with an orthorhombic structure.19 However, since only the alpha and beta polymorphs have been observed to form in EtOH, considerations of polymorphic competition through solute clustering will only encompass the alpha and beta forms.
The alpha and beta forms share an enantiotropic relationship, albeit interestingly even crystallisation experiments attempted below the transition temperature often yield the alpha form. Experimental crystallisation of the beta polymorph reported in the literature is often accompanied by concomitant crystallisation of the alpha form.20 Slurry experiments for PABA in EtOH above and below 13.8 °C (the transition temperature determined) by Glennon et al.21 have revealed a reversible phase change, with alpha to beta conversion below 13.8 °C and beta to alpha conversion above 13.8 °C.
Despite the study from Glennon et al.21 appearing to confirm the thermodynamic stability of the two forms as a function of temperature in EtOH, there has still to be any reported spontaneous crystallisation of the beta form from EtOH under any conditions. Hence, here we attempt to rationalise this preference for nucleation of the alpha form by attempting to understand in more detail the molecular, solution-state, pre-nucleation structure, nucleation and growth behaviour of alpha-PABA. The molecular level data consist of an understanding of how conformational changes of individual solute molecules influence the nucleation behaviour. Further molecular modelling is utilised to assess the relative stability of putative, molecular building blocks (dimers, tetramers and octamers) in EtOH and, complementing these calculations, in situ small angle X-ray scattering (SAXS) experiments of saturated EtOH solutions attempt to reveal solution and pre nucleation cluster structures. Finally, the nucleation and growth kinetics are investigated and the intermolecular interactions that influence the solute clustering and nucleation are compared to the important intermolecular interactions that control the growth of the final macroscopic particle. These processes are summarised in Schemes 1 and 2.
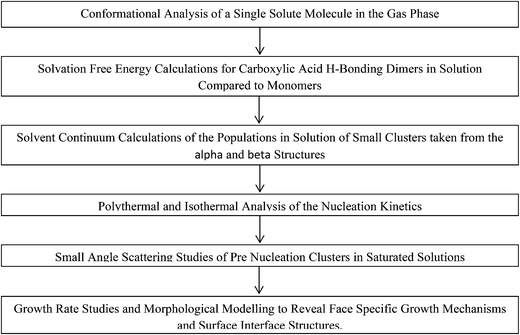 | ||
| Scheme 2 Flow chart of computation and experimental studies combined to reveal more information on the nucleation of alpha-PABA. | ||
Hence this study attempts to rationalise how each stage of the crystallisation process influences not only the final macroscopic crystal observed, but also how each stage impacts on the subsequent stages of the crystallisation process.
2 Materials and methods
2.1. Materials
Crystallographic information for all the published structures of PABA is shown in Table 1.All experimental work in this paper was carried out with alpha-PABA and 99.9% absolute ethanol both purchased from Sigma Aldrich. The AMBNAC01 and AMBNAC06 structures for the alpha form differ mainly in the geometry of NH2 group, the AMBNAC01 being slightly pyramidal and the AMBNAC06 being planar. Interestingly the beta-PABA crystal structure is also pyramidal. In this study the computational experiments were performed on the AMBNAC04 and 06 structures, and in recognition of the structures with different NH2 geometry, the conformational space of this functional group was also explored.
2.2. Computational methods
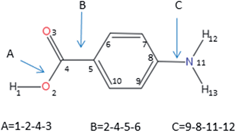 | ||
| Fig. 3 Atomic labelling and definition of the dihedral angles considered in the hierarchical selection scheme. | ||
The hierarchical selection method using these step sizes generated 288 conformers. All the geometry optimizations were performed using the Gaussian 09 package.28
A potential energy curve was computed for the transition between a pyramidal and a planar amino group in an isolated molecule. The transition energy was evaluated by performing single point energy calculations along the dihedral angle that defines the pyramidal amino group in a range −140 to 180°. The method used to scan this dihedral angle was the B3LYP functional using the 6-31G* basis set.
Selected pairwise interactions were then evaluated using the COSMO-RS7 approach. This approach utilises two steps. Firstly, the optimisation whereby the molecule or cluster is optimised using a quantum mechanical calculation within a conducting solvent dielectric continuum.33 The QM optimisation utilised an M06/6-31G* level of theory as this includes a dispersion term that is important for the accuracy of these calculations. Secondly, this calculation is combined with a fast statistical thermodynamics calculation which allows prediction of the propensity of the selected molecular conformers or clusters in solution.34–37 In this study, this approach was used for the dimers, tetramers and octamers.
| Ecr = Esl + Eatt | (1) |
2.3. Poly-thermal and isothermal turbidimetric measurements
Poly-thermal crystallisation experiments were carried out at the 1.5 ml scale with 300 rpm micro magnetic-bar stirring using an Avantium Crystal 16![[thin space (1/6-em)]](https://www.rsc.org/images/entities/char_2009.gif) 45 unit. Turbidimetric detectors were used to monitor the crystallisation and dissolution temperatures, TC and Tdis respectively.
45 unit. Turbidimetric detectors were used to monitor the crystallisation and dissolution temperatures, TC and Tdis respectively.
Solutions prepared at concentrations of 170, 180, 190 and 200 g kg−1 were heated and cooled in a pre-programmed cycle between 5 °C and 50 °C at rates of heating and cooling of 0.1, 0.3, 0.5, 0.7 and 1.0 °C min−1. Each heating/cooling experiment was repeated five times at each concentration to obtain average values of Tdis and TC, where Tdis is determined when the transmission value is 100% and TC is determined when the transmission % decreases below 90%.
Following a methodology presented elsewhere,46,47,48 plots were obtained for the relative critical undercooling (uc) values against cooling rate (q) in ln–ln coordinates. The slope of the best linear fit of these data indicates the nature of the nucleation mechanism through the application of the “rule of three” i.e. instantaneous (IN) (slope < 3) or progressive (PN) (slope > 3). The dimensionless parameter uc can be calculated from eqn (2)
 | (2) |
Likewise the value of the critical undercooling, ΔTc, can be calculated from eqn (3)
| ΔTc = Te − TC | (3) |
According to the KBHR approach,46,47 to proceed further with the analysis, equations 10 to 16 in ref. 48 could be used in the case of PN or alternatively equations 19 to 24 in the case of IN. The derivation of these expressions is subjected to compliance with the inequalities presented in eqn (4)
| uc < 0.1, auc < 1 | (4) |
Here a is the dimensionless, molecular latent-heat of crystallisation defined by eqn (5)
 | (5) |
The value of q0, a parameter related to the dependence of uc on q in the case of IN, can be related to the number of crystallites C0 at the point of nucleation t0 through eqn (6),
 | (6) |
The value of q0 can be obtained through a Nyvlt type relationship, eqn (7), by plotting the q vs. uc in ln–ln coordinates.
ln![[thin space (1/6-em)]](https://www.rsc.org/images/entities/char_2009.gif) q = ln q = ln![[thin space (1/6-em)]](https://www.rsc.org/images/entities/char_2009.gif) q0 + (n + 1)ln q0 + (n + 1)ln![[thin space (1/6-em)]](https://www.rsc.org/images/entities/char_2009.gif) uc uc | (7) |
For the isothermal analysis of alpha-PABA crystallising from ethanol, solutions with concentrations of 180 g kg−1 and 200 g kg−1 were prepared. The measurements were carried out at supersaturations (S) ranging from 1.03–1.10 and 1.07–1.15 respectively (Table 8). The values of S were calculated using the recorded MSZW data from section 3.4.1 which gave a MSZW of 5–9 °C in the concentration range studied.
The solutions were then heated to 10 °C above the dissolution temperature and held for one hour to ensure complete dissolution of the solute. The solution was then subjected to rapid cooling at 5 °C min−1 to the desired holding temperature within the MSZW. The measured induction time, τ, was taken as the difference from the start time of cooling to the time of the measured transmittance decrease indicating crystallisation. Experiments at each supersaturation were repeated 8 times at the relevant concentration to provide an average induction time measurement.
The induction time data (τ as a function of S) were analysed using classical nucleation theory50 according to eqn (8)
 | (8) |
The value of d is taken as 1 for a needle-like crystallite, γeff is the interfacial tension, and B is a term related to the molecular volume v0 and the interfacial tension. Through this relationship a plot of  vs.
vs. will yield a straight line with the slope equal to
  whereby γeff can be calculated. If a spherical critical nucleus is assumed, the radius r* and number of molecules i*, within the critical nucleus can be calculated using eqn (9) and (10),
 | (9) |
 | (10) |
2.4. Small angle X-ray scattering studies
The scattered intensity I(q) can be evaluated by the general eqn (11), where φ is the particulate number density, P(q) is the form factor which describes the electron-density distribution of the particle and S(q) is the structure factor which details the distribution of the scatterers in the solution.51| I(q) = φP(q)S(q) | (11) |
The unified fit method in the program Irena52 was used to model the Guinier and power law regime observed within the recorded data. The Unified model for a structural level is as follows;
 | (12) |
Hence the size (Rg) and fractal dimensionality (P) can be extracted for various structurally-related scattering levels. Where P < 3 indicates presence of mass fractals, 3 < P < 4 indicates surface fractals dimensionality and P > 4 indicates diffuse interfaces.53,54 A detailed derivation of the unified fit method and its application to nucleation of an organic material from solution can be found in the literature.55–57
Fitting of simple geometrical form factors to scattering data was carried out using Scatter.58 The form factors, P(q), can be calculated from the scattering amplitudes F(q) from hypergeometric functions of the form;
 | (13) |
SAXS measurements were taken at the SAXS-1 beam line at the Brazilian Synchrotron Light Laboratory, Campinas, Brazil.60 The liquid sample cell of 2 mm thickness was temperature controlled. The diameter of the 8.3 keV primary X-ray beam was 1.5 mm. The X-ray beam chamber, including the collimator, sample cell, and up to the detector, was fully vacuumed to 10−2 mbar. The Pilatus 300 K detector for SAXS pattern collection had a dimension of 84 × 107 mm with a pixel size of 172 micron. This set up allowed a q space range of 0.128–5.4 nm−1. Data collection times were 29 s with 1 s for detector binning. The SAXS pattern intensities collected were then corrected for primary beam intensity variation, transmission, and a background from a clean sample of ethanol was subtracted.
Alpha-PABA solutions in ethanol with the concentration of 247 g kg−1 saturated at 50 °C were prepared. The solutions were pre-heated and kept at 55 °C while being transferred into the sample cell in the beam line. The cell temperature was monitored using a thermocouple inserted into the cell next to the sample environment. During a poly-thermal cooling cycle from 55–30 °C at a rate of 0.1 °C min−1, SAXS patterns were collected.
2.5. Crystal growth rate measurements
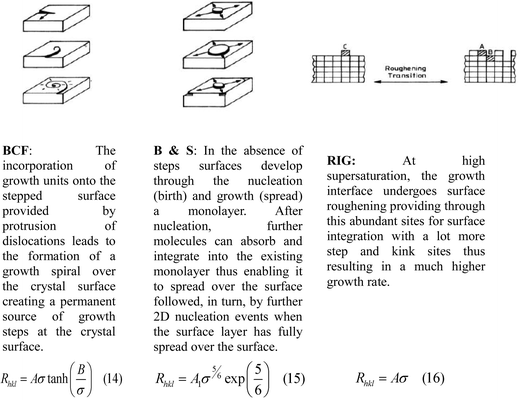
The crystal growth rates of alpha-PABA in EtOH were measured in an analogous approach to that used in a recent study.61 In this, a 0.8 ml parallelepiped UV cuvette cell was filled with a supersaturated solution and a seed crystal. The cuvette cell was placed inside a glass windowed growth cell sat on an IMT-2 inverted microscope. Water was flowed round the cuvette cell to control the temperature, first at 40 °C to slightly dissolve the seed and remove surface imperfections, then the temperature was crashed to 20 °C where crystal growth was observed. Images were captured at 1 or 2 minute intervals using the Infinity Analyse software, which was also used to measure the length and width of the imaged crystals, which defined the growth rates of the (0 1 −1) and (1 0 −1) surfaces respectively. These growth rates were measured over a supersaturation range (σ) of 0.03–0.20. In addition, interfacial angles between the side and capping faces were measured in ImageJ and compared to calculated interfacial angles from Morang to aid in identifying the capping faces.The growth rate vs supersaturation measurements were fitted to three different equations that represent crystal growth mechanisms, Burton Carbrera and Frank (BCF),62 Birth and Spread (B & S),63,64 and Rough Interfacial Growth (RIG)65 shown in Fig. 4.
The measured face specific growth rates (Rhkl) as a function of supersaturation (σ) were fitted to eqn (14), (15) and (16) using origin pro, and the best fit in terms of R2 value was deemed to represent the crystal growth mechanism for this surface.
3 Results and discussion
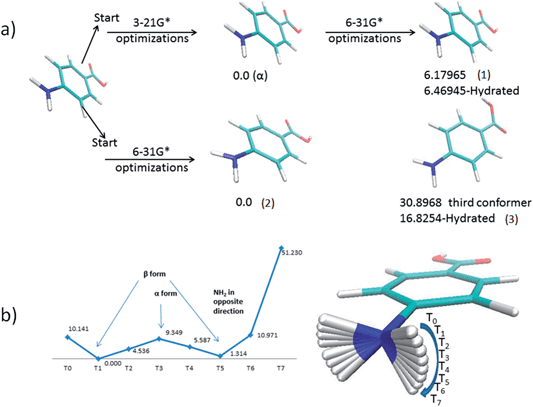
3.1. Conformational analysis of an isolated PABA molecule and the associated transition energy profile for the amino group
Fig. 5a shows the most stable conformers located for the PABA molecule in the gas phase. The first conformer (1) alpha has a planar amino group, whereas the second conformer (2) has a pyramidalized amino group. The third conformer (3) is characterized by a 180° rotation of the hydroxyl group of the carboxylic acid moiety.The outcomes of the conformational analysis were found to depend on the size of the basis set employed in the preliminary geometry optimisation step as indicated in Fig. 5a. When a small basis set was used the amine group remains planar (1) even following subsequent optimization with a larger basis set. However, the global energy-minimum (2) is located directly when a larger basis set is used for the preliminary geometry optimisation step. The energy difference in the gas phase between beta conformer (2), which is the most stable one, and the alpha conformer (1) is 6.19 kJ mol−1. The third conformer found is less stable than the other two conformers by 30.89 kJ mol−1 compared to beta conformer (2).
To investigate the apparent stability of the planar amine function, a potential energy curve was computed for the transition from a planar to a pyramidal amine group. As can be seen from Fig. 5b there is an energy barrier of about 9.35 kJ mol−1 between the planar alpha and beta pyramidal arrangements of the amine moiety. This energy barrier is probably the reason that the smaller basis set optimization stabilizes the planar amine group. The calculation also revealed from the force constants calculated for the normal modes that the conformation with a planar amine group represents a local energy minimum.
The conformational analysis shows that the conformations found in the crystal structures are very similar to the lowest energy conformers found in the gas phase. This suggests that the molecular conformation plays a limited role in the nucleation process. This behaviour is typical of inflexible molecules as was shown by the study of aspirin by Ouvard and Price.66 Conversely, it has been observed in previous studies that flexible molecules undergo significant conformational change from gas phase to crystal structure.5,6,8,67 These results therefore prompted a more rigorous investigation into the role of the intermolecular interactions on the nucleation of the alpha form.
3.2. Solvation free energies calculated for the carboxylic acid dimer of PABA
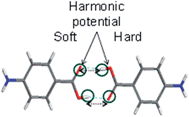
To calculate the solvation free energies of the H-bonding carboxylic acid dimers two harmonic potentials were applied to retain the H-bonding between the molecules during the thermodynamic integration technique, as shown in Fig. 6.Table 2 shows that two molecules forming a carboxylic acid dimer are preferred over two non-interacting molecules in ethanol with a free energy difference of about 5 kJ mol−1 at 293 K, which suggests it is likely that carboxylic acid dimers form in solution prior to nucleation. Recently, similar computations for PABA predicted that carboxylic acid dimer formation is more favoured in acetonitrile compared to ethyl acetate and iso-propyl alcohol and these predictions were found to be in good agreement with experimental nucleation data,51 highlighting the importance of this molecular building block in other solvents. The predicted stability of the carboxylic acid dimer in EtOH prompted a detailed comparison of the stabilities the carboxylic acid H-bonded dimer motif when compared with other molecular building blocks extracted from the crystal structures of the alpha and beta polymorphs.
| Carboxylic acid dimer | Two PABA molecules not forming –COOH dimers | ΔΔG |
|---|---|---|
| −84.07 ± 1.46 | −79.19 ± 1.49 | −4.88 |
3.3. Dielectric solvent continuum analysis of molecular building blocks in ethanolic solutions
| Bond | Multiplicity | Distance (Å) | Total (kcal mol−1) |
|---|---|---|---|
| Aα | 1 | 8.07 | −7.10 |
| Bα | 1 | 8.03 | −6.94 |
| Cα | 2 | 3.84 | −2.68 |
| Dα | 2 | 3.84 | −2.58 |
| Eα | 1 | 7.91 | −1.90 |
| Fα | 1 | 7.82 | −1.28 |
| Bond | Multiplicity | Distance (Å) | Intermolecular energy (kcal mol−1) |
|---|---|---|---|
| Aβ | 1 | 4.17 | −2.57 |
| Bβ | 2 | 8.11 | −2.45 |
| Cβ | 2 | 5.73 | −2.39 |
| Dβ | 2 | 6.74 | −1.46 |
Fig. 7 and Table 3 show the strongest interactions in the alpha structure are the OH⋯O carboxylic acid H-bonding dimers. Interestingly, the second strongest interaction is the head-to-head π–π stacking interaction. Fig. 8 and Table 4 show the head-to-tail offset π–π stacking interaction is found to be the strongest in the beta structure, albeit with interaction energies very similar to that of the OH⋯N and NH⋯O interactions that make up the 4-membered H-bonding ring structure. These data were used to select ten dimers to analyse using the solvent dielectric continuum approach, and these dimers were then used to select tetramers and octamers present in both structures for further analysis.
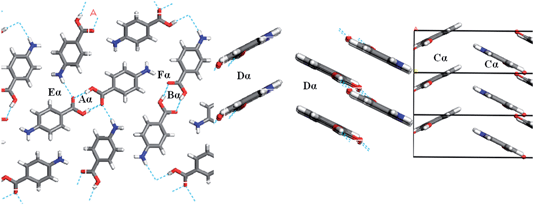 | ||
| Fig. 7 Strongest H-bonding intermolecular interactions of alpha-PABA viewed down the b-axis (left) and strongest intermolecular π–π stacking interactions down the a-axis (right). | ||
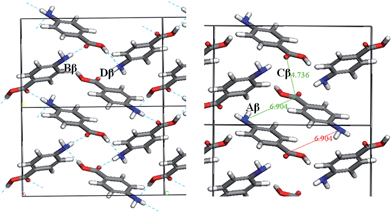 | ||
| Fig. 8 Strongest intermolecular interactions of beta-PABA. H-bonding ring interactions shown (left) and π–π stacking interactions shown (right). | ||
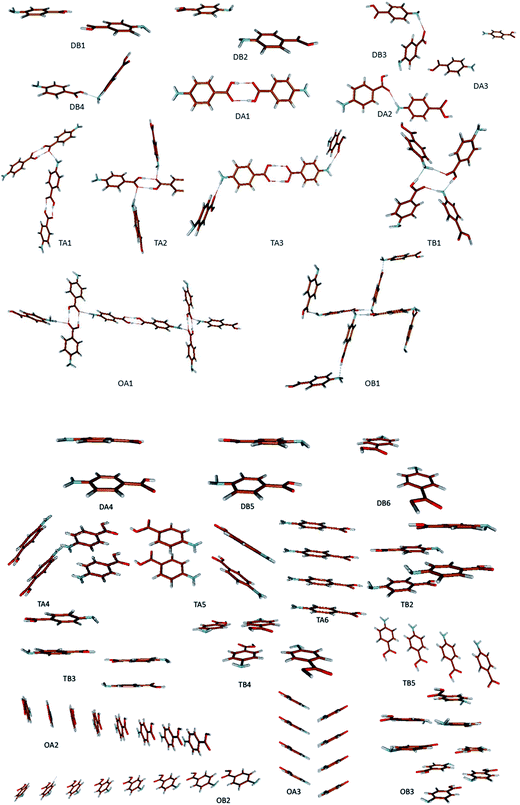
The ten strongest dimers selected from the crystal structures alpha and beta are shown in Fig. 9.
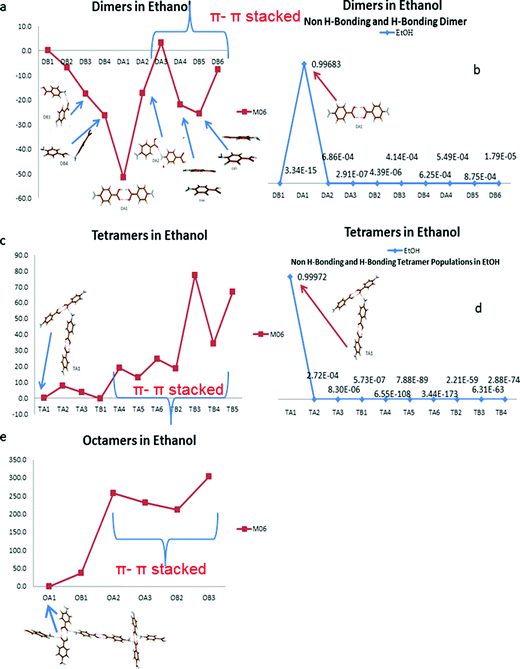
Fig. 10 suggests the cluster containing the carboxylic acid dimer is the most stable in ethanol (DA1). The energies of the non-hydrogen bonded dimers (DA4, DB5 and DB6) showed that the most stable non-H-bonding dimer is the head-to-tail stacking motif (DB5). Relative to the H-bonding dimers, the head-to-tail π–π stacking cluster has comparable stability to the DA2 (NH⋯O) and DB4 (OH⋯N) motifs.
Fig. 10b shows the dominance in propensity of the carboxylic acid H-bonding dimers in ethanol above any of the other strong pairwise intermolecular interactions identified from the crystal structures of alpha and beta.
The large difference in energy between the H-bonding and non-H-bonding tetramers was reflected in the solution propensities calculated. The TA1 structure appears to dominate due to its composition of two H-bonding carboxylic acid dimers. This particular motif was the most stable over the tetramer containing one carboxylic acid dimer and two NH⋯O hydrogen bonds, suggesting that the NH⋯O interactions are secondary to the OH⋯O interactions when considering the overall packing of the structure.
Fig. 10e reveals that for the two octamers selected, the cluster that facilitates three hydrogen bonded interactions (OA1) was found to be the most stable in ethanol, whilst the π–π stacked dimers were found to be much less stable than H-bonded ones in a range of 200 to 400 kJ mol−1.
The calculated stability of dimers, tetramers and octamers in solution suggest that the formation of the carboxylic acid H-bonded dimers in solution could be the first step in the self-assembly of alpha-PABA and the reason why, under conditions of spontaneous crystallisation, the alpha form dominates in EtOH.
3.4. PABA nucleation kinetics from ethanolic solutions
| 170 g kg−1 rate (°C min−1) | T dis (°C) | T C (°C) | ΔTc |
|---|---|---|---|
| 0.1 | 32.05 ± 0.78 | 22.40 ± 1.13 | 6.91 |
| 0.3 | 32.18 ± 0.87 | 16.10 ± 1.57 | 13.21 |
| 0.5 | 33.14 ± 1.10 | 7.85 ± 2.62 | 21.46 |
| 0.7 | 35.63 ± 1.10 | 5.40 ± 0.14 | 23.91 |
| 1 | 41.90 ± 3.42 | −0.67 ± 0.32 | 29.98 |
| T e = 29.31 |
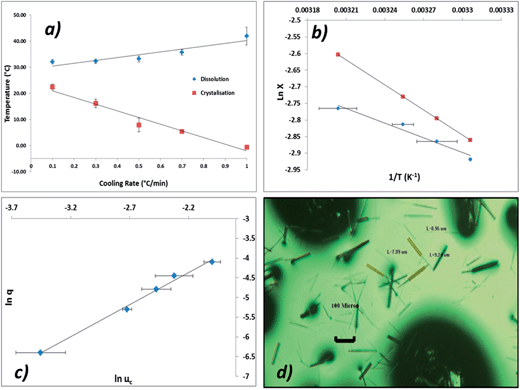
It can be seen from Fig. 11a that the crystallisation temperature is highly dependent on the cooling rate, indicating that the crystallisation is kinetically controlled. This behaviour can also be understood by analysing the size of the MSZW which exceeds 40 °C at higher cooling rates; this indicates that solutions of ethanolic alpha-PABA can be significantly undercooled for long periods of time, particularly at low concentrations.
Fig. 11b shows a van't Hoff plot of the measured solubility curve from measured values of Tdis and that this is below the ideal solubility curve, indicative of solute–solute interactions being favoured in solution. This observation correlates well with the results of the solvation free energy calculations showing that a solvated carboxylic acid dimer is more stable than two isolated, solvated molecules.
Fig. 11c shows a plot of critical undercooling vs. cooling rate in ln–ln coordinates for the concentration 170 g kg−1. Table 6 highlights the results of this ‘rule of three’ analysis for all concentrations of ethanolic alpha-PABA solutions, listing the regression values for the linear fits and the inequalities test for the data. The results show that for all concentrations the slope of these plots is <3 identifying the mechanism of nucleation for ethanolic alpha-PABA solutions in the studied concentration range to be instantaneous, whereby all nuclei are formed at the same time, hence the solution will contain a fixed number of crystallites following nucleation.
| Conc. (g kg−1) | T e (°K) | Slope of ln![[thin space (1/6-em)]](https://www.rsc.org/images/entities/char_2009.gif) q vs. ln q vs. ln![[thin space (1/6-em)]](https://www.rsc.org/images/entities/char_2009.gif) uc uc |
u c | au c | u c < 0.1, auc < 1 (yes/no) |
R
2 of linear fit to ln![[thin space (1/6-em)]](https://www.rsc.org/images/entities/char_2009.gif) q vs. ln q vs. ln![[thin space (1/6-em)]](https://www.rsc.org/images/entities/char_2009.gif) uc uc |
|---|---|---|---|---|---|---|
| 170 | 302.46 | 1.63 | 0.083 | 0.68 | Yes | 0.99 |
| 180 | 304.85 | 1.76 | 0.066 | 0.54 | Yes | 0.96 |
| 190 | 307.32 | 1.71 | 0.052 | 0.41 | Yes | 0.85 |
| 200 | 312.13 | 1.51 | 0.042 | 0.34 | Yes | 0.86 |
Table 7 presents the data for q0 and n for the 4 concentrations of ethanolic alpha-PABA solutions. Considering that n can only take a value between 1 and 2, the calculated values of n are more likely to be 1 rather than 2. The cases where n is equal to 1 are indicative of a system whereby crystallite growth is rate-limited by the diffusion of solute molecules towards the growing crystallites.
| Conc (g kg−1) | a | ln (q0) | n + 1 | q 0 (K s−1) | n | C 0 (m−3) | Nuclei/1 ml | ΔTc range/°C |
|---|---|---|---|---|---|---|---|---|
| 170 | 8.17 | 0.77 | 1.63 | 2.16 | 0.63 | 1.36 × 10⁹ | 1364 | 6.91–29.98 |
| 180 | 8.08 | 0.07 | 1.76 | 1.07 | 0.76 | 6.81 × 10⁸ | 681 | 7.13–21.30 |
| 190 | 7.94 | 0.20 | 1.71 | 1.23 | 0.71 | 7.85 × 10⁸ | 785 | 5.09–16.57 |
| 200 | 7.93 | 0.05 | 1.51 | 1.05 | 0.51 | 6.63 × 10⁸ | 663 | 3.81–13.43 |
The parameter q0 is related to C0 through eqn (6) and with the assumption of the following parameters; where d = 1, m = 1, αdet = 1 × 10⁻⁶, KG = 1 × 10⁻⁸ m s−1, kv = 1.28 × 10⁻¹⁰. The value of d was assumed for a needle-like crystallite; m was assumed to be 1 for growth mediated by diffusion of the solute through a stagnant layer around the crystal. KG is the overall growth rate of the crystal and was assumed from a combination of in situ growth studies of alpha-PABA in ethanol solutions (section 3.6). kv was calculated from kv = 2A0, where A0 is the fixed cross-sectional area in the direction of the long axis of the needle, which is nearly square shaped. The widths of alpha-PABA crystals were measured using optical microscopy after poly-thermal cooling crystallisation experiments; an example is shown in Fig. 11d. The measured values of the width were found to be in the range 6–10 μm, a middle value of this range, 8 μm, was chosen as a good approximate value and used to calculate A0.
The values calculated for C0 at the various solution concentrations are presented in Table 7. The values calculated for ethanolic alpha-PABA solutions were found to show good agreement with previous studies of a similar organic molecule exhibiting instantaneous nucleation, aspirin. The values are in the range of 6.6 × 10⁸–1.3 × 10⁹ m−3 for PABA and 1 × 10⁷–1.28 × 10¹⁰ m−3 for aspirin.68
The poly-thermal data presented highlight how alpha-PABA nucleates and subsequently crystallises from ethanolic solutions, where nuclei seem to be stable to large values of under cooling as was shown by observation of very large MSZWs. The crystallisation thus appears to be kinetically dependent indicated by the large variation of TC as a function of cooling rate. These results are consistent with the fact that steeper TC (q) lines, such as the ones obtained in this case, would deliver uc (q) lines with lower slopes such as in the case of IN, in which all the nuclei are instantaneously formed only after a sufficient supersaturation level is reached. This fact might indicate that although the van’t Hoff analysis shows that solute–solute interactions are preferable in solution, the chemistry related to the process of de-solvation, to further give way to the formation of clusters’ building units, would still be somewhat rate limiting in the nucleation process.
| 200 g kg−1 holding temperature (°C) | T (°K) | Average τ (s) | Equilibrium conc (g kg−1) | S (supersaturation ratio) |
|---|---|---|---|---|
| 30 | 303 | 3746 | 174.40 | 1.15 |
| 32 | 305 | 4780 | 180.29 | 1.11 |
| 33 | 306 | 5850 | 183.30 | 1.09 |
| 34 | 307 | 7700 | 186.37 | 1.07 |
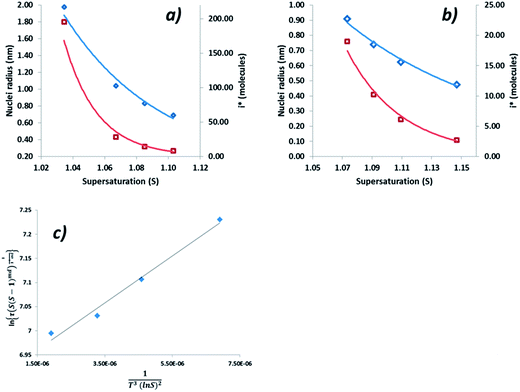
Interfacial tensions, γeff, were calculated for each concentration using eqn (8), and the calculated slope (Slexp) from the linear relationship which is equal to  . The linear relationship for a concentration of 200 g kg−1 is shown in Fig. 12c, where the fit to the data is represented by y = 48
![[thin space (1/6-em)]](https://www.rsc.org/images/entities/char_2009.gif) 641x + 6.8876.
641x + 6.8876.
The range of calculated values of r* and i*, together with the slope of the linear fit and the resulting value of γeff for the two concentrations of ethanolic alpha-PABA solutions are presented in Table 9. The calculated values of i* for the 180 g kg−1 solution shows increasing values from 8–195 molecules as a function of decreasing supersaturation, ranging from 1.03–1.10, and for the 200 g kg−1 solution the values are lower at 3–19 molecules, which is expected for a higher supersaturation. These values are represented graphically in Fig. 12a and b for a solution concentration of 180 and 200 g kg−1 respectively.
| Conc g kg−1 | Slexp | R 2 | γ eff (mJ m−2) | r* (nm) | i* (molecules) |
|---|---|---|---|---|---|
| 180 | 52![[thin space (1/6-em)]](https://www.rsc.org/images/entities/char_2009.gif) 935 935 |
0.94 | 0.85 | 0.69–1.98 | 8–195 |
| 200 | 48![[thin space (1/6-em)]](https://www.rsc.org/images/entities/char_2009.gif) 641 641 |
0.98 | 1.31 | 0.48–0.91 | 3–19 |
Sullivan et al. have recently reported calculated values of γeff for alpha-PABA in acetonitrile, 2-propanol and ethyl acetate to be in the range of 1.33–2.44, however the higher values in this case were calculated for a much larger range of supersaturations when compared to the range used in these experiments. The calculated interfacial tension and r* values at 200 g kg−1 shows good agreement with the calculated value of PABA in acetonitrile by Sullivan et al.,12 where the supersaturation range is very similar in both studies; as such this provides some confidence in the data presented here. The low values of the calculated interfacial tension for the 180 g kg−1 solution are likely due to the low supersaturation range studied and hence the range of r* values is large; 8–195.
The critical cluster sizes calculated, 0.48–1.98 nm, seem relatively small considering the observed stability of PABA in ethanol from the poly-thermal analysis. To further probe cluster size information during nucleation, small angle X-ray scattering experiments were conducted to reveal this size information during a cooling crystallisation of alpha-PABA in ethanol.
3.5. Small angle X-ray scattering studies of alpha-PABA in ethanolic solutions during cooling
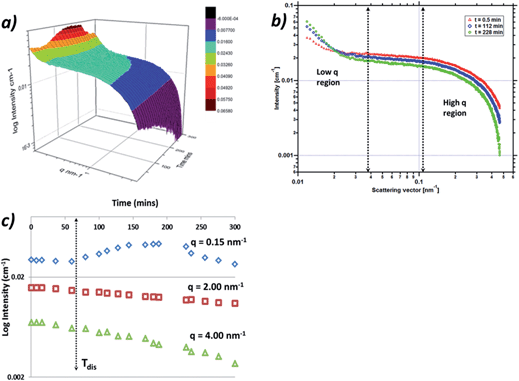
Fig. 13a shows a three dimensional plot of the fully corrected data from the 0.1 °C min−1 cooling crystallisation experiment, plotted as intensity against momentum transfer, q, against time in minutes. The data which reflect the PABA system during the cooling process as the solution enters the metastable zone and subsequently crystallises reveal two regions of interest. The first region is the low q region centred around 0.15 nm−1 which exhibits intensity and gradient increases during the cooling process, indicating increasing numbers and size of scatterers. The second region is the high q region around 3–4 nm−1 which exhibits increases in slope and also intensity decreases throughout the cooling process (Fig. 13b), suggesting the scatterers are increasing in size but decreasing in number.The high q region was found to be well represented in q space and exhibited a Guinier region followed by a power law regime. This latter area is consistent with scattering from the monomer of PABA or small aggregations of 1–2 nm in size, such as a dimer of PABA. The low q region was not found to be very well differentiated in the data due to the intensity cut off by the beam-stop, which limited the low q region beyond 0.1 nm−1. The scattering in this region can be expected to be due to larger aggregates in the region of 10–40 nm, however a complete analysis of this region was not found to be possible due to the low number of data points and as a result the Guinier region at low q was not observable.
Fig. 13c shows the intensity variation for three regions of the q range; low (0.15 nm−1), medium (2 nm−1) and high (4 nm−1) values of q. The intensity from the low q region exhibits an increase at around 60 min, this corresponds to the time the solution temperature entered the meta-stable zone. This could indicate the formation of the large molecular aggregations or clusters seen at low q. The data are consistent with the size and numbers of these clusters growing as evidenced by the intensity increase throughout the cooling process until around 230 min. The intensity at this latter stage of the cooling process was then found to decrease, which would be consistent with these larger clusters having grown beyond the range of q space observable by the detector. The intensity was found to change at 2 and 4 nm−1 showing a general decrease throughout the cooling process which is likely due to the molecules of PABA being consumed by the nucleation process and consequently by the subsequent crystallisation process, whereby molecules of PABA would be expected to transfer to the larger clusters observed in the low q region.
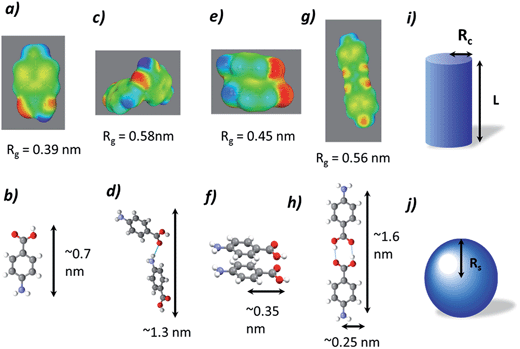
The data collected were analysed using the unified fit model, which allowed various related structural levels of the system to be analysed with respect to the radius of gyration (Rg) and to the power law value (P) to give a calculated fit to the data. The Rg values of the monomer NH⋯O dimer, stacked dimer and carboxylic acid H-bonding dimer structure for alpha-PABA calculated in Crysol69 were found to be 0.39 nm, 0.58 nm, 0.45 nm and 0.56 nm respectively. The structural models and the calculated Rg values are shown in Fig. 15a, c, e and g. The Rg progression, measured from the unified fit analysis of the experimental high q region, shows an increase from the initial value of 0.47 nm, to its maximum at 0.55 nm, prior to crystallisation (Fig. 14b). This seems to be consistent with a model of molecular aggregation whereby a distribution of monomers and dimers of PABA exist in solution prior to crystallisation. This distribution seems to shift towards a dimer structure as the supersaturation increases but the data obtained could not reveal the exact structure of this dimer. However, comparison of the calculated Rg values for the stacked dimer, NH⋯O dimer and the carboxylic acid H-bonding dimer with the measured values from the unified fit analysis shows the maximum observed Rg exceeds the calculated Rg for the stacked dimer. This suggests the molecular aggregations observed at this stage of the cooling process do not exhibit this stacking motif but may suggest formation of the NH⋯O or carboxylic acid H-bonding dimer. The calculated P values for the low q region are shown in Fig. 14a which shows a progression from 0.8 to a maximum of 1.9 as a function of time, after which the maximum in the power law value was found to rapidly drop, consistent with the intensity drop-off of the low q region. A decay of intensity of q−1 or q−2, taking a fractal approach to the system, would indicate the presence of a mass fractal dimension. The increase of the P value from 1–2 indicates increased ordering of the cluster structures in the low q region. This may represent the presence of disordered aggregations of molecules in the size range of 10–40 nm which increase in size and also become more ordered as the solution supersaturates. The dimer structures identified from the high q region are likely transferred to the growing larger aggregates of the low q region during this process.
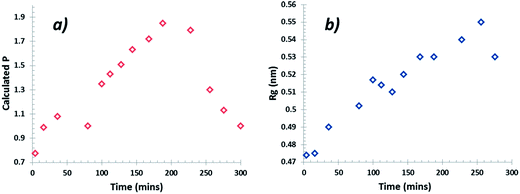 | ||
| Fig. 14 (a) Progression of the power law value (P) at low q values and (b) Rg (Å) progression at high q during the cooling crystallisation. | ||
To further investigate the proposed dimer cluster structure observed during the unified fit analysis, fitting of the experimental data was carried out using simple geometric form factors, P(q), of a cylinder and a sphere. This was rationalised by analysing the surface charge density distributions, calculated using the conducting solvent, di-electric continuum approach,32 in ethanol for a NH⋯O dimer, stacked dimer and the carboxylic acid H bonding dimer, shown in Fig. 15c, e and g respectively. A simple comparison can be made for an carboxylic acid H bonding dimer or NH⋯O represented by a cylindrical form factor, with the stacked dimer represented by a spherical form factor indicated in Fig. 15i and j.
Taking both of these form factors into account and fitting to the high q region good fits to the data were achieved, as can be seen from the χ2 values in Table 10. As expected the value of I(0) in both cases falls as time increases; this represents a decrease in the number of scatterers as the small monomer/dimer units are consumed by the larger growing structures, ∼10–40 nm, seen in the low q region.
| Time (min) | Cylinder I(0) | Cylinder L (nm) | Cylinder χ2 | Sphere I(0) | Sphere Rs (nm) | Sphere χ2 |
|---|---|---|---|---|---|---|
| 0.5 | 2.11 × 10⁻² | 1.15 | 1.11 | 2.20 × 10⁻² | 0.64 | 0.62 |
| 36 | 2.09 × 10⁻² | 1.14 | 1.17 | 2.15 × 10⁻² | 0.64 | 0.68 |
| 80 | 1.96 × 10⁻² | 1.18 | 2.02 | 2.04 × 10⁻² | 0.65 | 0.99 |
| 128 | 1.90 × 10⁻² | 1.30 | 2.05 | 1.95 × 10⁻² | 0.66 | 1.01 |
| 168 | 1.79 × 10⁻² | 1.30 | 1.50 | 1.88 × 10⁻² | 0.68 | 1.66 |
| 228 | 1.71 × 10⁻² | 1.45 | 2.61 | 1.72 × 10⁻² | 0.69 | 1.43 |
| 256 | 1.65 × 10⁻² | 1.48 | 2.65 | 1.67 × 10⁻² | 0.70 | 2.07 |
| 300 | 1.56 × 10⁻² | 1.53 | 2.45 | 1.55 × 10⁻² | 0.68 | 2.00 |
The spherical radii of the fitted form factor increases from 0.64 nm to a maximum value of 0.70 nm during the cooling process and this value appears too large when compared to a maximum radii of 0.35 nm for the stacked dimer. This overestimation of the calculated value of Rs maybe due to the assumption of a spherical form factor for the stacked dimer rather than a more elongated structure as seen in Fig. 15f. The cylindrical form factor length increases from 1.15 nm to 1.53 nm as shown in Table 10, this is an intermediate value between the monomer length, 0.7 nm and the carboxylic acid H-bonding dimer length, 1.6 nm. The maximum calculated cylinder length of 1.53 nm is larger than the NH⋯O dimer dimensions, and this could indicate that the carboxylic acid H-bonding dimer is the structure favoured due to better agreement to the molecular dimensions.
This observation could indicate that the carboxylic acid H-bonding dimer is favoured prior to nucleation and is the important building block in the self-assembly of alpha-PABA. This is supported by data in section 3.3 that calculates the strongest pairwise interaction in the alpha-PABA crystal structure is the carboxylic acid H-bonding dimer. In addition, the carboxylic acid H-bonding dimer is also predicted to be the most favoured interaction in solution from calculations in ethanol from section 3.3, which provides further support of this interpretation.
3.6. Growth rate measurements and morphological and surface modelling
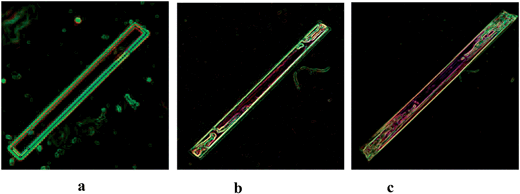
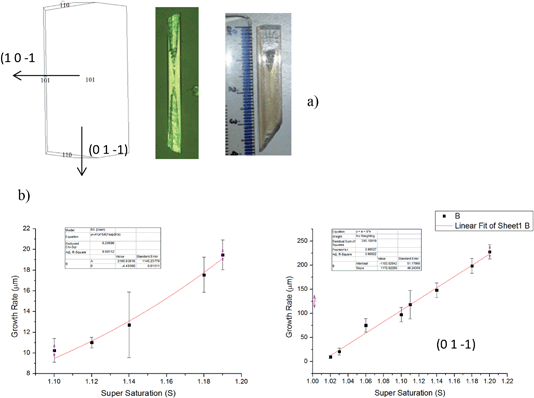
Fig. 16 shows the morphology of alpha-PABA crystals grown in EtOH at various super saturations. The BFDH list suggests that the (0 1 ¬1), (1 ¬1 0) and (1 1 ¬1) surfaces are morphologically important at the capping ends of the needle and the attachment energy calculations predict similar relative growth rates for each face. Therefore the interfacial angle between the (1 0 ¬1) surface and the capping face was measured to identify the correct Miller index for that face.Fig. 16a reveals that for low supersaturations the interfacial angle between the side (1 0 −1) surface and the capping face stays constant at around 90° throughout the observed growth, which is consistent with the interfacial angle between the (0 1 −1) and (1 0 −1) faces. However, increasing the supersaturation was found to create roughening and unstable growth resulting in poor lattice perfection observed at the capping faces, and the interfacial angles are observed to change as the crystal grows. Fig. 16b shows the interfacial angle to be around 90° after two minutes of growth at σ = 0.11, however Fig. 16c shows after 6 min of growth the angle has changed to around 70°, which does not match any of the calculated interfacial angles between the (1 0 −1) and likely capping faces. The attachment energy morphology predicts the capping face to be the (1 −1 0) face as the attachment energies of the (1 −1 0) and (0 1 −1) surfaces are very similar; considering the interfacial angles measured, it appears the original face that facets is the (0 1 −1) surface and the roughening changes the interfacial angle, therefore the (0 1 −1) faces are assumed to be the capping face.
Fig. 17b shows the fit of growth rate along the long axis of the needle (0 1 −1) as a function of supersaturation corresponds to an RIG mechanism even at low supersaturations. Conversely, fitting of the width growth rate, i.e. normal to the (1 0 −1) surface as a function of supersaturation, corresponds to a B & S growth mechanism above σ = 0.1. Almost no growth is observed below σ = 0.1 which suggests the presence of a dead zone below σ = 0.1 for the (1 0 −1) face. Comparing between the predicted and observed growth morphologies shown in Fig. 17a (left and right respectively) reveals a more needle-like morphology is the observed crystal habit in comparison to that which is predicted. This difference perhaps reflects the difference in growth rates and mechanism pertaining to the (1 0 −1) and (0 1 −1) faces.
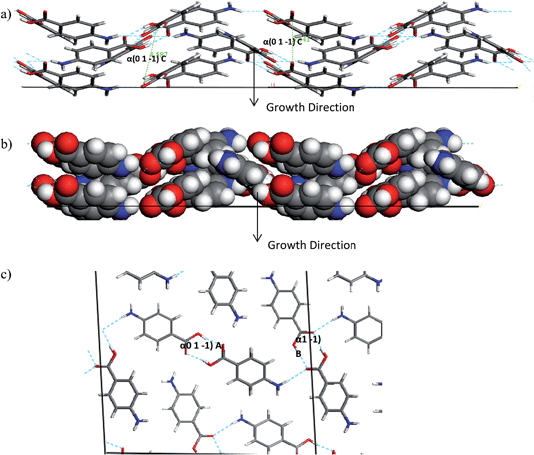
The interactions which contribute to the attachment energy of the (0 1 −1) and (1 0 −1) surface were identified in Fig. 18 and 19 along with Tables 11 and 12 to understand the pairwise interactions that contribute to the growth.
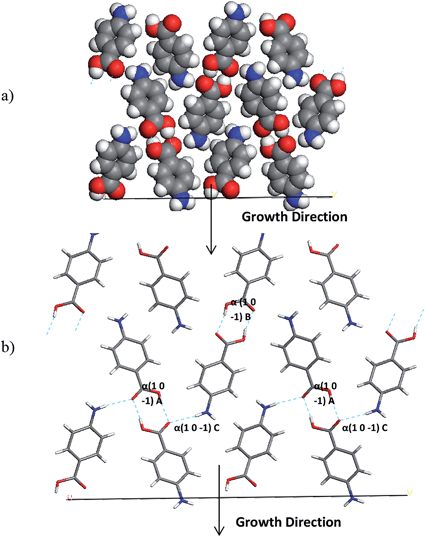 | ||
| Fig. 18 (a) Space fill and (b) stick model of the alpha-PABA (1 0 −1) surface. The stick model has strongest intermolecular interactions exposed at this surface contributing to growth marked. | ||
| Bond | Multiplicity | Distance (Å) | Intermolecular energy (kcal mol−1) |
|---|---|---|---|
| Alpha (1 0 −1) A | 1 | 8.07 | −7.10 |
| Alpha (1 0 −1) B | 1 | 8.03 | −6.94 |
| Alpha (1 0 −1) C | 2 | 7.91 | −1.90 |
| Bond | Multiplicity | Distance (Å) | Intermolecular energy (kcal mol−1) |
|---|---|---|---|
| Alpha (0 1 −1) A | 1 | 8.07 | −7.10 |
| Alpha (0 1 −1) B | 1 | 8.03 | −6.94 |
| Alpha (0 1 −1) C | 2 | 3.84 | −2.68 |
Fig. 18 and Table 11 reveal the growth of the (1 0 −1) surface is dominated by H-bonding interactions as the COOH and NH2 functional groups are directed along the growth normal of this surface. Considering growth from ethanol, binding of the ethanol molecules could provide some competition for the PABA molecules at this surface, as the OH group of the ethanol molecules would be expected to H-bond to the exposed C![[double bond, length as m-dash]](https://www.rsc.org/images/entities/char_e001.gif) O groups. Hence the de-solvation at this surface could be slower than at other surfaces and slow down the growth rate of this surface.
O groups. Hence the de-solvation at this surface could be slower than at other surfaces and slow down the growth rate of this surface.
Fig. 19a shows the space fill model of the (0 1 −1) surface and how the PABA molecules stack in a wave-like pattern, therefore this forms the π–π interactions that facilitate the fast growth along the long axis of the needle. The H-bonding carboxylic acid dimers also contribute to the attachment energy of this surface, but the direction of the intermolecular interaction actually is almost perpendicular to the growth normal, compared to the π–π stacking interactions which are almost parallel to the growth normal. The H-bonding functional groups are orientated away from the surface at the (0 1 −1) surface which suggests they are less likely to interact with the polar ethanol molecules, which could mean that the PABA molecules face less competition to bind to this surface and incorporate into the lattice. The extra competition created by the EtOH binding at the (1 0 −1) surface could lead to an increase in the amount of PABA molecules attempting to bind at the capping (0 1 −1) surface leading to an increase in supersaturation around these faces. This appears to result in the rough interfacial growth mechanism and disorder at this surface which is demonstrated by the appearance of the sector zoning effects.
Interestingly, though the supersaturation vs. growth rate measurements of the (0 1 −1) fit with a roughening growth mechanism, the images of the crystals do not exhibit obvious roughening and the growth facets in this direction appear to be relatively smooth. Fig. 19a shows the molecules attach by π–π stacking interactions which would be expected to exhibit strong molecular recognition when molecules diffuse from solution to the surface, resulting in the extremely fast growth observed at this surface. It is possible that even though the surface is growing by a rough polynucleation mechanism, the strong molecular recognition allows the molecules to attach in an ordered manner and create a smoother facet than normally seen from growth by the RIG mechanism.
It would seem that even though the solution structure and self-assembly of the alpha form appears to be facilitated by H-bonding interactions, the growth of the alpha form is dominated by π–π stacking interactions along the long axis of the needle. It has been suggested in a recent study by Lovette and Doherty70 that growth spirals would contribute to the growth of the capping faces of alpha-PABA at low supersaturations. However, in this work, the growth rate vs. supersaturation curves suggests, in contrast, that the growth is via a polynucleation roughening mechanism even at low supersaturations. This conclusion also correlates with the analysis of the polythermal data which proposes that the early stages of growth would be dominated by diffusion through solution rather than interface kinetics mediated by the presence of growth spirals. This would suggest that a degree of interfacial roughening along the long axis of the needle occurs in all conditions in EtOH.
4 Conclusions
Using a multi scale approach, the nucleation of PABA has been examined, and the key outcomes are summarised in Table 13.| Techniques | Subsection | Outcomes | |
|---|---|---|---|
| Modelling | Conformation analysis | 3.1 |
– Three distinct conformers found
– One with beta crystal structure conformation (the most stable) – One with the alpha crystal structure conformation |
| Modelling | Solvation free energies | 3.2 | – Two molecules forming a carboxylic acid dimer preferred over two non-interacting molecules |
| Modelling | Solid state crystal chemistry dominating intermolecular interactions | 3.3 |
– Alpha packing dominated carboxylic acid H-bonds and head-head π–π stacking
– Beta packing dominated by 4-membered NH...O and OH...N H-bonding ring and head-tail offset stacking interactions |
| Modelling | Cluster modelling-populations | 3.3 |
– Carboxylic acid dimer most stable in ethanol
– Tetramers and octamers containing two and four carboxylic acid dimers found the most stable in solution |
| Modelling | Morphology and growth interfaces | 3.6 |
– Prediction of a lathe like morphology
– Side (1 0 −1) surface grows via attachment of hydrogen bonds – Capping (0 1−1) surface grows via attachment of π–π stacking interactions. |
| Experimental | Solubility analysis | 3.4.1 | – Less than ideal solubility with solute–solute interactions preferred |
| Experimental | Polythermal nucleation analysis | 3.4.1 |
– Nucleation is rate-limiting step prior to crystallisation
– Instantaneous nucleation mechanism – Crystallite number range at nucleation point: 860–1957 |
| Experimental | Isothermal nucleation analysis | 3.4.2 |
– Critical cluster sizes 0.48–1.98 nm
– Critical cluster size larger for higher solution concentration |
| Experimental | SAXS | 3.5 |
– High q region reveals a model consistent with the formation of a carboxylic acid dimer as supersaturation increases
– Low q region consistent with larger cluster structures formed during undercooling of solution which increase in size and fractal dimensionality with time |
| Experimental | Growth rates | 3.6 |
– (0 1 −1) growth rates 45–230 μm min−1 over σ = 0.03–0.20
– (1 0 −1) growth rates 10–20 μm min−1 over σ = 0.1–0.2. Dead zone below σ = 0.1 for this face |
| Experimental | Crystal growth mechanisms | 3.6 |
– (1 0 −1) surface grows via 2D nucleation birth and spread mechanism
– (0 1 −1) surface grows via a poly nucleation rough interfacial growth mechanism |
This study reveals that the dominant nucleation of the alpha form of PABA over the beta form in ethanolic solutions is most likely due to the stability and favourable formation of H-bonding carboxylic acid dimers in solution. The lack of significant change between the gas phase stable conformers and conformers in the crystal structure suggests that the intermolecular interactions, rather than any conformational change, play the most significant role in crystallisation of the material.
Ab initio continuum solvent calculations of the stability of small clusters (up to 8 molecules), taken from the crystal structures of the alpha and beta polymorphs, were consistent with clusters containing the H-bonding carboxylic acid motif always being more stable than those that do not contain this motif. Combined with MD solvation free energy calculations that suggest formation of the H-bonding carboxylic acid dimer is more favoured than two individual solvated molecules in solution, these calculations suggest that this dimer formation is an important building block in the self-assembly of the alpha-PABA crystal structure.
Analysis of experimentally obtained solubility data was found to be consistent with the propensity for solute–solute interactions in good agreement with the solvation free energy calculations. The large variations of TC as a function of cooling rate observed from the poly-thermal nucleation analysis suggest that the crystallisation of alpha-PABA is strongly kinetically dependent. This might to some extent explain the interesting observation that the alpha-form is observed to nucleate below the transition temperature. These results also predict nucleation of PABA to be instantaneous and the number of crystallites formed to be small, indicating that the nuclei sizes may be large. The isothermal analysis calculates relatively small cluster sizes, 0.5–2 nm, less than might be anticipated compared to the low number of instantaneously nucleated crystallites from the poly-thermal analysis.
SAXS results from supersaturated solutions in the high q range suggest there is a distribution of monomers and dimers in solution, and that during the cooling process the distribution shifts towards an increase in dimers prior to a nucleation event, correlating with both the QM and MD solvation modelling and the analysis of the solubility data. Modelling of the Rg values for a π–π stacked dimer and the H-bonding carboxylic acid dimer show that the experimental Rg values prior to nucleation are more consistent with the H-bonding carboxylic acid dimer, correlating well with calculations of the stability of this motif in solution. Analysis of the low q range reveal larger structures consistent with a possible size range of 10–40 nm which increase in size as the solution supersaturates and the number of monomers/dimer structures in solution decreases. The increase in the value of the fractal dimension (P) from 1–2 during the super-cooling of the solution suggests increased ordering of the pre-nucleation structures as the solution supersaturates.
Though it appears that the H-bonding carboxylic acid dimers play a key role in the nucleation of the alpha-form, morphological prediction and surface interface modelling suggest that the growth is dominated by π–π stacking interactions. Growth rate measurements indicate that the alpha-form grows by a poly-nucleation roughening mechanism along the long axis of the needle even at low supersaturations, even though the optical microscopy observations appear to show a stable, planar facet. This roughening mechanism suggests that the majority of the growth is controlled by diffusion of molecules to the surface, and the attachment of molecules via the π–π stacking motif probably results in a solid–solid integration mechanism at the (0 1 −1) surface, suggesting that any growth spirals present at this surface are not influencing the growth. This correlates with poly-thermal measurements of the growth exponent (n) that suggest the growth is rate-limited by diffusion of solute across the crystal solution interface, rather than by the presence of growth spirals.
List of symbols
| A 0 | Fixed needle cross sectional area (m2) |
| a | Dimensionless molecular latent heat of crystallisation |
| B | Dimensionless thermodynamic parameter |
| C e | Equilibrium solution concentration (m−3) |
| C 0 | Concentration of instantaneously nucleated crystallites (m−3) |
| d | Dimensionality of crystallite growth |
| E cr | Lattice energy |
| E att | Attachment energy |
| E sl | Slice energy |
| i* | Number of molecules in critical nucleus |
| k | Boltzmann constant (J K−1) |
| K G | Growth rate constant m(1/m) s−1 |
| m, n | Crystallite growth exponents |
| P | Power law value |
| q | Cooling rate (K s−1) |
| q (SAXS) | Forward scattering vector (nm−1) |
| q 0 | Parameter in the uc(q) dependence for both PN and IN (K s−1) |
| r* | Critical nucleus radius (m) |
| R g | Radius of gyration (nm) |
| S | Supersaturation ratio |
| σ | Absolute supersaturation |
| T 0 | Temperature at which crystallites are instantaneously nucleated (K) |
| T dis | Dissolution temperature (K) |
| T C | Crystallisation temperature (K) |
| T e | Equilibrium dissolution temperature (K) |
| ΔTc | Critical undercooling for crystallisation (K) |
| u c | Relative critical undercooling for crystallisation |
| v 0 | Volume of solute molecule in crystal (m3) |
| alphadet | Detectable fraction of crystallised volume |
| γ eff | Effective interfacial tension of crystal nucleus in 3D HEN (J m−2) |
| λ | Molecular latent heat of crystallisation (J) |
| Slexp | Slope of induction time data plotted using linear relationship of eqn (8) |
List of abbreviations
| RIG | Rough interfacial growth |
| B & S | Birth and spread model |
| BCF | Burton–Carbera–Frank model |
| BFDH | Bravais–Friedel–Donnay–Harker |
| MD | Molecular dynamics |
| QM | Quantum mechanics |
| TI | Thermodynamic integration |
| PABA | para-Amino benzoic acid |
| EtOH | Ethanol |
| KBHR | Kashchiev–Borissova–Hammond–Roberts approach |
| MSZW | Metastable zone width |
| GAFF | Generalised Amber force field |
| RESP | Restrained electrostatic potential |
| vdW | van der Waals |
| λ coupl | Coupling parameter indicates the level of change that has taken place between two states |
Acknowledgements
The authors gratefully acknowledge the UK's EPSRC for the funding of this research through a joint collaborative Critical Mass project between the Universities of Leeds and Manchester (grant references EP/IO14446/1 and EP/IO13563/1) which forms part of the doctoral studies of two of us (IR and TDT). We also gratefully acknowledge the Critical Mass team at the University of Manchester lead by Professor's Davey and Schroeder for stimulating discussions that inspired and contributed to the research and ideas presented in this paper. One of us (DMCC) gratefully acknowledges Infinium UK for the funding of a PhD studentship. We are most grateful to Professor Andreas Klamt (COSMOlogic and University of Regensbeurg) for his valuable advice on the implementation and suitability of the COSMO-RS method with clusters of PABA. We would like to acknowledge and thank the Brazilian Synchrotron Light Laboratory Campinas for allocation of scattering beam-time, also to the beam line scientist, Dr Mateus Cardoso and his team Dr Jean Marie Polli and Mr Tiago Kalile for their efforts and helpful discussion. We also thank Dr Tomasz Stawski for very helpful and stimulating discussions regarding SAXS analysis.References
-
R. Breslow and M. V. Tirrel, Beyond the Molecular Frontier: Challenges for Chemistry and Chemical Engineering, National Research Council of the National Academies, 2003, ISBN 2003100913 Search PubMed
.
- EPSRC Grand Challenge Network in Directed Assembly, Web http://beyondthemolecule.org.uk, accessed 12 March 2014.
- R. B. Hammond, K. Pencheva and K. J. Roberts, J. Phys. Chem. B, 2005, 109, 19950 CrossRef PubMed
.
- R. B. Hammond, K. Pencheva and K. J. Roberts, Faraday Discuss., 2007, 136, 87 RSC
.
- R. B. Hammond, K. Pencheva, K. J. Roberts and T. Auffret, J. Pharm. Sci., 2007, 96, 1967 CrossRef CAS PubMed
.
- R. B. Hammond, K. Pencheva and K. J. Roberts, CrystEngComm, 2012, 14, 1069 RSC
.
- R. B. Hammond, C. Ma, K. J. Roberts, P. Y. Ghi and R. K. Harris, J. Phys. Chem., 2003, 107, 11820 CrossRef CAS
.
- R. B. Hammond, R. S. Hashim, C. Y. Ma and K. J. Roberts, J. Pharm. Sci., 2006, 95, 2361 CrossRef CAS PubMed
.
-
M. Volmer and A. Weber, Zeitschrift Fur Physikalische Chemie–Stochiometrie Und Verwandtschaftslehre, 1926, vol. 119, p. 277 Search PubMed
.
-
D. Kashchiev, Nucleation: basic theory with applications, Butterworth-Heinemann, Oxford, 2000 Search PubMed
.
- R. Davey, S. L. M. Schroeder and J. H. ter Horst, Angew. Chem., Int. Ed., 2013, 52, 2166 CrossRef CAS PubMed
.
- R. A. Sullivan, R. J. Davey, G. Sadiq, G. Dent, K. R. Back, J. H. ter Horst, D. Toroz and R. B. Hammond, Cryst. Growth Des., 2014, 14, 2689 CAS
.
- D. M. C. Corzo, A. Borissova, R. B. Hammond, D. Kashchiev, K. J. Roberts, K. Lewtas and I. More, CrystEngComm, 2014, 16, 974 RSC
.
- S. Jiang and J. H. ter Horst, Cryst. Growth Des., 2011, 11, 256–261 CAS
.
- D. Gebaur, M. Kellermeier, J. D. Gale, L. Bergstrom and H. Coelfen, Chem. Soc. Rev., 2014, 43, 2348 RSC
.
- A. Gavezotti and G. Filippini, Chem. Commun., 1998, 287 RSC
.
- S. Hamad, C. Moon, R. A. Catlow, A. T. Hulme and S. L. Price, J. Phys. Chem., 2006, 110, 3323 CrossRef CAS PubMed
.
- A. Mattei and T. Li, Cryst. Growth Des., 2014, 14, 2709 CAS
.
- R. Benali-Cherif, R. Takouachet, E. E. Bendeif and N. Benali-Cherif, Acta Crystallogr., Sect. C: Struct. Chem., 2014, 3, 323 Search PubMed
.
- S. Gracin and Å. C. Rasmuson, Cryst. Growth Des., 2004, 4, 1013 CAS
.
- H. Hao, M. Barrett, Y. Hu, W. Su, S. Ferguson, B. Wood and B. Glennon, Org. Process Res. Dev., 2012, 16, 35 CrossRef CAS
.
- T. F. Lai and R. E. Marsh, Acta Crystallogr., 1967, 22, 885 CrossRef CAS
.
- S. Athimoolan and S. Natarajan, Acta Crystallogr., Sect. C: Cryst. Struct. Commun., 2007, 63, O514 Search PubMed
.
- S. Gracin and A. Fisher, Acta Crystallogr., Sect. E: Struct. Rep. Online, 2005, 61, O1242 CAS
.
- D. Toroz and T. Van Mourik, Mol. Phys., 2006, 104, 559 CrossRef CAS PubMed
.
- D. Toroz and T. Van Mourik, Mol. Phys., 2007, 105, 209 CrossRef CAS PubMed
.
- D. Toroz and T. Van Mourik, Phys. Chem. Chem. Phys., 2010, 12, 3463 RSC
.
-
M. J. Frisch, G. W. Trucks, H. B. Schlegel, G. E. Scuseria, M. A. Robb, J. R. Cheeseman, G. Scalmani, V. Barone, B. Mennucci, G. A. Petersson, H. Nakatsuji, M. Caricato, X. Li, H. P. Hratchian, A. F. Izmaylov, J. Bloino, G. Zheng, J. L. Sonnenberg, M. Hada, M. Ehara, K. Toyota, R. Fukuda, J. Hasegawa, M. Ishida, T. Nakajima, Y. Honda, O. Kitao, H. Nakai, T. Vreven, J. A. Montgomery Jr, J. E. Peralta, F. Ogliaro, M. Bearpark, J. J. Heyd, E. Brothers, K. N. Kudin, V. N. Staroverov, R. Kobayashi, J. Normand, K. Raghavachari, A. Rendell, J. C. Burant, S. S. Iyengar, J. Tomasi, M. Cossi, N. Rega, J. M. Millam, M. Klene, J. E. Knox, J. B. Cross, V. Bakken, C. Adamo, J. Jaramillo, R. Gomperts, R. E. Stratmann, O. Yazyev, A. J. Austin, R. Cammi, C. Pomelli, J. W. Ochterski, R. L. Martin, K. Morokuma, V. G. Zakrzewski, G. A. Voth, P. Salvador, J. J. Dannenberg, S. Dapprich, A. D. Daniels, Ö. Farkas, J. B. Foresman, J. V. Ortiz, J. Cioslowski, and D. J. Fox, Gaussian 09, Gaussian, Inc., Wallingford CT, 2009 Search PubMed
.
- G. Clydesdale, R. Docherty and K. J. Roberts, Comput. Phys. Commun., 1991, 64, 311 CrossRef CAS
.
- R. Docherty, G. Clydesdale, K. J. Roberts and P. Bennema, J. Phys. D: Appl. Phys., 1991, 24, 89 CrossRef CAS
.
- R. Docherty and K. J. Roberts, J. Cryst. Growth, 1988, 88, 159 CrossRef CAS
.
- F. A. Momany and L. M. Carruthers,
et al.
, J. Phys. Chem., 1974, 78, 1595 CrossRef CAS
.
- A. Klamt and G. Schuurmann, J. Chem. Soc., Perkin Trans. 2, 1993, 799 RSC
.
- F. Eckert and A. Klamt, AIChE J., 2002, 48, 369 CrossRef CAS PubMed
.
- A. Klamt and F. Eckert,
et al.
, J. Comput. Chem., 2002, 23, 275 CrossRef CAS PubMed
.
- A. Klamt, Fluid Phase Equilib., 2003, 206, 223 CrossRef CAS
.
- J. Palomar and V. R. Ferro,
et al.
, Ind. Eng. Chem. Res., 2007, 46, 6041 CrossRef CAS
.
- B. Hess, C. Kutzner, D. van der Spoel and E. Lindahl, J. Chem. Theory Comput., 2008, 4, 435 CrossRef CAS
.
- J. Wang, W. Wang, P. A. Kollman and D. A. Case, J. Mol. Graphics Modell., 2006, 25, 247260 CrossRef PubMed
.
- J. Wang, R. M. Wolf, J. W. Caldwell, P. A. Kollman and D. A. Case, J. Comput. Chem., 2004, 25, 1157 CrossRef CAS PubMed
.
- Z. Berkovitch-Yellin, Am. Chem. Sci. J., 1985, 107, 8239–8253 CrossRef CAS
.
- P. Hartmann and W. G. Perdok, Acta Crystallogr., 1955, 8, 29–52 CrossRef
.
- R. Docherty, K. J. Roberts and E. Dowty, Comput. Phys. Commun., 1988, 51, 423 CrossRef
.
- E. Dowty, Am. Mineral., 1980, 65, 465 Search PubMed
.
- Crystal 16 details, http://www.crystallizationsystems.com/en/crystal16/.
- D. Kashchiev, A. Borissova, R. B. Hammond and K. J. Roberts, J. Cryst. Growth, 2010, 312, 698 CrossRef CAS PubMed
.
- D. Kashchiev, A. Borissova, R. B. Hammond and K. J. Roberts, J. Phys. Chem. B, 2010, 114, 5441 CrossRef CAS PubMed
.
- D. M. C. Corzo, A. Borissova, R. B. Hammond, D. Kashchiev, K. J. Roberts, K. Lewtas and I. More, CrystEngComm, 2014, 16, 974 RSC
.
- D. Kashchiev and A. Firoozabadi, J. Cryst. Growth, 2003, 250, 499 CrossRef CAS
.
-
D. Kashchiev, Nucleation: basic theory with applications, Butterworth-Heinemann, Oxford, 2000 Search PubMed
.
-
O. Kratky, in Small Angle X-ray Scattering, ed. O. Glatter and O. Kratky, Academic Press, London, 1982 Search PubMed
.
- J. Ilavsky and P. R. Jemian, J. Appl. Crystallogr., 2009, 42, 347 CrossRef CAS
.
- P. W. Schmidt, J. Appl. Crystallogr., 1991, 24, 414 CrossRef CAS
.
- H. Boukari, J. S. Lin and M. T. Harris, J. Colloid Interface Sci., 1997, 194, 311 CrossRef CAS PubMed
.
- G. J. Beaucage, J. Appl. Crystallogr., 1995, 28, 717 CrossRef CAS
.
- G. J. Beaucage, J. Appl. Crystallogr., 1996, 29, 134 CrossRef CAS
.
- C. U. Segre, S. Chattopadhyay, D. Erdemir, J. M. B. Evans, J. Ilavsky, H. Amenitsch and A. S. Myerson, Cryst. Growth Des., 2005, 5(no. 2), 523 Search PubMed
.
- S. Förster, L. Apostol and W. Bras, J. Appl. Crystallogr., 2010, 43(no. 3), 639 CrossRef
.
- S. Förster and C. Burger, Macromolecules, 1998, 31, 879 CrossRef
.
- Brazilian synchrotron details, http://lnls.cnpem.br/.
- T. T. H. Nguyen, R. B. Hammond, K. J. Roberts, I. Marziano and G. Nichols, CrystEngComm, 2014, 16, 4568 RSC
.
- W. K. Burton, N. Cabrera and F. Frank, Philos. Trans. R. Soc., A, 1951, 299–358 CrossRef CAS
.
-
M. Ohara and R. C. Reid, in Modeling Crystal Growth Rates from Solution, Prentice-Hall, 1973, pp. 225 Search PubMed
.
-
J. van der Eerden, P. Bennema and T. Cherepanova, in Progress in Crystal Growth and Characterisaton, 1973, vol. 1, pp. 219–254 Search PubMed
.
-
P. Bennema, Morphology of Crystals, Terra Scientific, Tokyo, 1987 Search PubMed
.
- C. Ouvard and S. L. Price, Cryst. Growth Des., 2004, 4, 1119 Search PubMed
.
- K. J. Roberts, R. Docherty, P. Bennema and L. A. Jetten, J. Phys. D: Appl. Phys., 1993, 26, 7 CrossRef
.
-
K. Pencheva, Ph.D. thesis, University of Leeds, England, 2006
.
- D. I. Svergun, C. Barberato and M. H. J. Koch, J. Appl. Crystallogr., 1995, 28, 768 CrossRef CAS
.
- M. A. Lovette and M. F. Doherty, Cryst. Growth Des., 2013, 13, 3341 CAS
.
| This journal is © The Royal Society of Chemistry 2015 |

