 Open Access Article
Creative Commons Attribution 3.0 Unported Licence
A GPU-accelerated immersive audio-visual framework for interaction with molecular dynamics using consumer depth sensors†
David R.
Glowacki
*abcd,
Michael
O'Connor
c,
Gaetano
Calabró
e,
James
Price
c,
Philip
Tew
b,
Thomas
Mitchell
bf,
Joseph
Hyde
g,
David P.
Tew
a,
David J.
Coughtrie
a and
Simon
McIntosh-Smith
c
aSchool of Chemistry, University of Bristol, Bristol, BS8 1TS, UK. E-mail: drglowacki@gmail.com
bPervasive Media Studio, Watershed, 1 Canons Rd, Bristol BS1 5TX
cDepartment of Computer Science, University of Bristol, BS2 9LG, UK
dDepartment of Chemistry, Stanford University, Stanford, CA 94305, USA
eEaStCHEM School of Chemistry, University of Edinburgh, Edinburgh EH9 3JJ
fComputer Science and Creative Technologies, University of the West of England, Bristol BS16 1QY
gSchool of Music and Performing Arts, Bath Spa University, Bath BA2 9BN
First published on 19th March 2014
Abstract
With advances in computational power, the rapidly growing role of computational/simulation methodologies in the physical sciences, and the development of new human–computer interaction technologies, the field of interactive molecular dynamics seems destined to expand. In this paper, we describe and benchmark the software algorithms and hardware setup for carrying out interactive molecular dynamics utilizing an array of consumer depth sensors. The system works by interpreting the human form as an energy landscape, and superimposing this landscape on a molecular dynamics simulation to chaperone the motion of the simulated atoms, affecting both graphics and sonified simulation data. GPU acceleration has been key to achieving our target of 60 frames per second (FPS), giving an extremely fluid interactive experience. GPU acceleration has also allowed us to scale the system for use in immersive 360° spaces with an array of up to ten depth sensors, allowing several users to simultaneously chaperone the dynamics. The flexibility of our platform for carrying out molecular dynamics simulations has been considerably enhanced by wrappers that facilitate fast communication with a portable selection of GPU-accelerated molecular force evaluation routines. In this paper, we describe a 360° atmospheric molecular dynamics simulation we have run in a chemistry/physics education context. We also describe initial tests in which users have been able to chaperone the dynamics of 10-alanine peptide embedded in an explicit water solvent. Using this system, both expert and novice users have been able to accelerate peptide rare event dynamics by 3–4 orders of magnitude.
1. Introduction
With advances in computational power and the improvement of software tools for exploiting modern parallel architectures, scientific models and the data sets they generate are rapidly increasing in size and dimensionality. In many cases, it is possible to design computer algorithms to analyze data sets, and thereby identify important features and trends. However, for a wide class of problems – e.g., where the data sets involve extremely high-dimensional spaces and non-linear relationships, and identification of interesting phenomena requires some qualitative judgment – it is often the case that human subjects can identify important trends faster than computers. This makes visualization an increasingly important tool for researchers to quickly see trends and behavior that may be difficult to identify otherwise – i.e., using standard mathematical or analytical algorithms to process large digitized data sets.1The field of molecular simulation highlights many of these points. In particular, for the simulation of complex systems – e.g., in materials science or biochemistry – the systems under investigation typically have thousands of degrees of freedom, and a single simulation run is easily capable of generating hundreds of gigabytes of data. For complex systems, molecular simulation is increasingly being used to conduct what is best described as ‘computational experiments’, where the system complexity is large enough that simulation results are not necessarily clear from the outset. Researchers often carry out such simulations in the hope of gleaning qualitative insight, usually linked to understanding the mechanism by which a particular molecular ensemble accomplishes its function. It can be a challenge to find appropriate algorithmic descriptors for these qualitative mechanistic insights, especially if they are unknown at the outset. However, by visualizing simulation results, and using what computational chemistry researchers frequently refer to as ‘chemical intuition’, it is often the case that humans are more efficient than computers at identifying qualitative features of a simulation and relating them to the predominant ideas within their subject area. Often, human insight gleaned from visualization of the system subsequently guides development of an appropriate algorithmic descriptor, or guides the setup of subsequent simulations (e.g., to bias the simulations and increase the likelihood that they produce a desired outcome, or to terminate simulations which appear unlikely to yield interesting insight).
Visualization strategies have consequently become an indispensable tool in the arsenal of modern computational chemistry, offering a sort of virtual microscope that lets us see the behavior and dynamics of the atomic and molecular world – both accelerating research insight and facilitating efficient communication between researchers. Most of the time, visualization of molecular simulations takes place ‘off-line’ – i.e., the researcher runs a simulation, and upon conclusion of the simulation, loads the results into a visualization program for viewing, generating snapshots and/or movies. With improved computational architectures, and more efficient software tools, recent years have seen the development of systems with ‘on-the-fly’ visualizations that are dynamically updated while the simulation is running. These systems allow humans to watch simulation progress generated from molecular dynamics (MD) simulations,2 molecular docking,3,4 hybrid structure prediction tools,5 course-grained models,6 and even quantum chemistry methods.7 ‘On-the-fly’ visualization naturally led a number of groups to investigate interactive interfaces for molecular simulation.8 Broadly speaking, there are three levels at which interactivity has been introduced within MD simulations:
(1) Graphics Rendering, giving the user control over a range of parameters controlling both the graphics rendering and viewing perspective. Beyond standard mouse and keyboard interfaces, these systems have utilized a wide range of interface options, including face tracking, stereoscopic displays, and virtual reality gloves.9–13
(2) Simulation parameters, giving the user control over any of a variety of general parameters that impact the molecular simulation's overall propagation algorithm (e.g., temperature, pressure, time step, etc.).14,15
(3) Molecular substituents, where the user can pinpoint particular atoms or functional groups and manipulate them with an external force, thereby ‘steering’ the simulation program's internal propagation, similar to the sort of manipulations which are possible using atomic force microscopy (AFM) experiments.16 Keyboard and mouse interfaces are utilized in such systems,5,17 but the most popular interface has been haptic devices,3,4,7,18–28 which offer up to six degrees of freedom (compared to two for a mouse). As such, they are well suited to facilitating user interaction with 3D molecular simulations. Additionally, the force-feedback that they provide allows users to ‘feel’ the force interactions of a given molecular system.
Initial research efforts into interactive molecular simulations have nearly all been aimed at a single user, to expand the utility of molecular simulation methodologies in both research and educational contexts. For example, exciting early progress using haptic interactive dynamics provided insight into the mechanisms of binding specificity in the enzyme glycerol kinase and transport specificity in the aquaporin membrane channel protein GlpF.29 In this study, the haptic system allowed the researchers to carry out rapid exploration of vast regions of configuration space that would not have been accessible in a conventional simulation. Because haptic devices have not yet become widespread within the consumer market, their use has mostly been confined to specialist institutions devoted to interactive technology and molecular research.
With the design of distributed computing infrastructures to tackle scientific research questions over the last twenty years,30–32 keyboard and mouse interfaces have been widely exploited to allow crowds to participate in a range of research tasks.33,34 For certain tasks, human creativity and judgment can outperform automated classification and search algorithms. Recent years have seen exciting mergers between interactive molecular simulation and ideas within crowd-sourced human–computer interaction. For example, using a ‘gamified’ interface called Foldit, crowds of non-specialists are able to manipulate Rosetta, a protein structure prediction tool with a hybrid approach that utilizes stochastic and deterministic algorithms along with a combination of template assembly, template-based modeling, and all-atom refinement. Recent studies have shown that the strategies Foldit players use to solve complex non-linear optimization problems are distinct from automated algorithms, and sometimes superior.5 In some cases, networked crowds can produce useful new strategies for molecular optimization tasks.35 These exciting studies, at the interface of human–computer interaction, distributed computing, and molecular science, raise the prospect that distributed infrastructures along with new interface technologies can utilize the power of the internet along with crowd intelligence to solve scientific problems, simultaneously engaging the public with fundamental research questions.
In this paper, we outline an integrated hardware setup and algorithmic framework for carrying out interactive MD using depth sensors, which is scalable to an arbitrary number of users and has been adapted to large-scale immersive spaces. The fundamental idea guiding this framework is to utilize new hardware (an array of consumer-priced infrared depth sensors36,37 that utilize structured light38 to carry out real-time 3D imaging) in conjunction with new software that interprets the human form as an energy landscape. Together, the hardware and software provide an interactive interface for embedding users in a molecular simulation, which responds to the real-time motion of their fields. User interaction with the system results in feedback, which has both a visual and audio component: projections or screen displays allow users to see their energy fields embedded within the MD simulation. Simultaneously, we utilize a set of structural and spectral analysis algorithms for detecting transient fluctuations within the ensemble dynamics, for the purposes of sonification.39 At present, all published systems for interactive molecular dynamics have exclusively relied on technologies which focus on a small number (usually one or two) of single interaction points – i.e., the human–computer interaction is usually focused on very specific objects or properties within a simulation, e.g., grabbing, moving, and releasing an atom using a haptic system, or mouse and keyboard events. The system outlined herein is somewhat of a departure from these systems insofar as it focuses on interactions which: (1) are far more nonlocal, allowing the user to interact with large subsets of atoms simultaneously, and (2) do not require tangible intervening objects for the user to interact with the simulation. In this sense, the system described herein builds on ideas first introduced by Myron Krueger, which attempted to go beyond ‘a seated man poking at a machine with his fingers or waving a wand over a data tablet’,40 so that the focus of intention is on the action rather than the technology.
To date, we have referred to this system as ‘danceroom Spectroscopy’ (dS for short). This name might seem unconventional, but it actually has well-defined origins that arise from two different observations. First, chemists and biochemists often utilize dance and choreographic analogies when describing dynamical phenomena in the research literature, a conclusion which can be easily verified by inspecting the titles returned from a simple search for recent articles which contain ‘chemistry’ and ‘dance’ in the title or abstract. A few recent examples are ref. 41–49, which refer variously to ‘molecular dancefloors’,43 ‘single molecule dances’,41 ‘polymer dances’,47 ‘enzyme choreography’,42 ‘radical dances’,48etc. Second, one of the methods utilized by our system to generate audio feedback for the user(s) involves a spectral decomposition technique50 – namely, fast Fourier transform of the ensemble averaged velocity–velocity autocorrelation function, which is discussed in further detail below. dS initially began as a digital art installation, and subsequently found application as the basis for an interactive dance performance, where dancers' motion generates both graphics and sound. In these early stages, our primary emphasis was aesthetic,40,51 and the project received attention in public forums and media outlets across artistic and cultural sectors.
Effective implementation of the dS system relies on a suite of image processing and computer vision algorithms, a heterogeneous programming strategy built from a range of OpenCL GPU-accelerated computer algorithms, as well as algorithms from mixed classical-quantum molecular dynamics and vibrational spectroscopy. In this paper, we rigorously describe, for the first time, the dS framework in sufficient detail for it to be reproducible – including algorithms, technical details, and benchmarking. We also describe two new applications: (1) interactive simulation of Earth's atmosphere, and (2) interactive simulation of the 10-ALA peptide in an explicit water box with preliminary user studies that suggest acceleration of computational sampling by 3–4 orders of magnitude. The success of this system in engaging widely varied audiences in non-traditional contexts (e.g., art, technology, and science education) raises a number of exciting possibilities – perhaps that its aesthetic appeal may be exploited to drive user participation in crowd-sourced molecular dynamics studies: e.g., to accelerate rare event dynamics or to nudge complex molecular systems into rarely visited regions of phase space, providing information that may then be used to map the kinetic microstates of such systems, guided by the sort of ‘chemical intuition’ which is difficult to program into blind search algorithms.
2. Software and algorithms
2.1 Depth images and energy landscapes
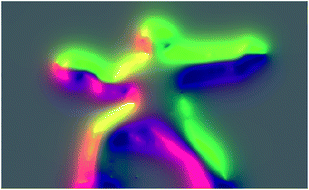
3D capture systems typically return distance-to-target, or depth, z, as a function of pixel position within a two dimensional matrix indexed by pixels that span the x and y direction, as shown in Fig. 1, which was constructed by plotting the 640 × 480 pixel depth image matrix obtained from a Microsoft Kinect sensor. The plot in Fig. 1 shows a human form, where the intensity of the colors is linked to the magnitude of the local gradient vector on the image. The manner in which it is plotted suggests analogy with the concept of an energy landscape, which has become a fundamental idea guiding how chemists and physicists think about both kinetics and dynamics in a range of chemical systems, from small molecules to complex materials and biochemical systems.52,53 An energy landscape is effectively a topological map of a system's potential energy, V, at a range of different configurations. Within any localized region of the energy landscape, the gradient of the energy, dV/dq, relates the topology of the energy landscape to the classical forces felt by a particular molecular configuration. dS interprets people's movements as perturbations on a virtual energy landscape.2.2 Interactive molecular dynamics with depth sensors
In its present form, dS carries out an MD simulation involving N atoms, each of which may move in a virtual coordinate system defined by Cartesian x, y, and z directions. Hamilton's equations of motion, commonly used to discuss the dynamics of molecular systems in both classical and quantum frameworks, provide a useful vantage point for describing how the system works. They are as follows:| dp/dt = −dH/dq, dq/dt = dH/dp | (1) |
 | (2) |
| V = Vint + Vext | (3) |
Like many MD programs, the most computationally expensive aspect of dS is associated with calculating the internal potential energy, Vint. As discussed further below, we have recently implemented a wrapper which allows dS to call the GPU-accelerated OpenMM library whenever a force evaluation is required, allowing a wide range of force interactions, including bonds, angles, torsions, non-bonded Lennard-Jones interactions and electrostatic interactions.54
The external potential energy, Vext, in eqn (3) is calculated as a sum over the difference between a raw depth matrix at time t, Vext(xi,yi,t), and an average background depth image taken without any users in the space, 〈Vext(xi,yi,0)〉, as follows (angled brackets indicate an average):
 | (4) |
In Hamiltonian mechanics, the energy function, H, remains constant for any closed dynamical system, in line with the conservation of energy required by the first law of thermodynamics.55 However, the eqn (2) Hamiltonian is not subject to this constraint because of the Vext term, which effectively makes the system open rather than closed. Fluctuations in the depth data arise as a consequence of noise in the depth images, and also from people's motion within the space mapped by the depth sensors. Both of these effects result in fluctuations of the total system energy, introducing significant instabilities into the Velocity Verlet55 scheme used to propagate the time-dependent system dynamics in eqn (1). Such instabilities are a consequence of the fact that depth images, unlike standard molecular force fields, can give large forces which are not smoothly varying in time and space. Standard dynamics propagation schemes (utilizing reasonably sized time steps), which usually rely on being able to express the force as a low-order Taylor series expansion, are not always well-equipped to deal with the ill-behaved forces that arise from an interactive simulation. This can lead to explosions in the dynamical propagation as a consequence of rapid numerical error accumulation. To address this, and avoid the numerical explosions associated with such instabilities, we have implemented a modified Berendsen thermostat (described in detail in the ESI†), in which the atomic velocities are scaled by some factor λ to ensure that the instantaneous system temperature Tt approaches some desired temperature T0 with a first order rate
 | (5) |
Eqn (5) depends on a user-specified rate coefficient (1/τ) and how far the system is from T0. We found the standard Berendsen scheme to be unreliable for ensuring the stability of dS when exposed to users. Stability was considerably improved by looping over the atomic velocities to ensure that none of the atoms within the simulation have a velocity more than two standard deviations larger than the average atomic velocity (prior to determining the value of Tt required for calculating the atomic velocity scale factor λ). This procedure then gives a good compromise between computational efficiency, interactive fluidity, and system stability. It eliminates numerical instabilities that can arise when user motion suddenly ‘injects’ energy into the system Hamiltonian.
2.3 Smooth interactivity: frozen Gaussian dynamics
The vector of forces acting on a set of atoms F(t), can be written in terms of the system's potential energy – i.e.:| F(t) = −dH/dq = −dV/dq | (6) |
Substituting eqn (3) into eqn (6) gives
 | (7) |
For the purposes of translating the depth map shown in Fig. 1 to external forces that act on those simulated atoms, there are two important differences between depth maps and the sorts of energy landscapes typically utilized in molecular simulation – both of which present complications. First, molecular energy landscapes represent space as a continuum; whereas depth matrices are discretized into pixels with a finite spatial extent. Second, whereas molecular energy landscapes are generally well-behaved, continuously differentiable functions, this is not necessarily the case for depth matrices. For example, Fig. 1 illustrates the abrupt change in the z-coordinate that distinguishes the human from the background. In our setup, we have found that discontinuity in depth images generally arises for a number of reasons: (1) there are abrupt changes in the ‘distance-to-target’ for different components of a particular scene; (2) depth capture for a particular scene is incomplete owing to particular objects within the scene casting an infrared shadow; and (3) as a result of random noise in the depth image, which may have any of several origins, including variations in the infrared light source, variations in detector response, and variations in the optical environment.
Initially, our intention was to propagate the system dynamics using eqn (1) with a purely classical approach, i.e., the atoms represented as point particles, and purely local forces acting on any given atom, from both Fint and Fext. However, this approach resulted in choppy motion, unsatisfactory interactivity, and numerically unstable dynamics simulations. The cause of these problems arose for the reasons outlined above, and their subsequent effects on Fext. Achieving more fluid dynamics with improved interactivity and stability required that we introduce some sort of non-locality into our dynamics propagation strategy, so that Fext depended on a local average within the space of the pixels. To incorporate this averaging in an efficient manner, we implemented an algorithm inspired by the so-called ‘frozen Gaussian’ approach to semiclassical dynamics,56 which forms the basis for a number of approaches that approximately model the quantum dynamics of molecular systems. dS has two distinct coordinate spaces: (1) the Cartesian simulation space spanned by qx, qy, and qz, denoted by the vector q, where atom i has a position [qix, qiy, qiz]; and (2) the depth image pixel coordinate space spanned by rx and ry, in which each atom i is characterized by its centre [rcix, rciy]. The external forces acting on atom i as a result of the rx and ry directions of pixel space are obtained by integrating over a Gaussian function Gi(rx,ry) as follows:
 | (8) |
 | (9) |
 | (10) |
Compared to eqn (8), which requires evaluating the gradient of dVext with respect to driα, eqn (10) only requires evaluation of Vext, for which fast numerical interpolation routines are available using software libraries associated with OpenCL image types. Accurately solving integrals like those in eqn (10) may be accomplished using numerical methods like Gauss–Hermite quadrature. However, an accurate and efficient Gauss–Hermite quadrature implementation depends on being able to represent Vext with relatively low order polynomial functions, and this is not always the case with the images returned from user interaction with a depth sensor. In practice, eqn (10) is evaluated numerically over a tiled set of squares with dimensions Δx·Δy, with equally spaced centre points that lie within ±3σ of rciα, i.e.:
 | (11) |
Two key parameters in eqn (11) are the Gaussian width parameter σ and the number of tiles used for integration (both of which then determine Δx·Δy). We typically set σ to be equal 10, giving a grid of 30 × 30 points, which generally gives smooth interactivity and satisfactory user control over the simulation. A grid of this size will be nearly three orders of magnitude more expensive than a purely local approach, where the force acting on a particular atom is determined by the numerical gradients calculated from only those pixels adjacent to that which contains [rcix, rciy]. However, by saving the image as a byte array, and handling it as an OpenCL image texture, we have been able to speed up this calculation enough that it is not a significant bottleneck, as discussed in further detail below.
2.4 System design and implementation
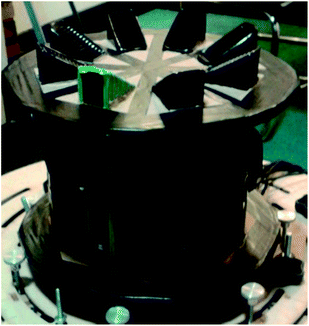
A schematic of the dS setup is shown in Fig. 2. The multi-sensor array is shown in the figure, with depth capture from only three sensors, and graphics output to three displays. A flow chart breaking down data flow and system execution is shown in Fig. 3. Below, we detail the different aspects of the system, beginning with the optical mount that enables depth capture.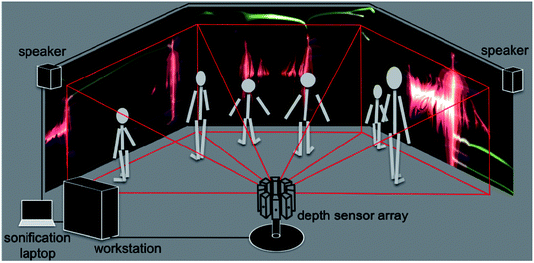 | ||
| Fig. 2 Schematic of the dS setup. An array of eight depth sensors is shown; however for the sake of simplicity, we have only shown image capture from three sensors, and rendering to three screens. | ||
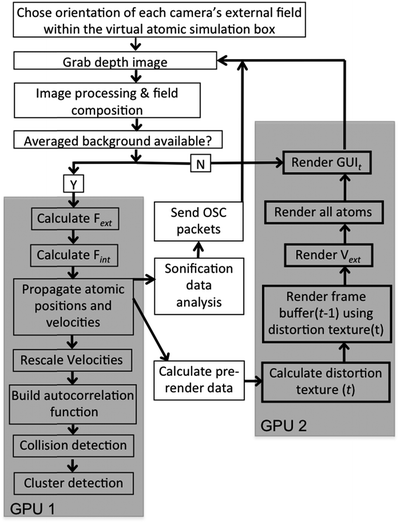 | ||
| Fig. 3 Flow chart showing system operation. The grey blocks indicate those portions of the system that we accelerated on GPUs; the remaining functionality is executed on the CPU. | ||
The workstation runs code which is written in C# (∼50![[thin space (1/6-em)]](https://www.rsc.org/images/entities/char_2009.gif) 000 lines) built on Windows 7 in Visual Studio 2010. The code interface to the depth sensors utilized the OpenNI C# wrappers. Graphics rendering was carried out using DirectX 11. Code ported to the GPUs for accelerated compute operations utilized the OpenCL programming language. We devoted considerable effort to making the code general, flexible, and user-friendly so that important parts of the system can be modified directly by non-specialists. In addition to giving the user control over all of the graphics parameters described below, the multi-tab GUI allows real-time control over several other aspects of the system, including: depth matrix capture, image processing, background calibration; relative orientation, position, and blending of each camera's depth matrix within the composite field that makes up Vext; and parameters important to the sonification algorithms described below.
000 lines) built on Windows 7 in Visual Studio 2010. The code interface to the depth sensors utilized the OpenNI C# wrappers. Graphics rendering was carried out using DirectX 11. Code ported to the GPUs for accelerated compute operations utilized the OpenCL programming language. We devoted considerable effort to making the code general, flexible, and user-friendly so that important parts of the system can be modified directly by non-specialists. In addition to giving the user control over all of the graphics parameters described below, the multi-tab GUI allows real-time control over several other aspects of the system, including: depth matrix capture, image processing, background calibration; relative orientation, position, and blending of each camera's depth matrix within the composite field that makes up Vext; and parameters important to the sonification algorithms described below.
Once the background is available, the system begins solving the aforementioned equations of motion for an ensemble of atoms whose initial geometry and force field connectivity are specified by the user. System stability is ensured by rescaling the atomic velocities as detailed in eqn (5) above. Propagating the coordinates and velocities of each atom in the ensemble requires evaluating both Fint and Fext. Fint may be evaluated using one of two approaches: (1) our own GPU-accelerated algorithms which include non-bonded Lennard-Jones, bonding, and angle terms; or (2) the OpenMM GPU accelerated software library, called from our code using a set of fast C# wrappers. Evaluating Fext requires grabbing depth matrices from each sensor, integration of these depth matrices into a composite Vext, and application of the frozen Gaussian equations described in eqn (8)–(11). Both Fint and Fext are evaluated at a rate of 60 Hz, while depth matrix grabs occur at either 30 or 60 Hz, which are the operational frequencies of the depth sensors.
Important physics parameters which the user can interactively modify include: (1) the scaling factor Ci which determines whether an atom's motion is affected by Vext, whether Vext is attractive or repulsive, and how strongly Vext affects the atomic dynamics; (2) σ, which determines any given atom's Gaussian width over Vext; (3) T0, the desired temperature of the ensemble; and (4) τ, which determines how strongly the thermostat drives the ensemble to T0 at each dynamics step. It is also possible for ‘one-click’ switching between different molecular simulations.
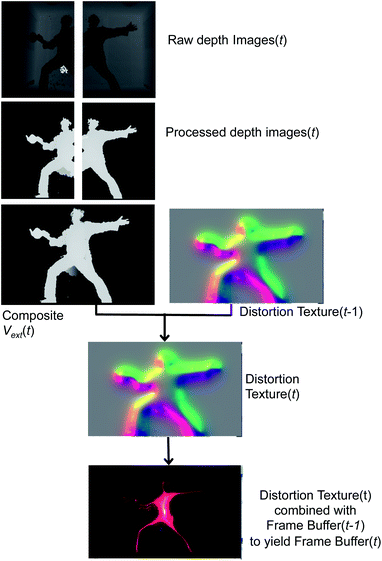
Fig. 5 begins with two raw depth images obtained from the sensors. The background from each image is subsequently subtracted, and then processed with a hole-removing occlusion algorithm from OpenCV.57 Using linear blending at the edges of each image, the processed depth images are then combined to form the composite external field in eqn (4). Vext may then be directly rendered to the frame buffer by mapping it into any of a number of color palettes, which the dS operator may interactively select. This direct rendering results in rather literal silhouettes of users as they perturb Vext.
Other graphics renderings of the users embedded in the simulation are obtained by applying a distortion texture to Vext prior to its rendering in the frame buffer at time t. The distortion texture, shown in Fig. 5, is effectively a measure of the extent of local variations within Vext: large gradients in Vext give small values in the distortion texture, and small gradients give small values within the distortion texture. The distortion texture at time t is calculated by adding the 2D gradient of Vext to the previous distortion texture from time t − 1. The final rendered frame buffer is then obtained by combining the time t distortion texture with the time t − 1 frame buffer. The frame buffer itself is actually constructed from two buffers: a Vext buffer and an atom rendering buffer. Feeding forward the distortion texture and frame buffers in the fashion described above is important for creating dynamic distortion effects which react to user motion, and has obvious analogues with a Velocity Verlet dynamics propagation strategy.
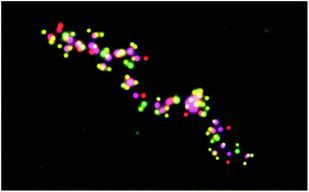
In the same way that dS allows users interactive control of important physics parameters, it also allows control over a range of graphics parameters related to rendering of both Vext and the atoms within the final frame buffer, to tailor the dS graphics output as they like. In addition to being able to select the colors used in graphics rendering, the user may control how strongly the distortion texture is applied, how strongly the distortion texture and frame buffer from time t − 1 are fed forward to those at time t, and the intensity of Vext. There are an enormous number of graphics parameter combinations, each of which produces distinctly different graphical states, one of which is shown in Fig. 5, and others which are shown throughout this article. Extending the atomic rendering options available in dS is an active area of development, as discussed below. At present, the atomic rendering in dS utilizes circles and spheres, whose colors may be selected according to a range of criteria. For example, Fig. 6 shows a dS image of the 10-ALA peptide embedded in an explicit solvent comprised of water molecules. A particularly useful aspect of dS's graphics capabilities is a tool which allows the user to interactively magnify the atomic resolution to whatever zoom level he or she desires, and thereby focus on particular parts of a molecular system.
The simplest form of sonic feedback involves collision detection between non-bonded atoms. Collisions between non-bonded atoms are triggered by analyzing the distances rij, and are counted as having occurred if rij(t − 2) > rij(t − 1), rij(t − 1) < rij(t), and rij(t) < σ21/6, where σ is the Lennard-Jones van der Waals radius. Each collision is transmitted as an OSC message indicating the collision coordinates, velocity and atom type, which is used to trigger an arbitrary sound. Collision data is very high resolution, and fluctuates on fast timescales. From the perspective of audio composition, it is best suited to small numbers of atoms (i.e., less than 250). Otherwise, it can grow cacophonous. It is possible for the dS operator to interactively specify a filter on the maximum number of collisions per time step which are transmitted; however, this can diminish user perceptions of interactivity.
Second, we have developed a clustering algorithm which performs analysis of the ensemble coordinates and detects the formation of stable atomic clusters, tracking their average position, velocity, and size. Since the algorithm is sensitive to the particulars of the simulation (e.g., number of atoms, interactions per unit time, Tt, and Ci), the dS software allows interactive modulation of parameters which impact algorithm performance.
Third, we measure the spectrum of the atomic ensemble, allowing us to track periodic atomic motion, arising from both the intrinsic atomic dynamics as well as periodic perturbations in the external field caused by human movement. The algorithm we use to accomplish this relies on maintaining a moving time history of the atomic velocity vector, v, to calculate the velocity autocorrelation function (VAC), defined as:
| VAC(t) = v(t + t0)·v(t0) | (12) |
 | (13) |
2.5 Performance and system latency
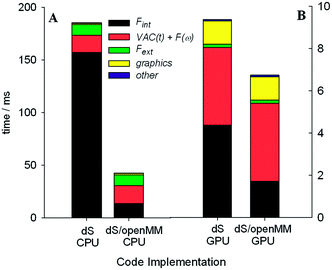
Our target refresh rate for frame rendering and dynamics propagation is 60 Hz (17 ms latency), with an allowed minimum of 30 Hz (33 ms latency). For the sake of fluid interactivity, it is more important for fluctuations in the refresh rate to be small, even if it drops to slightly less than 60 Hz. With serial CPU power alone, meeting the 60 Hz target limited us to interactive dynamics within fewer than 3000 atoms on a single display setup, using a single depth sensor. In immersive 360° environments, however, where there is significant additional computational overhead involved rendering on up to six graphics displays and capturing depth matrices from up to ten sensors, the serial CPU implementation suffered serious performance setbacks, and reduced by 1–2 orders of magnitude the number of atoms which we could typically simulate at the desired refresh rate. The GPU acceleration scheme outlined in Fig. 3 allowed us to considerably improve the system performance in 360°, and also led to corresponding performance enhancements in more conventional setups: i.e., with a single display and fewer sensors. GPU acceleration was carried out by profiling our code and subsequent use of OpenCL to accelerate the most intensive computational tasks on the NVIDIA GTX Titan as shown in Fig. 3. The AMD HD7970 we reserved solely for GPU-accelerated DirectX graphics rendering over multiple video outputs.To better characterize and understand the performance of the dS code, we carried out a range of profiling tests (shown in Fig. 7 and 8) using an MD simulation box (volume of 572![[thin space (1/6-em)]](https://www.rsc.org/images/entities/char_2009.gif) 280 Å3) with 917 O2 molecules, 3654 N2 molecules, 98 CO2 molecules, and 194 H2O molecules (ratios which approximately correspond to the molecular composition of the terrestrial troposphere). These tests utilized two depth sensors and two output displays. Fint was calculated using the parameters from the MM3 force field: Lennard-Jones for the non-bonded terms, bonding terms which included anharmonicity up to fourth order, and angle terms which included anharmonicity up to sixth order. Force constants for bonds and angles were chosen so as to approximately reproduce the vibrational frequencies of these molecules from vibrational spectroscopy experiments (published online in the NIST Chemistry WebBook).
280 Å3) with 917 O2 molecules, 3654 N2 molecules, 98 CO2 molecules, and 194 H2O molecules (ratios which approximately correspond to the molecular composition of the terrestrial troposphere). These tests utilized two depth sensors and two output displays. Fint was calculated using the parameters from the MM3 force field: Lennard-Jones for the non-bonded terms, bonding terms which included anharmonicity up to fourth order, and angle terms which included anharmonicity up to sixth order. Force constants for bonds and angles were chosen so as to approximately reproduce the vibrational frequencies of these molecules from vibrational spectroscopy experiments (published online in the NIST Chemistry WebBook).
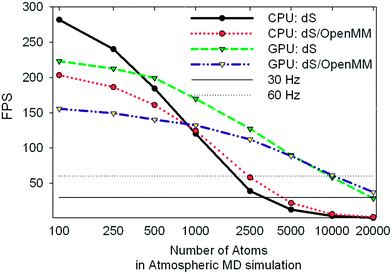 | ||
| Fig. 8 Benchmark data showing frames per second obtained for the same tests described in Fig. 7. The 30 and 60 Hz limits are shown for reference. | ||
We tested two different implementations of dS: the first utilized our own OpenCL accelerated routines for evaluating the Fint terms listed above, and the second utilized a wrapper around OpenMM, to test the performance of its own OpenCL routines for evaluating Fint. The components of Fint described above are not available by default in OpenMM, and were specified using customized OpenMM syntax that allows users to specify their own force terms. Each implementation was tested on two different architectures for parallelizing calculation of Fint: (1) utilizing the GTX Titan GPU and (2) utilizing our hexacore Intel i7 3.2 GHz CPU.
One of the most significant and well-known efficiency bottlenecks in molecular dynamics arises from calculating non-bonded interactions in the internal force vector Fint, which have a formal scaling that is quadratic with system size (i.e., N(N − 1)/2, where N is the number of atoms in the simulation). Fig. 7a and 7b confirm that calculating Fint is indeed one of the largest computational costs in all the tests that we ran, with an expense that is comparable to the costs associated with image capture, graphics rendering, and calculation of Fext. VAC and collision detection, both of which have a formal scaling that is quadratic with system size, can account for up to 57% of the execution time in the dS/OpenMM GPU configuration. Fig. 8 shows that, for small simulations (less than 1000 atoms on the CPU, and less than 5000 atoms on the GPU), the dS OpenCL routines are faster for calculating Fint than the corresponding OpenMM wrappers. For larger numbers of atoms, OpenMM has a factor of 2–3 better performance as a result of the internal protocol it uses for handling non-bonded interactions, which has improved scaling with system size. Comparison of Fig. 7a and 7b, along with Fig. 8, shows that parallelization of the non-bonded force evaluations on the GPU considerably improves the performance for simulations with larger numbers of atoms. Fig. 7a and 7b show that the GPU-parallelized dS code is nearly a factor of 35 faster than the corresponding CPU-parallelized code. This dramatic speed-up arises in part from the fact that we have mostly focused our efforts on optimizing the code for the GPU rather than the CPU, preferring recomputing rather than data storage (e.g., in the distances required to calculate non-bonded force terms), and also optimizing for local memory access. OpenMM, on the other hand, has better performance portability, with the CPU implementation a factor of 8 slower than the GPU implementation. Fig. 7b demonstrates the power of the GPU-parallelized dS/OpenMM code: a single frame requires ∼7 ms, well within our 17 ms target.
3. Preliminary applications
3.1 Atmospheric simulation in 360°
As discussed above, the efficiency of the dS/OpenMM interface allows us to run the atmospheric simulation described above, and leaves adequate time for additional computational tasks. In 360° immersive environments, these requirements are formidable, since they involve capture from multiple depth sensors, integration of these depth matrices into a single composite field, blending of the render data to accommodate non-linear surfaces, and subsequent output to six displays (five displays within the dome, and one control screen). Saving the composite field as a byte array, and passing it to the GPU as an OpenCL image cuts the time required to transfer the external field image from the CPU to the GPU by a factor of four, and furthermore, the OpenCL image type takes advantage of several member functions which exploit the GPU architecture features: (1) texture cache, in which pixel requests cause the GPU to cache neighboring pixels in the vicinity; (2) fast bilinear interpolation at arbitrary points within the image; and (3) efficient out of bounds handling.The most intensive application which we have recently run using dS is a 360° interactive MD simulation with the atmospheric setup described in section 2.5, a photograph of which is shown in Fig. 9. This simulation was used to teach general principles of chemical dynamics and atmospheric chemistry to high-school students, including: atmospheric composition, atomic and molecular force interactions, collision theory, energy transfer, the relationship between temperature and molecular degrees of freedom (rotations, translations, and vibrations), and vibrational spectroscopy. Sonification of the atmospheric simulation using eqn (13) lets students ‘hear’ the differences in the vibrational periods of different molecules, providing qualitative insight into their infrared absorption, and corresponding radiative forcing efficiencies. The format in which these activities took place consisted of four 10-minute lectures, with 15 min in between lectures for the students to undertake guided and unguided interaction with the system.
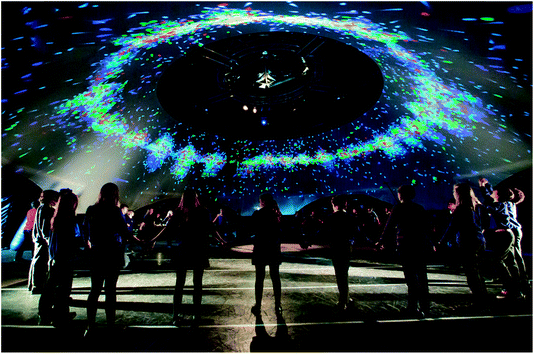 | ||
| Fig. 9 Interactive atmospheric molecular dynamics simulation in an immersive 21 m 360° projection dome, run as part of a recent chemistry and physics education event held in Bristol, UK. The array of depth sensors shown in Fig. 4 is located in the centre of the dome, but is hidden behind one of the students in the foreground. Approximately 20 students are holding hands in a circle around the dome. The result is a dynamic ring of molecules attracted to their fields on the surrounding projection screens. (Photo by Paul Blakemore). | ||
Assessing outcomes of the atmospheric simulation shown in Fig. 9 is difficult, since there was no specific user ‘task’ to measure; rather, the goal was to utilize dS in order to educate high-school students about molecular dynamics. In an attempt to assess the quality of the interactive experience, we obtained feedback from 67 of the student attendees, and obtained the following results: 76% of respondents said that they had fun; 81% indicated that the interaction helped them better understand the lecture content; and 86% indicated that the event would help them with their upcoming science exams. One of the most consistent criticisms was that more time should have been reserved for the students to interact with the dS system, with a more varied range of molecular simulations beyond the atmosphere.
3.2 Peptide chaperones
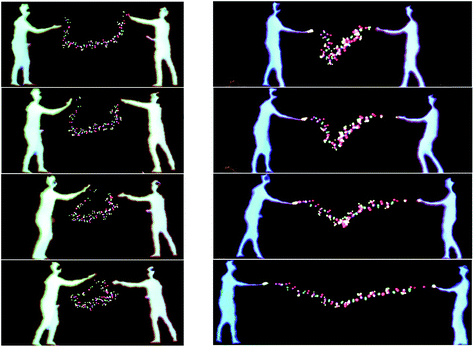
The largest simulation we have run using the dS/OpenMM code is for a 298 K simulation of the 10-alanine peptide explicitly embedded in 8296 TIP3P H2O molecules in a box with volume 249![[thin space (1/6-em)]](https://www.rsc.org/images/entities/char_2009.gif) 600 Å3, giving a density of 1 g cm−3. The peptide simulation was fully flexible, carried out using the algorithms described above, with a time step of 0.1 fs. The LEaP program in Amber 1261 was used to design the 10-Alanine system and the Amber ff99SB were used to define the OpenMM force fields. Standard harmonic potentials were applied to the bond and angle interactions, while periodic functions were used to describe the dihedral potential energy. Electrostatic interactions were handled using a reaction field with a cutoff distance of 10 Å. Lennard-Jones interactions were truncated at the same distance. Fig. 10 shows two users embedded in the aforementioned simulation, cooperatively using their energy fields to chaperone the 10-ALA peptide. The solvent dynamics are unaffected by the users; only the atoms in the peptide feel the users' energy fields. In the example shown, the users alternately form the peptide into a loop, and subsequently stretch it out again. This is a prototypical rare-event process for which the kinetics and free energy have been investigated in detail during previous work,62,63 some of which was carried out by one of us.64–66 Previous workers have described systems which allow multiple users to manipulate molecular visualization viewing perspectives;67 however, to the best of our knowledge, Fig. 10 presents the first platform which allows multiple users to actually manipulate the molecular dynamics.
600 Å3, giving a density of 1 g cm−3. The peptide simulation was fully flexible, carried out using the algorithms described above, with a time step of 0.1 fs. The LEaP program in Amber 1261 was used to design the 10-Alanine system and the Amber ff99SB were used to define the OpenMM force fields. Standard harmonic potentials were applied to the bond and angle interactions, while periodic functions were used to describe the dihedral potential energy. Electrostatic interactions were handled using a reaction field with a cutoff distance of 10 Å. Lennard-Jones interactions were truncated at the same distance. Fig. 10 shows two users embedded in the aforementioned simulation, cooperatively using their energy fields to chaperone the 10-ALA peptide. The solvent dynamics are unaffected by the users; only the atoms in the peptide feel the users' energy fields. In the example shown, the users alternately form the peptide into a loop, and subsequently stretch it out again. This is a prototypical rare-event process for which the kinetics and free energy have been investigated in detail during previous work,62,63 some of which was carried out by one of us.64–66 Previous workers have described systems which allow multiple users to manipulate molecular visualization viewing perspectives;67 however, to the best of our knowledge, Fig. 10 presents the first platform which allows multiple users to actually manipulate the molecular dynamics.
The sequence shown in Fig. 10 took approximately five minutes in real-time.68 In addition to the multi-user interaction framework shown in Fig. 10, manipulation of the peptide structure by a single user (as occurs with haptic devices) is also possible. For example, Fig. 11 shows how it is possible for a single user to use their hands to manipulate the 10-ALA peptide's energy landscape. To evaluate more systematically the efficiency with which users were able to manipulate the peptide, we carried out a limited number of tests on two different user groups: experts (those who were involved in writing the code and building the system), and novices (users with little experience of the dS interfaces, and in some cases, little experience of video games and molecular simulation). These two user groups were taken as representative limiting cases. The mean number of time steps (± standard deviation) required for expert users to chaperone the peptide from a stretched to a loop configuration was 5961 ± 619 (596.1 ± 61.9 fs), compared to 11![[thin space (1/6-em)]](https://www.rsc.org/images/entities/char_2009.gif) 093 ± 4923 time steps (1109.3 ± 492.3 fs) for novices. The mean number of steps required for going from a looped to a stretched configuration was 7918 ± 2158 time steps (791.8 ± 215.8 fs) for expert users and 7831 ± 2216 time steps (783.1 ± 221.6 fs) for novice users. To determine the time scale for spontaneous loop formation, we ran simulations under identical conditions with no user input. Over 2.65 × 10⁶ time steps (2.65 × 10⁵ fs), we were unable to observe a single loop formation event. Our failure to observe a single folding event over this timescale is compatible with previously published results obtained using a 10-alanine implicit solvent model where the average time to loop formation was determined to be on the order of (0.943 ± 0.160) × 106 fs.65,69 Not including the additional computational tasks (i.e., beyond the calculation of Vint), the timescale for loop formation in the chaperoned simulations is between 3–4 orders of magnitude faster than that for spontaneous loop formation.
093 ± 4923 time steps (1109.3 ± 492.3 fs) for novices. The mean number of steps required for going from a looped to a stretched configuration was 7918 ± 2158 time steps (791.8 ± 215.8 fs) for expert users and 7831 ± 2216 time steps (783.1 ± 221.6 fs) for novice users. To determine the time scale for spontaneous loop formation, we ran simulations under identical conditions with no user input. Over 2.65 × 10⁶ time steps (2.65 × 10⁵ fs), we were unable to observe a single loop formation event. Our failure to observe a single folding event over this timescale is compatible with previously published results obtained using a 10-alanine implicit solvent model where the average time to loop formation was determined to be on the order of (0.943 ± 0.160) × 106 fs.65,69 Not including the additional computational tasks (i.e., beyond the calculation of Vint), the timescale for loop formation in the chaperoned simulations is between 3–4 orders of magnitude faster than that for spontaneous loop formation.
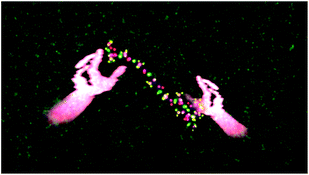 | ||
| Fig. 11 The same as Fig. 10, except that a single user's hands are shown manipulating the peptide. | ||
4. Conclusions
In this paper, we have outlined a new immersive high-performance framework for carrying out interactive molecular dynamics using arrays of consumer-priced depth sensors scalable up to 360° immersive spaces. The fundamental idea driving the system lies in interpreting the human form as an energy landscape, and subsequent embedding of that energy landscape in a real-time molecular dynamics simulation. The system allows multiple users to simultaneously chaperone a molecular dynamics simulation, and relies on a suite of GPU-accelerated algorithms to accomplish the following tasks at 60 Hz: depth sensor image processing, construction of a composite external field, graphics rendering, and evaluation of the internal forces. The flexibility of our platform has been considerably enhanced by wrappers that facilitate fast communication with the GPU-accelerated routines available in OpenMM.In addition to educational applications, initial tests utilizing this new system show that both expert and novice users have been able to use it to accelerate peptide rare event dynamics by 3–4 orders of magnitude. This massive acceleration is substantially larger than the additional (factor of 2) computational expense incurred through the additional computational overhead required by the system. This raises the exciting prospect that this system may be exploited to accelerate the sampling of states that are otherwise visited only rarely in simulations of complex molecular systems. For example, if we imagine several simultaneous instances of dS being run by a range of users (with a system in place for uploading data to a central analysis server), it may be possible to quickly identify important kinetic hubs and traps within a given biomolecule's conformational space.70,71 During interactive journeys through molecular configuration space, users would have a higher statistical likelihood of visiting hubs and traps compared to other configurations.
A second exciting possibility for such a system is that it could be exploited to accelerate finding dynamical pathways through configuration space. This is a significant challenge for conventional simulation methodologies, especially when seeking pathways that are difficult to describe using standard order parameters and progress variables. A particularly tantalizing prospect is that users will be able to efficiently generate complex pathways that would be difficult to generate otherwise (i.e., using blind search algorithms or acceleration schemes with simple progress parameters), allowing us to build kinetic network maps of complex molecular systems (e.g., Markov state models,72 master equation models,73 or BXD models66), and obtain time constants and rate coefficients that could be directly compared with experiment. Quick qualitative discrimination between paths could likely be achieved through simply analyzing the difference between the cluster of highest and lowest energy points along a path, giving an effective path barrier. Quantitative path discrimination achieving such an outcome would require a reliable means for unbiasing the user-generated pathways, and could be achieved by subsequent analysis of the user-generated path using any of a range of methods, including transition path sampling,74 the string method,75 the nudged elastic band approach,76 or BXD.64 Coupling user-generated pathways to the above methods may be a subject worth investigating in its own right, given that generating an initial dynamical pathway is often a non-trivial challenge for these methods.
In both cases discussed above – conformational sampling, and path sampling – one could imagine a ‘scoring’ function which rewarded users for finding new low-energy states or new low-energy pathways. The idea behind such a gamified approach would be twofold: first, to incentivize users' improving their chemical intuition with increased playing, so that they develop an increasingly good feel for the conformational and dynamical preferences of complex systems; and second, to quickly sample a wider range of user intuition. Reasons for optimism that the dS system might provide a crowd-sourced platform for tackling research questions include the fact that: (1) the dS system utilizes commodity hardware; (2) when it has been deployed in an educational context, it has shown the ability to engage students well, and received positive responses, and (3) its aesthetic merit has been recognized by installations in major international art and cultural institutions.
To date, attempts at molecular dynamics have largely utilized interaction strategies focused on a very small number of local interaction sites – i.e., keyboards, mice, and haptic devices. These technologies allow precise control over particular atomic components of a given system. dS, on the other hand, facilitates interactions which are significantly more nonlocal. For example, users can interact with and manipulate large subsets of atoms, and have the ability to control which of the atoms in a particular system will respond to their ‘energy fields’. In this respect, it is worth investigating whether a system like dS is better suited to coaxing molecular systems to undergo large-scale conformational changes, or to follow complex reaction coordinates which require the concerted motion of large subsets of atoms.
In future work, we hope to address a range of pertinent issues required to extend system performance, and thereby increase its utility. These include: (1) using more than two GPUs to enhance overall system performance; (2) increasing the portability of the system so that it can run on a range of platforms (e.g., Mac/Linux using OpenGL), and so that it is optimized over a range of different CPU/GPU architectures; (3) calculating z-direction forces from users' energy fields using a time history of Vext in the ±z direction; (4) expanding the available rendering options to accommodate stereoscopic rendering, and to easily recognize molecular features like α-helices and β-sheets; (5) investigating the use of a new generation of depth sensors (i.e., LEAP) which are specifically tailored to accurate hand tracking; (6) extension of the methodologies described in this paper to include coarse-grained approaches; (7) investigating additional means for how best to use audio feedback to provide useful insight into simulation progress; (8) testing additional high-performance strategies to further increase the speed of force evaluations on the GPU;77 (9) detailed user studies to understand how to best exploit and improve nonlocal interaction strategies in the case of molecular simulation – i.e., whether it is possible to define a set of human actions that correspond to molecular structural changes; and (10) investigating whether the form of nonlocal interaction employed by dS may be productively combined with more local interaction approaches, to exploit the best of both. Tackling these challenging problems will require an interdisciplinary approach with expert input from researchers across a range of fields including computational chemistry, computer science, human computer interaction, and human aesthetics.
Acknowledgements
DRG acknowledges funding as a Royal Society research fellow. DPT acknowledges funding as a Royal Society research fellow. DJC acknowledges a studentship from the EPSRC. Additional support has been provided through EPSRC grant EP/I017623/1, the University of Bristol, the Royal Society of Chemistry, NVIDIA, the Watershed Digital Media Centre, the University of the West of England, and Arts Council England. A full list of contributors to the dS project can be found at www.danceroom-spec/peopleReferences
- K.-L. Ma, SIGGRAPH Comput. Graph., 2004, 38, 4–7 Search PubMed.
- R. Kobler, T. Kockerbauer, U. Omasits, M. Neumann, W. Schreiner and J. Volkert, Computer Aided Systems Theory‚ EUROCAST 2007, 2007, pp. 443–447 Search PubMed.
- G. A. Dalkas, D. Vlachakis, D. Tsagkrasoulis, A. Kastania and S. Kossida, Briefings Bioinf., 2013, 14, 745 CrossRef PubMed.
- X. Hou and O. Sourina, in Transactions on computational science XII, Springer, 2011, pp. 98–117 Search PubMed.
- S. Cooper, F. Khatib, A. Treuille, J. Barbero, J. Lee, M. Beenen, A. Leaver-Fay, D. Baker, Z. Popovic and F. Players, Nature, 2010, 466, 756–760 CrossRef CAS PubMed.
- O. Delalande, N. Ferey, G. Grasseau and M. Baaden, J. Comput. Chem., 2009, 30, 2375–2387 CrossRef CAS PubMed.
- M. P. Haag and M. Reiher, Int. J. Quantum Chem., 2013, 113, 8–20 CrossRef CAS.
- T. Schlick, Biophys. J., 2003, 85, 1–4 CrossRef CAS.
- S. Park, J. Lee and J. I. Kim, Computational Science and Its Applications‚ÄìICCSA, 2005, 2005, 183–196 Search PubMed.
- W. Humphrey, A. Dalke and K. Schulten, J. Mol. Graphics, 1996, 14, 33–38 CrossRef CAS.
- M. Krone, K. Bidmon and T. Ertl, IEEE Trans. Visualization Comput. Graphics, 2009, 15, 1391–1398 CrossRef PubMed.
- M. Patriarca, A. Kuronen, M. Robles and K. Kaski, Comput. Phys. Commun., 2007, 176, 38–47 CrossRef CAS PubMed.
- T. J. Callahan, E. Swanson and T. P. Lybrand, J. Mol. Graphics, 1996, 14, 39–41 CrossRef CAS.
- P. Knoll and S. Mirzaei, Rev. Sci. Instrum., 2003, 74, 2483–2487 CrossRef CAS PubMed.
- D. Rapaport, Phys. A, 1997, 240, 246–254 CrossRef CAS.
- S. Izrailev, S. Stepaniants, B. Isralewitz, D. Kosztin, H. Lu, F. Molnar, W. Wriggers and K. Schulten, in Computational molecular dynamics: challenges, methods, ideas, Springer, 1999, pp. 39–65 Search PubMed.
- M. C. Surles, J. S. Richardson, D. C. Richardson and F. P. Brooks, Protein Sci., 1994, 3, 198–210 CrossRef CAS PubMed.
- A. Bolopion, B. Cagneau, S. Redon and S. Regnier, Haptic molecular simulation based on force control, IEEE Conference on Advanced Intelligent Mechatronics, 2010, pp. 329–334 Search PubMed.
- J. Stone, A. Kohlmeyer, K. Vandivort and K. Schulten, Advances in Visual Computing, 2010, 382–393 Search PubMed.
- J. E. Stone, J. Gullingsrud and K. Schulten, presented in part at the Proceedings of the 2001 symposium on Interactive 3D graphics, 2001 Search PubMed.
- M. Dreher, M. Piuzzi, A. Turki, M. Chavent, M. Baaden, N. Ferey, S. Limet, B. Raffin and S. Robert, in 2013 International Conference on Computational Science, ed. V. Alexandrov, M. Lees, V. Krzhizhanovskaya, J. Dongarra and P. M. A. Sloot, 2013, vol. 18, pp. 20–29 Search PubMed.
- Y. G. Lee and K. W. Lyons, Comput.-Aided Des., 2004, 36, 75–90 CrossRef.
- A. Ricci, A. Anthopoulos, A. Massarotti, I. Grimstead and A. Brancale, Future Med. Chem., 2012, 4, 1219–1228 CrossRef CAS PubMed.
- M. Stocks, S. Laycock and S. Hayward, J. Comput.-Aided Mol. Des., 2011, 25, 203–211 CrossRef CAS PubMed.
- A. M. Wollacott and K. M. Merz, J. Mol. Graphics Modell., 2007, 25, 801–805 CrossRef CAS PubMed.
- A. Ricci, A. Anthopoulos, A. Massarotti, I. Grimstead and A. Brancale, Future Med. Chem., 2012, 4, 1219–1228 CrossRef CAS PubMed.
- M. P. Haag, K. H. Marti and M. Reiher, ChemPhysChem, 2011, 12, 3204–3213 CrossRef CAS PubMed.
- O. B. Bayazit, G. Song and N. M. Amato, Ligand binding with OBPRM and user input, IEEE International Conference on Robotics and Automation, 2001, pp. 954–959 Search PubMed.
- P. Grayson, E. Tajkhorshid and K. Schulten, Biophys. J., 2003, 85, 36–48 CrossRef CAS.
- E. J. Korpela, SETI@home, BOINC, and Volunteer Distributed Computing, Annual Review of Earth and Planetary Sciences, ed. R. Jeanloz, 2012, vol. 40, pp. 69–87 Search PubMed.
- R. Das, Q. Bin, S. Raman, R. Vernon, J. Thompson, P. Bradley, S. Khare, M. D. Tyka, D. Bhat, D. Chivian, D. E. Kim, W. H. Sheffler, L. Malmstrom, A. M. Wollacott, C. Wang, I. Andre and D. Baker, Proteins: Struct., Funct., Bioinf., 2007, 69, 118–128 CrossRef CAS PubMed.
- A. L. Beberg, D. L. Ensign, G. Jayachandran, S. Khaliq and V. S. Pande, presented in part at the Proceedings of the 2009 IEEE International Symposium on Parallel&Distributed Processing, 2009 Search PubMed.
- D. Clery, Science, 2011, 333, 173–175 CrossRef CAS PubMed.
- M. Helmstaedter, K. L. Briggman, S. C. Turaga, V. Jain, H. S. Seung and W. Denk, Nature, 2013, 500, 168–174 CrossRef CAS PubMed.
- F. Khatib, S. Cooper, M. D. Tyka, K. F. Xu, I. Makedon, Z. Popovic, D. Baker and P. Foldit, Proc. Natl. Acad. Sci. U. S. A., 2011, 108, 18949–18953 CrossRef CAS PubMed.
- J. Han, L. Shao, D. Xu and J. Shotton, IEEE Transactions on Cybernetics, 2013, 43, 1318–1334 CrossRef PubMed.
- Z. Zhang, IEEE Multimedia, 2012, 19, 4–10 CrossRef.
- J. Geng, Adv. Opt. Photonics, 2011, 3, 128–160 CrossRef CAS.
- G. Kramer, B. Walker, T. Bonebright, P. Cook, J. H. Flowers, N. Miner and J. Neuhoff, Sonification report: Status of the field and research agenda, Faculty Publications, Department of Pyschology, Paper 444, 2010, http://digitalcommons.unl.edu/psychfacpub/444 Search PubMed.
- M. W. Krueger, presented in part at the Proceedings of the June 13–16 1977 National Computer Conference, Dallas, Texas, 1977.
- M. Y. Ivanov, Nature, 2012, 483, 161–163 CrossRef CAS PubMed.
- J. Villali and D. Kern, Curr. Opin. Chem. Biol., 2010, 14, 636 CrossRef CAS PubMed.
- S. Bradforth, Science, 2011, 331, 1398–1399 CrossRef CAS PubMed.
- E. S. Shamay, K. E. Johnson and G. L. Richmond, J. Phys. Chem. C, 2011, 115, 25304–25314 CAS.
- A. Tafiviz, L. A. Mirny and A. M. van Oijen, ChemPhysChem, 2011, 12, 1481–1489 CrossRef PubMed.
- Q. Wu, T. Ochi, D. Matak-Vinkovic, C. V. Robinson, D. Y. Chirgadze and T. L. Blundell, Biochem. Soc. Trans., 2011, 39, 1387–1392 CrossRef CAS PubMed.
- L. Rothberg, Nat. Chem., 2011, 3, 425–426 CrossRef CAS PubMed.
- A. Chatterjee, A. B. Hazra, S. Abdelwahed, D. G. Hilmey and T. P. Begley, Angew. Chem., Int. Ed., 2010, 49, 8653–8656 CrossRef CAS PubMed.
- D. R. Livesay, Curr. Opin. Pharmacol., 2010, 10, 706–708 CrossRef CAS PubMed.
- T. Delatour, in Molecular Aesthetics, ed. P. Weibel and L. Fruk, MIT Press, Cambridge, MA, 2013, pp. 293–311 Search PubMed.
- D. R. Glowacki, P. Tew, J. Hyde, L. Kriefman, T. Mitchell, J. Price and S. McIntosh-Smith, in Molecular Aesthetics, ed. P. Weibel and L. Fruk, MIT Press, Cambridge, MA, 2013, pp. 248–257 Search PubMed.
- D. R. Glowacki, J. N. Harvey and A. J. Mulholland, Nat. Chem., 2012, 4, 169–176 CrossRef CAS PubMed.
- D. J. Wales, Philos. Trans. R. Soc. London, Ser. A, 2012, 370, 2877–2899 CrossRef CAS PubMed.
- P. Eastman, M. S. Friedrichs, J. D. Chodera, R. J. Radmer, C. M. Bruns, J. P. Ku, K. A. Beauchamp, T. J. Lane, L. P. Wang, D. Shukla, T. Tye, M. Houston, T. Stich, C. Klein, M. R. Shirts and V. S. Pande, J. Chem. Theory Comput., 2013, 9, 461–469 CrossRef CAS PubMed.
- D. Frenkel and B. Smit, Understanding molecular simulation: from algorithms to applications, Academic press, 2001 Search PubMed.
- E. J. Heller, J. Chem. Phys., 1981, 75, 2923 CrossRef CAS PubMed.
- http://opencv.org/ .
- M. Wright, Organised Sound, 2005, 10, 193–200 CrossRef.
- http://cycling74.com/products/max/ .
- T. Mitchell, J. Hyde, P. Tew and D. R. Glowacki, in preparation.
- R. Salomon-Ferrer, D. A. Case and R. C. Walker, Wiley Interdiscip. Rev.: Comput. Mol. Sci., 2013, 3, 198–210 CrossRef CAS.
- M. J. Feige and E. Paci, J. Mol. Biol., 2008, 382, 556–565 CrossRef CAS PubMed.
- D. K. West, P. D. Olmsted and E. Paci, J. Chem. Phys., 2006, 125, 204910 CrossRef PubMed.
- D. R. Glowacki, E. Paci and D. V. Shalashilin, J. Phys. Chem. B, 2009, 113, 16603–16611 CrossRef CAS PubMed.
- D. R. Glowacki, E. Paci and D. V. Shalashilin, J. Chem. Theory Comput., 2011, 7, 1244–1252 CrossRef CAS.
- D. V. Shalashilin, G. S. Beddard, E. Paci and D. R. Glowacki, J. Chem. Phys., 2012, 137, 165102 CrossRef PubMed.
- C. Forlines and R. Lilien, presented in part at the Proceedings of the working conference on Advanced visual interfaces, Napoli, Italy, 2008 Search PubMed.
- A video of the user-accelerated simulation is available at http://www.vimeo.com/81531449.
- D. R. Glowacki, E. Paci and D. V. Shalashilin, J. Phys. Chem. B, 2009, 113, 16603–16611 CrossRef CAS PubMed.
- G. R. Bowman and V. S. Pande, Proc. Natl. Acad. Sci. U. S. A., 2010, 107, 10890–10895 CrossRef CAS PubMed.
- A. Dickson and C. L. Brooks, J. Am. Chem. Soc., 2013, 135, 4729–4734 CrossRef CAS PubMed.
- G. R. Bowman, K. A. Beauchamp, G. Boxer and V. S. Pande, J. Chem. Phys., 2009, 131, 124101 CrossRef PubMed.
- F. Noe, J. Chem. Phys., 2008, 128, 244103 CrossRef PubMed.
- J. Juraszek, J. Vreede and P. G. Bolhuis, Chem. Phys., 2012, 396, 30–44 CrossRef CAS PubMed.
- E. Vanden-Eijnden and M. Venturoli, J. Chem. Phys., 2009, 130, 17 Search PubMed.
- G. Henkelman, B. P. Uberuaga and H. Jonsson, J. Chem. Phys., 2000, 113, 9901–9904 CrossRef CAS PubMed.
- P. Gonnet, J. Comput. Chem., 2012, 33, 76–81 CrossRef CAS PubMed.
Footnote |
| † Electronic supplementary information (ESI) available. See DOI: 10.1039/c4fd00008k |
| This journal is © The Royal Society of Chemistry 2014 |

