Biodegradable nanoparticles composed of enantiomeric poly(γ-glutamic acid)-graft-poly(lactide) copolymers as vaccine carriers for dominant induction of cellular immunity
Takami
Akagi
,
Ye
Zhu
,
Fumiaki
Shima
and
Mitsuru
Akashi
*
Department of Applied Chemistry, Graduate School of Engineering, Osaka University, 2-1 Yamadaoka, Suita 565-0871, Japan. E-mail: akashi@chem.eng.osaka-u.ac.jp; Fax: +81-6-6879-7359; Tel: +81-6-6879-7356
First published on 7th January 2014
Abstract
The design of particulate materials with controlled degradation at desired sites is important in applications for drug/vaccine/gene delivery systems. Amphiphilic biodegradable polymeric nanoparticles are promising vaccine delivery carriers due to their ability to stably maintain antigens, provide tailored release kinetics, effectively target, and function as adjuvants. In this study, we report that stereocomplex nanoparticles (SC NPs) composed of enantiomeric poly(γ-glutamic acid)-graft-poly(lactide) (γ-PGA–PLA) copolymers are excellent protein delivery carriers for vaccines that can deliver antigenic proteins to dendritic cells (DCs) and elicit potent immune responses. We prepared ovalbumin (OVA)-encapsulated γ-PGA–PLA SC NPs (OVA-SC NPs) and isomer NPs. These NPs were efficiently taken up by DCs and also affected the intracellular degradation of the encapsulated OVA. The degradation of OVA encapsulated into the SC NPs was attenuated as compared to free OVA and the corresponding isomer NPs. Interestingly, immunization with OVA-SC NPs predominantly induced antigen-specific cellular immunity. The crystalline structure of inner NPs consisting of PLA had a significant impact on the degradation profiles of NPs and the release/degradation behavior of encapsulated antigens and thus the efficiency of immune induction. Our findings suggest that the γ-PGA–PLA SC NPs are suitable for protein-based vaccines that are used to induce cellular immunity, such as for infectious diseases, cancer, allergies and autoimmune diseases.
1. Introduction
Vaccine adjuvants and delivery systems are used to improve the potency of the immune response to co-administered antigens.1 Aluminum compounds (Alum) are the most widely used vaccine adjuvants and are employed in diphtheria, tetanus, pertussis, hepatitis B and pneumococcus vaccines. It has been proposed that Alum acts through the formation of a depot that induces the sustained release of the adsorbed antigen at the injection site.2 Alum adjuvanticity is associated with enhanced antibody responses (humoral immunity). However, aluminum-based adjuvants can induce local reactions and fail to generate strong cell-mediated immunity. As a consequence, there is a great need to develop novel adjuvants and delivery systems for the next generation of vaccines.Recently attention has been directed toward the utility of biodegradable nanoparticles (NPs) as delivery carriers for vaccines.3,4 A vaccine antigen is either encapsulated within or immobilized onto the surface of the NPs. By encapsulating the antigenic component, NPs provide a method for delivering antigens which may otherwise degrade and diffuse rapidly upon injection. A key challenge in NP-based vaccine development is the efficient targeting of antigen-presenting cells (APCs), such as dendritic cells (DCs) and macrophages.5 Exogenous particulate antigens are normally internalized by APCs, degraded and processed in the endosome/lysosomes, and presented on the MHC class II pathway, which is involved in T helper cell activation. In contrast, endogenous antigens are generally processed and presented via the MHC class I pathway, which is involved in cytotoxic T lymphocyte (CTL) activation (cellular immunity).6 DCs have the unique ability to present exogenous antigens on MHC class I molecules. MHC class I-restricted antigen presentation by exogenous antigens is possible if the antigens escape from the lysosomes into the cytoplasm rather than by being degraded in the lysosomes.7 Therefore, it is suggested that not only the cell uptake process of the particulate antigens but also the intracellular distribution and degradation of encapsulated antigens are important for the induction and regulation of antigen-specific immune responses. Moreover, it is expected that the desired immune response can be manipulated by controlling the process of antigen degradation in APCs.
Recently, the self-assembly of amphiphilic block copolymers or hydrophobically-modified polymers has been extensively studied in the field of drug delivery systems.8,9 In general, amphiphilic block/graft copolymers can self-assemble to form nano-sized micelles consisting of a hydrophilic outer shell and a hydrophobic inner core in aqueous solution. Amphiphilic block copolymers such as poly(ethylene glycol)–poly(lactic acid) (PEG–PLA) are very attractive for drug delivery applications.10 These systems can be used to provide targeted cellular delivery of drugs, to avoid any toxic effects, and to protect therapeutic agents against enzymatic degradation (nucleases and proteases), especially in the case of protein, peptide and nucleic acid drugs. Moreover, poly(L-lactide)/poly(D-lactide) (PLLA/PDLA)-containing copolymers of various architectures were synthesized to form stereocomplex (SC) composites.8 It has been reported that PLLA/PDLA mixtures in solution form SCs with distinctive physical and chemical stability due to their van der Waals interactions.11,12 It is well known that the physical and mechanical properties of a SC are largely dependent on its level of crystallinity. Application of this interaction for NP formation was first employed in micelle stabilization by Kang et al. with block copolymer micelles obtained through the self-assembly of equimolar mixtures of PEG–PLLA and PEG–PDLA in water.13 These SC micelles possessed partially crystallized cores and exhibited kinetic stability superior to micelles prepared with isotactic or racemic polymers alone. Other groups have used SC formation between enantiomeric PLA to fabricate or stabilize polymeric micelles or NPs with hydrophilic segments including PEG, poly(N-isopropylacylamide) (PNIPAM), poly(L-histidine) or dextran.14–17 The hydrolytic degradation of PLA is affected by different factors such as the chemical configuration, molecular weight, crystallinity and environmental conditions.18 This suggests the possibility of tuning the degradation rate over a wide range of homopolymer PLLA, PDLA and stereocomplexed PLA composites.
In a previous study, we prepared biodegradable NPs composed of poly(γ-glutamic acid) (γ-PGA) as a hydrophilic backbone and enantiomeric PLA as a hydrophobic side chain. These γ-PGA-graft-PLA (γ-PGA–PLA) copolymers could form NPs, and SC crystallites were formed in the case of the mixture of γ-PGA–PLLA and γ-PGA–PDLA copolymers.19 Moreover, the SC NPs exhibit a lower critical aggregation concentration (CAC) as well as stronger kinetic stability compared with the corresponding isomer NPs. We hypothesize that the crystalline structure of NPs would have a significant impact on the degradation profiles of NPs and the release/degradation behavior of encapsulated antigens and thus the efficiency of immune induction. In this study, we investigated the efficacy of γ-PGA–PLA SC NPs on cellular uptake, intracellular degradation of protein encapsulated into the NPs in vitro and immune induction of protein-encapsulated SC NPs in vivo.
2. Materials and methods
2.1. Materials and reagents
L-Lactide and D-lactide were purchased from Purac Biochem BV (Gorinchem, the Netherlands) and were re-crystallized twice from ethyl acetate prior to use. Poly(γ-glutamic acid) (γ-PGA, number average molecular weight: Mn = 75 kDa; molecular weight distribution: Mw/Mn = 2.0), stannous octanoate [Sn(Oct)2], ovalbumin (OVA) and other chemicals were purchased from Wako Pure Chemical Industries (Tokyo, Japan). N-Boc-ethanolamine (Boc: t-butoxycarbonyl), 1-ethyl-3-(3-dimethylaminopropyl)-carbodiimide (EDC) and 4-(N,N-dimethylamino)pyridine (DMAP) were purchased from Sigma (St. Louis, MO), and were used as received.2.2. Synthesis and preparation of γ-PGA–PLA NPs
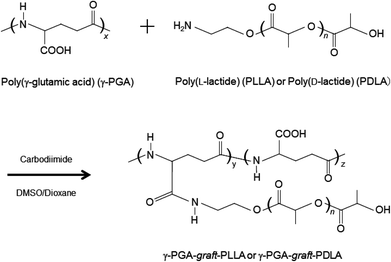
PLAs (Mn = 2.5 kDa) and γ-PGA–PLA copolymers (Mn of γ-PGA = 10 kDa) were synthesized as previously described.19 The amphiphilic graft copolymers γ-PGA-PLLA and γ-PGA–PDLA were synthesized via a combination of ring opening polymerization and coupling reactions (Scheme 1). The grafting degree of PLA, the number and hydrophobic content (%) of the PLAs in the copolymer were calculated from 1H NMR (solvent DMSO-d6). The PLA content (wt%) was calculated by the following equation: PLA content (wt%) = [(Mw of PLA × the number of grafted PLAs)/(Mw of γ-PGA–PLA)] × 100. In this study, γ-PGA–PLA copolymers with 5–6 PLA chains per γ-PGA (PLA content: 55–60 wt%) were used. NPs composed of γ-PGA–PLLA (γ-PGA–PLLA NPs) and γ-PGA–PLLA/γ-PGA–PDLA (γ-PGA–PLA SC NPs) were prepared by a precipitation and dialysis method. First, γ-PGA–PLLA and an equal molar mixture of PLLA and PDLA copolymers were dissolved in DMSO, a solvent for both γ-PGA and PLA, to a concentration of 10 mg ml−1. Then, phosphate buffer saline (PBS; 10 mM, pH 7.4) was added dropwise into the copolymer solution and vigorously stirred until the water content reached 50 vol%. The solutions were transferred into a dialysis tube (MWCO: 1000 Da) for dialysis against pure water. After dialysis, the particle size and distribution were measured by a dynamic light scattering (DLS) method using a Zetasizer Nano ZS (Malvern Instruments, UK).2.3. X-ray diffraction (XRD) measurements
The XRD patterns of γ-PGA–PLA NPs were obtained from a RIGAKU RINT2000 apparatus. CuKα (λ = 0.154 nm) was used as the X-ray source, and the patterns were measured at 40 kV and 200 mA with a Ni filter. The samples were examined at 2θ equal to 5–30°. The patterns were then curve-resolved into amorphous hollow and crystalline reflection peaks. After dividing the reflection peaks into homo-crystals (2θ = 17 and 19°) and stereocomplex crystals (2θ = 12, 21 and 24°), their crystallinities were estimated. In this study, γ-PGA–PLLA NPs (isomer) with a homo-crystallinity of 40% and γ-PGA–PLA SC NPs with a stereocomplex crystallinity of 58% were used.2.4. Preparation of OVA-encapsulated γ-PGA–PLA NPs
To prepare the OVA-encapsulated γ-PGA–PLLA NPs (OVA-L NPs) and γ-PGA–PLA SC NPs (OVA-SC NPs), 2 mg of OVA was dissolved in 1 ml of PBS and slowly added to 1 ml of the DMSO solution of γ-PGA–PLLA isomers or a mixture of γ-PGA–PLLA and γ-PGA–PDLA (10 mg ml−1) with stirring. The resulting solution was centrifuged at 15![[thin space (1/6-em)]](https://www.rsc.org/images/entities/char_2009.gif) 000 rpm for 10 min, rinsed with PBS twice, and re-suspended in PBS at a concentration of 10 mg ml−1. OVA-encapsulated NPs (OVA-NPs) were added to DMSO to dissolve the NPs, and the OVA loading content was measured by the Lowry method. The morphology of OVA-NPs was observed by scanning electron microscopy (SEM) (JEOL JSM-6701F) at 6 kV. A drop of the NP suspension was placed on a glass surface, which was fixed on metallic supports with a carbon tape. After drying, the samples were coated with osmic acid.
000 rpm for 10 min, rinsed with PBS twice, and re-suspended in PBS at a concentration of 10 mg ml−1. OVA-encapsulated NPs (OVA-NPs) were added to DMSO to dissolve the NPs, and the OVA loading content was measured by the Lowry method. The morphology of OVA-NPs was observed by scanning electron microscopy (SEM) (JEOL JSM-6701F) at 6 kV. A drop of the NP suspension was placed on a glass surface, which was fixed on metallic supports with a carbon tape. After drying, the samples were coated with osmic acid.
2.5. In vitro release of OVA from γ-PGA–PLA NPs
The release experiment was carried out in vitro as follows: OVA-L NPs and OVA-SC NPs (1 mg ml−1 OVA, 10 mg ml−1 NPs) were suspended in 50 mM acetate (pH 5), phosphate (pH 7.4) and carbonate (pH 10) buffer and then placed in a microtube at 37 °C. At different time intervals, 100 μl samples were withdrawn and centrifuged at 15![[thin space (1/6-em)]](https://www.rsc.org/images/entities/char_2009.gif) 000 rpm for 10 min. The amount of OVA released into the supernatant was then determined by the Lowry method.
000 rpm for 10 min. The amount of OVA released into the supernatant was then determined by the Lowry method.
2.6. Kinetics of the cellular uptake of OVA-NPs
Mouse bone marrow-derived dendritic cells (DCs) were generated, as previously reported.20 FITC-labeled OVA (F-OVA) (Molecular Probes, Eugene, OR) was used to evaluate the uptake of F-OVA-NPs by DCs. To determine the kinetics of the F-OVA-NP uptake, the cells (1 × 10⁵ cells per 100 μl) were incubated with a defined concentration of F-OVA alone, F-OVA-encapsulated γ-PGA–PLLA or γ-PGA–PLA SC NPs (F-OVA-L NPs or F-OVA-SC NPs) for 30 min at 37 °C. F-OVA-NPs containing 100 μg of OVA per mg of NPs were used. To quantify the amount of intracellular F-OVA-NPs, the cells incubated with F-OVA-NPs were washed thoroughly with PBS and then dissolved with 0.5% Triton X-100 in 0.2 N NaOH solution for 1 h at room temperature; then the fluorescence intensity of the lysates was measured by a fluorescence microplate reader (Fluoroskan Ascent FL, Thermo Fisher Scientific Inc., USA). The fluorescence incorporation was calculated as the amount of F-OVA uptake per cell.2.7. Intracellular degradation of OVA encapsulated into the NPs
DQ OVA (Molecular Probes, Eugene, OR) was used to evaluate the intracellular degradation of OVA-NPs. DQ OVA is a self-quenched OVA conjugate that exhibits fluorescence after degradation. DQ OVA-encapsulated NPs (DQ OVA-L NPs and DQ OVA-SC NPs) containing 100 μg of OVA per mg of NPs were prepared by the same method as described above. DCs (5 × 10⁵ cells per ml) were incubated with DQ OVA alone (100 μg ml−1), DQ OVA-L NPs (3 μg ml−1 DQ OVA, 30 μg ml−1 NPs) or DQ OVA-SC NPs (1.5 μg ml−1 DQ OVA, 15 μg ml−1 NPs) for 30 min at 37 °C. The amount of intracellular DQ OVA was regulated to be the same. After incubation, the cells were washed with PBS, and the NP phagocyted cells were incubated with PBS for up to 3 h at 37 °C. After incubation for the prescribed time period, the cell-associated fluorescence (the fluorescence intensity of the degraded DQ OVA) was measured by flow cytometry (FCM) (Cytomics FC500, Beckman Coulter, US).2.8. Immunization of mice with OVA-NPs
Female C57BL/6J (H-2Kb, 6 weeks old) mice were purchased from Charles River (Yokohama, Japan). All experiments were approved by Osaka University, and were carried out in accordance with the institutional guidelines for animal experimentation. C57BL/6J mice (3 mice per group) were immunized subcutaneously once or twice with PBS, OVA (10 μg), OVA (10 μg) mixed with incomplete Freund's adjuvant (OVA + IFA), OVA (10 μg) mixed with Alum (100 μg) (OVA + Alum), OVA-L NPs or OVA-SC NPs (10 μg OVA and 100 μg NPs) on days 0 and 7. On day 7 after the last immunization, spleen cells and blood were collected.2.9. ELISPOT assay and ELISA
Interferon (IFN)-γ-producing cells were determined using an enzyme-linked immunospot (ELISPOT) kit for mouse IFN-γ (BD Biosciences). The spleen cells (4 × 10⁵ cells per 200 μl per well) isolated by density gradient centrifugation were either stimulated in vitro with 1 μg ml−1 of OVA257–264 peptide (SIINFEKL) or unstimulated (negative control) in a 96-well ELISPOT plate. The plate was incubated for 24 h at 37 °C. The IFN-γ-producing cells in the splenocyte populations were measured using a commercially available kit according to the manufacturer's instructions. The data were expressed as the mean spot forming units (SFU) per 4 × 10⁵ cells ± standard deviation (SD). OVA specific IgG antibody levels in immunized mouse serum were measured by an enzyme-linked immunosorbent assay (ELISA) as previously described.213. Results and discussion
3.1. Preparation of OVA-encapsulated γ-PGA–PLA NPs
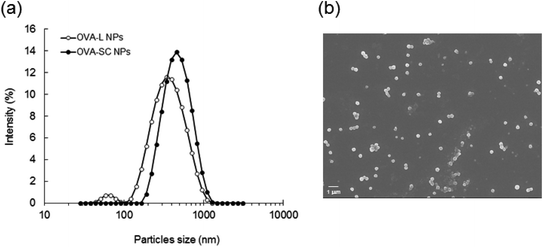
In order to study the release behavior, cellular uptake, intracellular degradation and the induction of immune response by γ-PGA–PLA NPs, OVA-, F-OVA- or DQ OVA-encapsulated NPs were prepared. OVA dissolved in PBS was added to a γ-PGA–PLLA or γ-PGA–PLLA/PDLA mixture in DMSO solution. The obtained NPs were investigated for their protein loading capability. OVA, F-OVA and DQ OVA were successfully encapsulated into the γ-PGA–PLLA and γ-PGA–PLA SC NPs. The encapsulation efficiency was found to be in the range of 50–60%, and the amount of encapsulated OVA per NP weight was almost the same, despite the differences in homopolymer and SC. In this study, OVA-NPs with an OVA loading of 100 μg per mg of NPs were used for these experiments. The size of the OVA-encapsulated γ-PGA–PLLA (isomer) NPs (OVA-L NPs) and γ-PGA–PLA SC NPs (OVA-SC NPs) re-dispersed in PBS was measured by DLS. The OVA-SC NPs showed a monodispersed size distribution with a mean diameter of 440 nm (polydispersity index: PDI = 0.30) (Fig. 1a). In contrast, the size distribution of OVA-L NPs exhibited two peaks (65 and 330 nm, PDI = 0.24). The formation of these NPs was accomplished due to the amphiphilic characteristic of γ-PGA–PLA. In the case of SC NPs, when the equimolar mixture of enantiomeric copolymers came into contact with the non-solvent PBS containing OVA under stirring, the association of the enantiomeric PLA chains took place very quickly before the solution went into microscopic phase separation and finally formed the stereocomplex cores of the NPs. It was considered that the SC formation plays an important role in controlling the size distribution of the NPs. The particle size was increased when OVA was encapsulated, and the size of the OVA-NPs increased with increasing OVA content (data not shown), likely due to an increase in the swelling capacity due to the hydrophilic properties of OVA. Furthermore, it could be observed from the SEM observation that the OVA-SC NPs were spherical in shape (Fig. 1b). The OVA-NPs had a strongly negative zeta potential (−25 mV) in PBS. The negative zeta potential was due to the ionization of the carboxyl groups of γ-PGA located near the surfaces.3.2. Release behavior of OVA encapsulated into the γ-PGA–PLA NPs
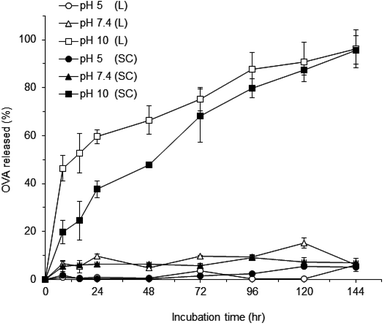
To study the stability and protein release behavior, OVA-L NPs and OVA-SC NPs were simply suspended in buffers of pH 5, 7.4 and 10, and then the OVA release in vitro was determined. As shown in Fig. 2, the OVA encapsulated into both NPs were not released (less than 10%) at pH 5 and 7.4, even after 6 days. The OVA encapsulated into the γ-PGA–PLA NPs was stable under acidic and neutral conditions. In the case of NPs prepared from amphiphilic PLA–PEG block copolymers, hydrophobic interactions between the hydrophobic regions of protein and the hydrophobic PLA blocks were observed.22 Therefore, it is suggested that the hydrophobic interactions between the hydrophobic regions of OVA and the hydrophobic PLA part in the γ-PGA–PLA NPs is attributed to the stability of OVA-NPs. However, as the OVA-NPs are formed by amphiphilic γ-PGA–PLA graft copolymers, it is hypothesized that the core of the NPs is formed not only by the PLA, but also by the γ-PGA of the main chain. Thus, γ-PGA may also be related to the interaction between the protein and the NPs. On the other hand, a significant amount of OVA was released at pH 10. The behavior of polyester degradation is controlled by a number of factors, such as pH, crystallinity, stereochemical structure, molecular weight, and the presence of low molecular weight compounds.23–25 The OVA was gradually released from the OVA-L NPs and OVA-SC NPs at pH 10, and the release percentage was about 20 and 50% in the initial period within 8 h, respectively. A significant difference in the release profile between OVA-L NPs and OVA-SC NPs was observed during an early period (from 8 to 48 h) of incubation. The OVA release rate of OVA-L NPs was higher than that of OVA-SC NPs. It has been reported that no significant hydrolysis occurred when γ-PGA was incubated at pH 7 or pH 10 at 37 °C. Even after 60 days of incubation at pH 7 or pH 10, only approximately 10% of the γ-PGA had been hydrolyzed.26 These results suggest that OVA releasing from the NPs at pH 10 can be attributed to the degradation of PLA. The reason for the increased stability of OVA-SC NPs is suggested to be intermolecular crystallization of PLLA/PDLA, which results in a larger number of tie chains between the crystallites and a more dense packing of the chains also in the amorphous phase.27 Furthermore, the solubility of γ-PGA is increased upon increasing the pH, due to ionization of carboxyl groups containing γ-PGA. Thus, OVA releasing from the NPs at pH 10 may be related to the solubility of the γ-PGA backbone.3.3. Uptake of F-OVA-NPs by DCs
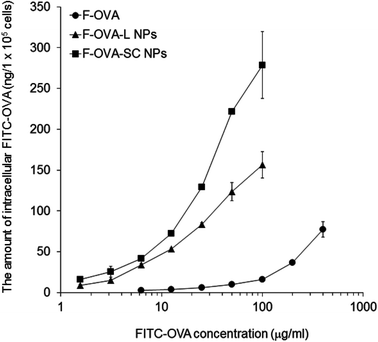
To evaluate the uptake behavior of OVA-NPs by DCs, the cells were incubated with F-OVA NPs for the defined OVA and NP concentrations. To quantify the amount of F-OVA NPs taken up by DCs, the cells incubated with each concentration of F-OVA alone, F-OVA-L NPs or F-OVA-SC NPs were dissolved with a surfactant. The fluorescence intensity of the lysates was then measured. Fig. 3 shows the cellular uptake kinetics of F-OVA NPs as a function of the concentration of F-OVA NPs or F-OVA alone. The uptake of F-OVA-L NPs and F-OVA-SC NPs increased with increasing concentration of the NPs, indicating that the uptake was dose dependent. F-OVA-SC NPs were more efficiently taken up than the F-OVA-L NPs. When 15 μg ml−1 (carrying 1.5 μg ml−1 F-OVA) of F-OVA-SC NPs, 30 μg ml−1 (carrying 3 μg ml−1 F-OVA) of F-OVA-L NPs or 100 μg ml−1 of F-OVA alone were pulsed, the same amount of OVA was taken up by the cells. In the case of F-OVA alone, an approximately 60-fold higher concentration was required to elicit a similar amount of intracellular OVA as compared to the F-OVA-SC NPs. These results showed that the γ-PGA–PLA NPs efficiently delivered the encapsulated protein into the cells. The reason why the uptake of F-OVA-SC NPs was higher than that of F-OVA-L NPs is not clear. The difference may be attributed to the size difference between these NPs.In general, virus-sized particles (20–200 nm) are usually taken up by endocytosis via clathrin-coated vesicles, caveolae or their independent receptors. Larger-sized particles (0.5–5 μm) are taken up by macropinocytosis, and particles greater than 0.5 μm are predominantly taken up by phagocytosis.28 It has been reported that DCs and macrophages are capable of ingesting polystyrene or PLA particles ranging from 50 nm to 5 μm in diameter, and that particles with a diameter of 500 nm or less are optimal for uptake by DCs.29 In this study, 400 nm-sized F-OVA-NPs were taken up more efficiently than F-OVA alone by the DCs, and the uptake of F-OVA-NPs was inhibited at 4 °C (data not shown), which suggests that the F-OVA-NPs were phagocytosed mainly via the endocytosis pathway. In addition, the cytotoxicity of the OVA-L NPs and OVA-SC NPs was evaluated in vitro by a cytotoxicity test using DCs. The surviving cells after 24 h incubation were evaluated by the trypan blue exclusion assay. DC viability as a function of the concentration of NPs was investigated. The cellular viability was maintained at levels higher than 90% for both NPs, even at high concentrations (1 mg ml−1) (data not shown). This implied that these γ-PGA–PLA NPs could be useful as protein carriers without any significant cytotoxic effects.
3.4. Intracellular degradation of OVA-NPs
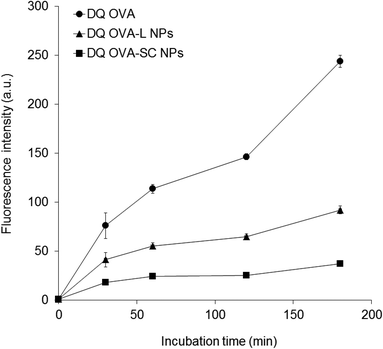
The intracellular degradation of encapsulated OVA in the NPs was investigated using a pH-insensitive self-quenched OVA conjugate (DQ OVA) that exhibits bright-green fluorescence upon proteolytic degradation. DQ OVA-encapsulated γ-PGA–PLA NPs (DQ OVA-L NPs and DQ OVA-SC NPs) were prepared to study their degradation properties. DCs were incubated with DQ OVA alone, DQ OVA-L NPs or DQ OVA-SC NPs for up to 3 h at 37 °C, and then observed using a FCM. Since the NPs influenced the amount of OVA uptake by DCs, DQ OVA alone and DQ OVA-NPs were pulsed into the cells under conditions where an equal amount of DQ OVA was taken up by the cells. Fig. 4 shows intracellular degradation of DQ OVA in DCs as a function of time. The uptake of DQ OVA alone (100 μg ml−1 pulsed) by the cells resulted in the early degradation of OVA. As the incubation time increased, the DQ OVA fluorescence became more intense inside the cells. As expected, the degradation of OVA encapsulated into the NPs was attenuated as compared to the free DQ OVA. Soluble DQ OVA was degraded much faster than the encapsulated DQ OVA. A difference in OVA degradation kinetics was observed between DQ OVA-L NPs and DQ OVA-SC NPs; the OVA degradation in the DQ OVA-SC NPs was less than in the DQ OVA-L NPs. These results indicated that the crystalline structure of stereocomplexed PLA in the NPs is an important factor for the degradation of encapsulated protein. In this study, OVA-L NPs with a homo-crystallinity of 40% and OVA-SC NPs with a SC crystallinity of 58% were used. Therefore, the crystallinity itself may affect the degradation behavior of OVA.Several studies have demonstrated that antigen-conjugated nano/microparticles affect the intracellular degradation of antigens. Cruz et al. reported that antigens encapsulated into poly(lactic-co-glycolic acid) (PLGA) particles were more slowly degraded within the lysosomal compartment of human DCs as compared to soluble antigen.30 Tran et al. also reported that OVA-adsorbed polystyrene nanoparticles (50 nm) showed the greatest degradation of OVA in DCs, and that the degradation was less evident for antigens adsorbed onto both 500 nm and 3 μm particles. The size of the polystyrene particles affected the phagosomal pH, and the different phagosomal pH profiles resulted in varying levels of OVA degradation.31 We hypothesized that the differences in degradation due to SC crystallization of PLA could be attributed to differences in the intracellular degradation of OVA. In the case of γ-PGA–PLA NPs, the OVA degradation of DQ OVA-SC NPs was slower as compared to DQ OVA-L NPs. In general, PLA degradation has focused mainly on hydrolytic or enzymatic degradation. It has been reported that the biodegradation of PLA is strongly affected by its level of crystallinity and crystal forms.18 Several reports showed that the crystalline part of the PLA was more resistant to degradation than the amorphous part, and that the rate of degradation decreases with an increase in crystallinity.32,33 Only a few studies, however, deal with the degradation behavior of stereocomplexation crystallites. Tsuji et al. and Lee et al. reported that PLA SC has a higher hydrolysis-resistance compared with isomer PLLA or PDLA when it is hydrolyzed in PBS (pH 7.4) at 37 °C or in enzyme.34,35 In Fig. 2, the OVA encapsulated into both the NPs was not released at acidic pH (pH 5) in vitro, which corresponds to pH of the endosome. The result suggests that the encapsulated OVA is not released in the endosome by pH effect. It is thought that the retardation of the hydrolysis of PLA SC is mainly due to a strong interaction between the L- and D-lactide unit sequences, which prevents the penetration of water or enzyme into the crystal structure. Based on these reports, the differences in the intracellular degradation of OVA might contribute to the high SC crystallization and the higher stability and hydrolysis-resistance of the OVA-SC NPs.
3.5. Induction of antigen-specific immune responses by OVA-NPs
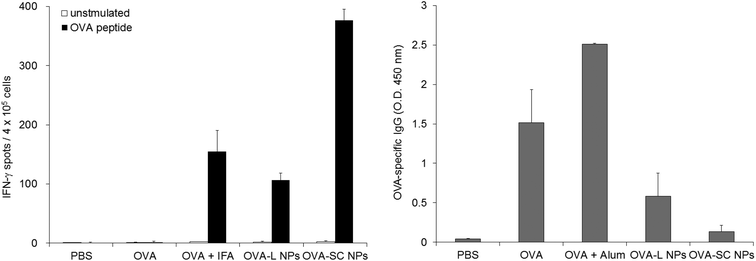
The immune responses were investigated in mice after immunization with OVA-SC NPs. To evaluate the induction of cellular and humoral immunities, the mice were subcutaneously immunized 1 or 2 times at intervals of 7 days with OVA alone, OVA + IFA, OVA + Alum, OVA-L NPs or OVA-SC NPs. Splenocytes from the mice immunized with OVA-NPs were examined for their ability to induce IFN-γ-producing cells by ELISPOT assays. Fig. 5a shows that the mice immunized with OVA-SC NPs demonstrated the efficient induction of IFN-γ-producing cells following in vitro stimulation with a CTL epitope peptide in the OVA. This activity was significantly higher than that observed for OVA + IFA. Interestingly, the induction level of antigen-specific cellular immunity by OVA-SC NPs was higher than that of OVA-L NPs. This result suggests that the induction level of antigen-specific cellular immunity could be enhanced by changing the crystalline structure of γ-PGA–PLA NPs.Next, OVA-specific antibody levels in serum were measured by ELISA. Mice immunized with OVA + Alum had high levels of anti-OVA IgG antibody in their sera (Fig. 5b). On the other hand, the OVA-specific IgG antibody response by OVA-L NPs and OVA-SC NPs was lower than that of OVA alone, suggesting that OVA-NPs have a capacity to strongly induce cellular immunity rather than humoral immunity by subcutaneous immunization.
A major challenge in generating and manipulating immune responses is to create a vaccine system that can efficiently deliver antigens into the cytoplasm of APCs in order to induce antigen-specific cellular immunity. In this study, immunization of the mice with OVA-SC NPs predominantly induced OVA-specific cellular immune responses. It is assumed that the potent induction of the responses by OVA-SC NPs is attributed to antigen leakage from the endosomes into the cytoplasm in the APCs, such as DCs and macrophages. In a previous study, we prepared biodegradable NPs composed of γ-PGA conjugated with L-phenylalanine (Phe) as the hydrophobic segment. Protein-encapsulated γ-PGA–Phe NPs efficiently delivered loaded proteins from the endosomes to the cytoplasm in DCs.36,37 The mechanism of endosome escape of the NPs is related to their increased hydrophobicity when carboxylate ions of γ-PGA located near the surfaces become protonated at acidic pH values. The partial protonation of the γ-PGA carboxyl groups at endosomal pH was involved in pH-dependent membrane-disruptive activities.38 In this study, OVA-SC NPs showed a strongly negative zeta potential in PBS. This negative charge of the NP surfaces is due to the carboxyl groups of γ-PGA. It is suggested that the γ-PGA–PLA NPs have an endosome-disruptive activity by the same mechanism as γ-PGA–Phe NPs. The NPs play a crucial role in the release of encapsulated OVA into the cytoplasm and subsequent antigen presentation via MHC class I. This behavior of the NPs might be related to their stability against hydrolytic and enzymatic degradation in the cells and at the injection site. Further studies are in progress to determine the cell trafficking behavior, antigen-presentation mechanisms and biodegradation in vivo of OVA-SC NPs.
In conclusion, polymeric NPs have attracted increasing interest as drug delivery carriers as well as for peptides, proteins, and DNA. Polymer complexes associated with two or more complementary polymers are widely used in potential applications in the form of particles. In general, electrostatic forces, hydrophobic interactions, hydrogen bonds, van der Waals forces, or combinations of these interactions are available as the driving forces for the formation of polymer complexes. In this study, we focused on stereocomplexation of PLA to stabilize NPs consisting of enantiomeric γ-PGA–PLA graft copolymers for vaccine carriers. We demonstrated that the crystalline structure of PLA in NPs is a key factor to control the release behavior and intracellular degradation of encapsulated protein. Importantly, the stereocomplexed NPs were able to deliver encapsulated antigen to DCs and regulate intracellular degradation of antigen and NPs, thereby modulating the immune response to the antigen. It is possible that γ-PGA–PLA SC NPs carrying vaccine antigens could provide a novel protein-based vaccine capable of inducing strong cellular immunity. These innovative vaccine delivery platforms could facilitate the development of effective vaccine therapy.
Acknowledgements
This work was supported by a Grant-in-Aid for Young Scientists (B) and Scientific Research (S) from the Japan Society for the Promotion of Science (JSPS). We thank Dr Tomofumi Uto for technical advice about the mouse immunization study.References
- D. T. O'Hagan and N. M. Valiante, Nat. Rev. Drug Discovery, 2003, 2, 727–735 CrossRef CAS PubMed.
- B. N. Lambrecht, M. Kool, M. A. Willart and H. Hammad, Curr. Opin. Immunol., 2009, 21, 23–29 CrossRef CAS PubMed.
- Y. Krishnamachari, S. M. Geary, C. D. Lemke and A. K. Salem, Pharm. Res., 2011, 28, 215–236 CrossRef CAS PubMed.
- A. E. Gregory, R. Titball and D. Williamson, Front. Cell Infect. Microbiol., 2013, 3, 1–13 CrossRef PubMed.
- C. Foged, A. Sundblad and L. Hovgaard, Pharm. Res., 2002, 19, 229–238 CrossRef CAS.
- J. Banchereau and R. M. Steinman, Nature, 1998, 392, 245–252 CrossRef CAS PubMed.
- A. Rodriguez, A. Regnault, M. Kleijmeer, P. Ricciardi-Castagnoli and S. Amigorena, Nat. Cell Biol., 1999, 1, 362–368 CrossRef CAS PubMed.
- S. Chen, S. X. Cheng and R. X. Zhuo, Macromol. Biosci., 2011, 11, 576–589 CrossRef CAS PubMed.
- A. Rösler, G. W. Vandermeulen and H. A. Klok, Adv. Drug Delivery Rev., 2012, 64, 270–279 CrossRef PubMed.
- G. Gaucher, M. H. Dufresne, V. P. Sant, N. Kang, D. Maysinger and J. C. Leroux, J. Controlled Release, 2005, 109, 169–188 CrossRef CAS PubMed.
- Y. Ikada, K. Jamshidi, H. Tsuji and S. H. Hyon, Macromolecules, 1987, 20, 904–906 CrossRef CAS.
- D. Brizzolara, H. J. Cantow, K. Diederichs, E. Keller and A. J. Domb, Macromolecules, 1996, 29, 191–197 CrossRef CAS.
- N. Kang, M. E. Perron, R. E. Prud'homme, Y. Zhang, G. Gaucher and J. C. Leroux, Nano Lett., 2005, 5, 315–319 CrossRef CAS PubMed.
- F. R. Kersey, G. Zhang, G. M. Palmer, M. W. Dewhirst and C. L. Fraser, ACS Nano, 2010, 4, 4989–4996 CrossRef CAS PubMed.
- S. H. Kim, J. P. K. Tan, F. Nederberg, K. Fukushima, Y. Y. Yang, R. M. Waymouth and J. L. Hedrick, Macromolecules, 2009, 42, 25–29 CrossRef CAS.
- R. Liu, B. He, D. Li, Y. Lai, J. Z. Tang and Z. Gu, Macromol. Rapid Commun., 2012, 33, 1061–1066 CrossRef CAS PubMed.
- K. Nagahama, Y. Mori, Y. Ohya and T. Ouchi, Biomacromolecules, 2007, 8, 2135–2141 CrossRef CAS PubMed.
- H. Tsuji, Macromol. Biosci., 2005, 5, 569–597 CrossRef CAS PubMed.
- Y. Zhu, T. Akagi and M. Akashi, Polym. J., 2013, 45, 560–566 CrossRef CAS.
- X. Wang, T. Uto, K. Sato, K. Ide, T. Akagi, M. Okamoto, T. Kaneko, M. Akashi and M. Baba, Immunol. Lett., 2005, 98, 123–130 CrossRef CAS PubMed.
- T. Uto, X. Wang, K. Sato, M. Haraguchi, T. Akagi, M. Akashi and M. Baba, J. Immunol., 2007, 178, 2979–2986 CAS.
- P. Quellec, R. Gref, L. Perrin, E. Dellacherie, F. Sommer, J. M. Verbavatz and M. J. Alonso, J. Biomed. Mater. Res., 1998, 42, 45–54 CrossRef CAS.
- D. Cam, S.-h. Hyon and Y. Ikada, Biomaterials, 1995, 16, 833–843 CrossRef CAS.
- I. Grizzi, H. Garreau, S. Li and M. Vert, Biomaterials, 1995, 16, 305–311 CrossRef CAS.
- H. Tsuji and Y. Ikada, J. Polym. Sci., Part A: Polym. Chem., 1998, 36, 59–66 CrossRef CAS.
- F. Kesuo, G. Denis and S. Martin, J. Environ. Polym. Degrad., 1996, 4, 253–260 CrossRef.
- H. Tsuji and Y. Ikada, Polymer, 1999, 40, 6699–6708 CrossRef CAS.
- S. D. Conner and S. L. Schmid, Nature, 2003, 422, 37–44 CrossRef CAS PubMed.
- C. Foged, B. Brodin, S. Frokjaer and A. Sundblad, Int. J. Pharm., 2005, 298, 315–322 CrossRef CAS PubMed.
- L. J. Cruz, P. J. Tacken, R. Fokkink, B. Joosten, M. C. Stuart, F. Albericio, R. Torensma and C. D. Figdor, J. Controlled. Release, 2010, 144, 118–126 CrossRef CAS PubMed.
- K. K. Tran and H. Shen, Biomaterials, 2009, 30, 1356–1362 CrossRef CAS PubMed.
- R. T. McDonald, S. McCarthy and R. A. Gross, Macromolecules, 1996, 29, 7356–7361 CrossRef.
- H. Tsuji and S. Miyauchi, Polym. Degrad. Stab., 2001, 71, 415–424 CrossRef CAS.
- H. Tsuji, Poymer, 2000, 41, 3621–3630 CAS.
- W. K. Lee, T. Iwata and J. A. Gardella Jr., Langmuir, 2005, 21, 11180–11184 CrossRef CAS PubMed.
- T. Akagi, X. Wang, T. Uto, M. Baba and M. Akashi, Biomaterials, 2007, 28, 3427–3436 CrossRef CAS PubMed.
- T. Akagi, F. Shima and M. Akashi, Biomaterials, 2011, 32, 4959–4967 CrossRef CAS PubMed.
- T. Akagi, H. Kim and M. Akashi, J. Biomater. Sci., Polym. Ed., 2010, 21, 315–328 CrossRef CAS PubMed.
| This journal is © The Royal Society of Chemistry 2014 |

