The biochemistry tetrahedron and the development of the taxonomy of biochemistry external representations (TOBER)
Marcy H.
Towns
*a,
Jeffrey R.
Raker
b,
Nicole
Becker
a,
Marissa
Harle
a and
Jonathan
Sutcliffe
c
aPurdue University, Department of Chemistry, 560 Oval Drive, West Lafayette, IN 47907, USA. E-mail: mtowns@purdue.edu
bIowa State University, Department of Chemistry, 1609 Gilman Hall, Ames, IA 50011-3111, USA
cFormerly of Purdue University, USA
First published on 16th April 2012
Abstract
Visual literacy, the ability to interpret and create external representations (ERs), is essential to success in biochemistry. Studies have been conducted that describe students' abilities to use and interpret specific types of ERs. However, a framework for describing ERs derived through a naturalistic inquiry of biochemistry classrooms has not been proposed in the literature. The Taxonomy of Biochemistry External Representations (TOBER) is proposed as a method for classifying the types of ERs used in biochemistry classrooms. Johnstone's domains of chemical knowledge is extended to the discipline of biochemistry to form the “Biochemistry Tetrahedron” and the TOBER is mapped on to it. Ainsworth's Functional Taxonomy of Multiple ERs is connected to biochemistry and is used in conjunction with the TOBER and Biochemistry Tetrahedron to derive implications for research and classroom practice.
Introduction
Visual literacy and fluency, the ability to both read/interpret and write/create external representations (ERs), are required skills for success in chemistry and biochemistry classrooms. Biochemistry is a visually rich science wherein ERs of biomolecules and cellular structures are used to convey conceptual knowledge. A large amount of conceptual content can be encoded in biochemical representations and successful chemists, biochemists, and biochemistry students must be able to read and interpret them. These representations serve as a symbolic language used for communication and inquiry within the biochemistry community, and literacy and fluency of this common visual language is essential for the acquisition of expertise (Kozma et al., 2000; Kozma and Russell, 1997).In chemistry, the investigation of student's understanding of chemical representations is not a new endeavor (Gabel, 1998; Gabel et al., 1987; Gilbert and Treagust, 2009; Keig and Rubba, 1993; Kozma et al., 2000; Kozma and Russell, 1997; Kozma and Russell, 2005; Pribyl and Bodner 1987; Tuckey et al., 1991; Wu et al., 2001; Wu and Shah, 2004). Studies have demonstrated that students have difficulty interpreting representations because, to the students, the molecular level representations are abstract and not derived from experiences such as laboratory or lecture demonstrations (Wu and Shah, 2004). Further, these studies hypothesize that students are unable to connect the representations to their experiential observations in the laboratory. Epistemologically it is not clear whether students understand the distinction between the representation of the molecule and the physical reality which is the molecule itself (Bucat, 2010).
Literature review of external representations and multiple domains
Several bodies of literature inform the current study; while each of these areas of research will be discussed in detail in the sections that follow, we shall introduce them here. External representations connect theoretical constructs and experimental observations. The meaning imparted by visual images allows chemists and biochemists to have a common language for communication and inquiry (Kozma and Russell, 1997). The conceptual content of these visual representations is frequently very high; understanding the interaction between the visual image and the conceptual knowledge it conveys is at the heart of chemistry and biochemistry.In the field of chemistry, Johnstone's triangle (Johnstone, 1991) or the triplet relationship (Gilbert and Treagust, 2009a) has been used repeatedly to help researchers, curriculum developers, and practitioners investigate and understand the ways in which the domains of chemical knowledge are represented. Johnstone also developed similar ideas for physics and biology. His concept of the structure of disciplines has been used by other researchers to the field of biology (Chu, 2008; Kapteijn, 1990; Reid, 2009) and will be applied to the field of biochemistry in this study.
Schönborn and Anderson have conducted research on visual literacy in biochemistry—a rich area of inquiry with beautifully complex molecules and structures and a wide variety of representational practices (Schönborn and Anderson, 2006; Schönborn and Anderson, 2009; Schönborn et al., 2002). They have developed research-based recommendations to improve visual literacy that can be described in terms of processes associated with interpreting a single ER.
Ainsworth has proposed a functional taxonomy of multiple external representations which posits that multiple ERs serve distinct functions in helping students learn (Ainsworth, 1999, 2006). Ainsworth's research is based in mathematics and physics and it would be advantageous to extend her findings to chemistry and biochemistry in order for researchers and practitioners in these fields to take advantage of this theoretical perspective (Ainsworth and Van Labeke, 2004).
Multiple domains in chemistry, biology, and biochemistry
Johnstone proposed a model of chemical knowledge to inform teachers on the subject of why science and especially chemistry are difficult to learn (Johnstone, 1991). The model has also been found to be of great use to chemistry education researchers (e.g., Gilbert and Treagust, 2009; Talanquer, 2011) and consists of three domains of knowledge as shown in Fig. 1.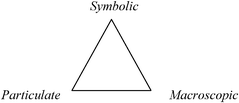 | ||
| Fig. 1 Domains of chemistry knowledge in Johnstone's triangle. | ||
1. Macroscopic – A tangible and visible level of thought and experiences comprising what students can experience or observe.
2. Particulate – Johnstone originally referred to this level as “sub-mircro” and it refers to the molecular domain.
3. Symbolic – This refers to “symbols, formulae, equations, and graphs” as Johnstone noted (Johnstone, 1991). This domain combines mathematical representations with symbols chemists use to represent elements, compounds, state functions, etc.
While all three domains are not necessary to understand every piece of chemical knowledge, a successful chemist should be able understand chemical phenomena in each domain and work inside the triangle where the domains interact in varying proportions. Chemists are comfortable with the use of a visual language to represent chemicals (e.g., H2O or C6H12O6) and chemical processes that combines the particulate and the symbolic. In considering this duality, Talanquer (2011) has noted that this “ambiguity needs to be recognized, and if possible resolved at least from the pedagogical perspective” (p. 185).
The transfer of chemical knowledge between these three domains has been widely researched (Hinton and Nakhleh, 1999; Nakhleh, 1994; Sanger and Phelps, 2007; Tuckey et al., 1991); however, studies have concluded that students lack a complete understanding of chemical phenomena in and between each domain. It is especially difficult for students to grasp the particulate domain and robustly transfer knowledge from one context to another (Kelly and Jones, 2007; Kelly and Jones, 2008; Teichert et al., 2008).
Johnstone (1991) proposed three domains in biology: macro involving the organismal level (plants or animals), micro involving the cellular level (the organizational level that can be viewed through a microscope), and the molecular level referring to the particulate nature of matter. This macro/micro perspective of biological phenomena has been developed and used by other researchers (Chu, 2008; Kapteijn, 1990; Marbach-Ad and Stavy, 2000; Reid, 2009). Chu's contribution is most illustrative for biochemistry in that it combines Johnstone's domains in chemistry and biology.
We have adapted Chu's work and rendered it as the “Biochemistry Tetrahedron” as shown in Fig. 2. The main differences in moving from chemistry to biochemistry are:
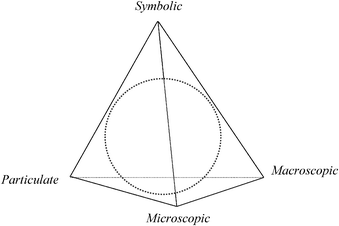 | ||
| Fig. 2 Domains in biochemistry drawn as the “Biochemistry Tetrahedron” adapted from Reid (2009) and Chu's “Biology Tetrahedron” (2008). The dotted circle represents the interior of the tetrahedron. | ||
1. The addition of the microscopic domain which is indigenous to biology as noted by Kapteijn (1990), Johnstone (1991), and Marbach-Ad and Stavy (2000).
2. The merging of the macroscopic domain to include the tangible, visible, and observable in the biological (plants and animals) and chemical disciplines.
The Biochemistry Tetrahedron provides a framework to consider the four domains of knowledge identified on its vertices and their interactions on the edges and in the interior. Combining chemical and biological domains produces challenges in understanding concepts across disciplinary boundaries. For example, in genetics, Marbach-Ad and Stavy (2000) noted difficulties between domains that according to students belong to different disciplines. Students may perceive that the particulate level belongs to chemistry and other levels such as macro or micro may belong to biology. Thus, in genetics, faculty may face challenges helping students to connect macroscopic observable traits (identified as biology) and their associated particulate explanations involving DNA, mRNA, tRNA, and protein synthesis (identified as chemistry). Within the particulate domain in biochemistry, ERs are complex and faculty and scientific illustrators are struggling to find an appropriate level of realistic representation (Goodsell and Johnson, 2007; Kramer, 2010).
Interpreting the particulate level in biochemistry
Schönborn and Anderson (2006) have identified several factors related to visual literacy and we shall consider here tasks involved in interpreting a single ER. Schönborn and Anderson describe four abilities or skills related to interpreting an ER:1. Ability to read and interpret the ER.
2. Basic reasoning skills used in interpreting an ER.
3. Retrieval of appropriate conceptual knowledge relevant to the ER.
4. Ability to reason with the relevant conceptual knowledge.
The interpretation of a representation is inherently contextualized in the field of biochemistry. When reading an ER, one must recognize what information is encoded and how it is formatted or presented. Relevant conceptual knowledge is used with reasoning skills in order to interpret the ER. Thus, faculty are challenged to help students develop these skills through interactions with various ERs using effective pedagogies.
Single to multiple ERs: Ainsworth's functional taxonomy of multiple representations
The use of ERs to help students learn scientific content is ubiquitous in classrooms. In many instances faculty use multiple ERs perhaps believing that they better capture student interest. However, it may not be intuitively obvious how two or more ERs are related to one another. Thus, it is important to review research pertaining to how multiple ERs function with each other.In Shaaron Ainsworth's seminal work on the functions of multiple representations used in learning environments, she posits based upon a conceptual analysis of the existing research that multiple ERs are used to complement, constrain, or construct understanding as shown in Fig. 3 (Ainsworth, 1999). Although the majority of Ainsworth's work and examples exist in K-12 mathematics and physics, it is beneficial to connect her work to chemistry and biochemistry for use in our educational research and practice communities.
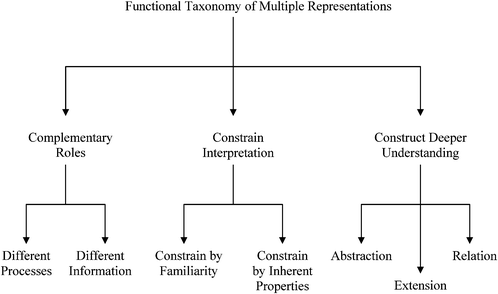 | ||
| Fig. 3 Functions of Multiple Representations (Ainsworth, 1999, 2006). | ||
Complementary roles
Representations that contain complementary information can be used to support complementary processes or information. Often the complementary processes are computational in nature. Complementary information in multiple representations can manifest itself in two ways; (1) where the representations depict or “encode specific aspects of the domain and presents different information (p. 135)”, and (2) where the representations depict redundant as well as unique information (Ainsworth 1999, 2006). For example in enzyme kinetics, often characteristics of the system such as the maximum velocity, Vmax, and specific constants such as Km, the Michaelis–Menten constant, are experimentally determined by graphing the data. To carry this out, the Michaelis–Menten equation is used as shown in eqn (1). | (1) |
Often scientists mathematically manipulate an equation to plot data in a linear form and extract constants of interest through the slope and y-intercept. To express eqn (1) as a linear equation the reciprocal of both sides is taken to derive the Lineweaver–Burk equation. A plot of  versus
 produces the Lineweaver–Burk plot as in Fig. 4. The Lineweaver–Burk equation complements the plot in that it makes explicit how the y-intercept yields
  and the x-intercept yields
  .
.
In this case it might be possible to show a single more complex representation to the students, however, the inclusion of complementary redundancies across multiple representations facilitates interpretation of the unique or new elements of the accompanying representations (Fig. 3).
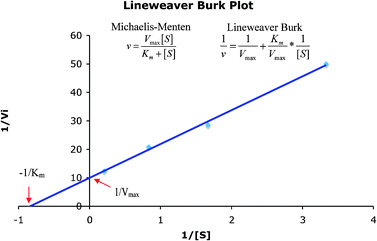 | ||
| Fig. 4 Lineweaver–Burk plot of the reciprocal of the initial reaction rate versus reciprocal of initial substrate concentration. | ||
Constraining interpretation
Constraining interpretation centers on building appropriate conceptual and algorithmic connections across representations. One notion is that a familiar representation can be used to guide and build understanding of a less familiar or more abstract representation. For example, Fig. 5 presents a ribbon diagram view of the alpha-helix portion of the protein PDB = 1PGB on the left. The image on the right presents the same alpha helix in a less familiar wireframe view highlighting the outward pointing R groups. Shown together these representations emphasize that the amino acid R groups in an alpha-helix point outward, not inward (Villafane et al., 2011). Another manifestation of constraint is to use inherent properties across representations to constrain interpretation and focus student attention, or to use an abstract representation followed by a specific representation to direct student attention.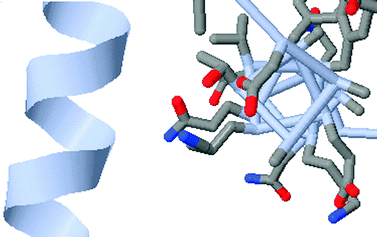 | ||
| Fig. 5 An example of constraining student understanding of the alpha helix using a familiar (ribbon diagram) and unfamiliar (wireframe) representation. The “appropriate conceptual connection” is that the R groups of the amino acids point outwards from the axis of the helix. | ||
Constructing deeper understanding
Ainsworth's description of constructing deeper understanding through multiple representations is divided into three sub-functions of abstraction, extension, and relation. She writes that these functions are “subtly different (p. 139)”, thus rather than focusing on the distinctions which can be found in her papers, we shall focus on describing these three categories (Ainsworth, 1999).Abstraction pertains to seeing the invariants and distinctions across representations. In the domain of biochemistry this would be akin to developing an understanding of the affordances and constraints of the various representations of protein molecules such as ribbon diagrams, wireframe views, or hydrophobic/hydrophilic surfaces. Imagine the case where the potassium ion channel is rendered using those three techniques as in Fig. 6. In each case the same molecule is shown, thus the molecule's identity is an invariant feature. Fig. 6A and C are ribbon diagrams orienting the viewer above and beside the channel. The secondary and quaternary structure of the protein can be easily discerned and to a certain degree the tertiary structure is also distinguishable. In Fig. 6B the selectivity filter can be highlighted via the red carbonyl oxygen atoms around the periphery of the channel opening. This attribute of the molecule is not distinguishable in Fig. 6A, C, and D. Fig. 6D shows the hydrophobic/hydrophilic surface regions of the molecule and is rendered in the same orientation as Fig. 6C. The noticeable distinctions are that the protein's secondary, tertiary, quaternary structure, and selectivity filter are not discernable in this representation. However, the regions of the molecule that lie within, above, and below the cell membrane may be recognized, but are not distinguishable in Fig. 6A–C.
![Renderings of the potassium ion channel: A. Ribbon diagram top view down the channel; B. Wireframe diagram top view; C. Ribbon diagram side view; D. Hydrophobic [gray]/hydrophilic [purple] surface side view.](/image/article/2012/RP/c2rp00014h/c2rp00014h-f6.gif) | ||
| Fig. 6 Renderings of the potassium ion channel: A. Ribbon diagram top view down the channel; B. Wireframe diagram top view; C. Ribbon diagram side view; D. Hydrophobic [gray]/hydrophilic [purple] surface side view. | ||
Abstraction also supports understanding the limitations of a particular representation. For example rendering a protein as a hydrophobic/hydrophilic surface obscures the protein's primary, secondary, tertiary, and quaternary structure. However, a ribbon diagram elucidates the secondary, tertiary, and quaternary structure, but loses the ability to distinctly show the hydrophobic/hydrophilic surface features. Neither representation presents information about the primary structure of the protein.
Extension means to extend the knowledge of students to new situations where a familiar representation can be used, such as Michaelis–Menten kinetics and Lineweaver–Burk plots to a discussion of inhibition. It can also refer to new representations to represent knowledge of a system.
Relation can be very similar to extension in that the goal is to help students translate across representations and develop insights. Returning to the K+ channel representation, ultimately the goal is to have students translate across representations recognizing what information is and is not carried in each, and demonstrate the ability to make inferences about structure function relationships from a set of diagrams such as these. Thus, often relation encourages and supports abstraction.
Summary of the literature
Key to creating conceptual and algorithmic connections amongst multiple representations is the understanding of affordances and limitations of each ER. Inferences drawn from viewing multiple representations may be correct or incorrect based upon understanding each representation and the concepts encoded in it. Thus, Schönborn and Anderson's recommendations for developing visual literacy skills for individual ERs are coupled to the use of multiple ERs discussed in Ainsworth's work.The “biochemistry tetrahedron” illustrates the complexity in biochemistry by adding the microscopic domain to Johnstone's chemistry triangle. Connecting representations across domains, for example between symbolic and particulate or between microscopic and particulate is challenging. Together the work of Johnstone, Schönborn, Anderson, and Ainsworth call attention to the challenge faced by faculty in helping students interpret multiple representations within and across domains in the context of biochemistry teaching and learning.
Representations in undergraduate biochemistry classrooms
In our study, the term external representations encompasses a collective and diverse category of representations. ERs include items such as graphs, molecular formulas, molecular representations, and detailed reaction mechanisms using the curved-arrow formalism. A clear differentiation and classifications of ERs used in undergraduate biochemistry classrooms that students are expected to understand is not found in the literature. We believe that the development of such a taxonomy would be helpful to biochemistry education researchers in designing their studies and it would aid practitioners as they develop curricula. Thus, we have conducted a naturalistic study that documents authentic classroom practices to characterize the types of ERs used in biochemistry classrooms centered on the following research questions:1. What types of ERs do faculty use in biochemistry classrooms?
2. How can the ERs be classified and connected to the biochemistry tetrahedron?
Methods and context
The overall approach to the study is guided by a naturalistic approach to inquiry (Lincoln and Guba, 1983). The sampling was purposive in the sense that biochemistry courses were targeted for data collection. One author (JS) was thoroughly acquainted with the “field sites” or classrooms in which the data collection was to take place; he had been a biochemistry undergraduate major at the same institution. His familiarity with both the institution and subject matter provided for effective and efficient data collection.The study was situated in three undergraduate biochemistry courses at a research institution in the United States over two-year period. Two third-year biochemistry courses and one first-year biochemistry course were chosen for study. The courses are described below.
Third-year course (Fall 2007 and Fall 2008)
This three-credit course (meeting for three 50 min lectures per week for 15 weeks) was tailored to health science majors and was taught in the chemistry department of a college of science. Enrollment was approximately 140 students in each semester and different professors taught the course in each year. Data collection took place during 38 lectures in Fall 2007, and 35 lectures in Fall 2008. Data collection did not take place during university holidays, examinations, or when the instructor was ill.First-year course (Fall 2008)
This two-credit course (meeting for two 50 min lectures per week for 15 weeks) was tailored to biochemistry majors and was taught in the biochemistry department of a college of agriculture. Enrollment was approximately 40 students. Data was collected during 22 lectures. Data collection did not take place during university holidays, examinations, or when the instructor was ill.Data collection and analysis
The data collected during each lecture consisted of lecture notes made available by the professor as pdf formatted files, field notes describing the date and order each representation was displayed in lecture, and the amount of time they were displayed in front of students. The unit of analysis was the representations displayed to the students via PowerPoint®, overhead slides, or the blackboard. The representations were coded in most cases by using nomenclature within the discipline of chemistry and biochemistry such as ball and stick, Lewis dot structures, ribbon diagrams, etc. The research team developed codes and descriptions for representations such as montage, schematic, and sequential subunit that are described in the results section. The categories that describe related types of representations were derived from the biochemistry tetrahedron—symbolic, particulate, microscopic, and macroscopic. Some codes were found to span multiple categories and are described below.To evaluate the coding scheme's reliability an inter-reliability study was performed. Two of the authors (NB and MH) collaboratively coded the entire first -year biochemistry course dataset while author MT individually coded the same data. Original agreement was 79%. The three authors subsequently met as a research team to discuss the analytic coding process, refine the coding scheme, and the instances where the codes disagreed. After this discussion final agreement was 96%.
Results
The taxonomy of biochemistry external representations, the TOBER
Table 1 describes the categories of representations found in the biochemistry courses under observation: particulate, symbolic, microscopic, montage, schematic, and animations. The particulate category includes the following types of representations: CPK (Corey–Pauling–Koltun) or space filling, ball and stick, ribbon, Fischer, Haworth, skeleton, wedge-dash, condensed formula, Lewis structures, and chemical equation. Examples of the first nine particulate representations are given in Fig. 7. We placed chemical equations in this category because the majority of chemical equations observed were particulate in nature. However, we acknowledge, as Talanquer (2011) noted, the dual particulate/symbolic nature these representations carry.| Representational Type Description |
|---|
| 1.0 Particulate – Representations that convey spatial information as 2D or 3D analogs of 3D physical entities or concepts involving particulate interactions. |
| • CPK (Corey, Pauling, Koltun) or space filling – Space filling models of molecules using Van der Waals radii with a specific color scheme. |
| • Ball and stick – Uses two-dimensional spheres to represent atoms and sticks or lines to represent bonds. |
| • Ribbon – Uses specific conventions to show alpha helices and beta sheets in protein molecules. |
| • Fischer – Structural model used to help identify stereocenters with specific angular conventions. |
| • Haworth – Two-dimensional representation of a cyclic molecule. All bonds off of the vertices are represented vertically. |
| • Skeleton – Shorthand structural formula often used by organic chemists. Carbon and hydrogen atoms are not specifically drawn (unless part of a functional group), but are implied by the conventions of the notation. Atoms such as O and N are drawn. |
| • Wedge-dash notation – A molecular drawing convention where dashes represent bonds behind the plane of the board, paper, or screen and wedges represent bonds in front of it. |
| • Condensed formula – All atoms are identified but bonds are not drawn. Thus, propane is CH3CH2CH3. |
| • Lewis structures – Two-dimensional representation showing bonding electron pairs as lines and non-bonding electron pairs as dots. |
| • Chemical equation – Represents a chemical reaction where all molecules are rendered using the same technique. |
| • Sequential subunit – Sequential representation of protein primary structure as one or three letter abbreviations or oligosaccharides with icons for each type of sugar. |
![[thin space (1/6-em)]](https://www.rsc.org/images/entities/char_2009.gif) |
| 2.0 Symbolic – Representations displaying symbolic, numerical, and or graphical information |
| • Equations – Mathematical statements with dependent and independent variables often relating variables of interest to measurable variables. |
| • Graphs – Two-dimensional representation of the relationship between independent and dependent variables that convey quantitative information. |
| • Tables numeric – Arrays of information displayed as rows and columns. |
| • Tables classification – Tables that serve to identify and classify entities such as reaction types, compounds relating to chemical reactions, enzymes, and/or abbreviations for molecules. |
![[thin space (1/6-em)]](https://www.rsc.org/images/entities/char_2009.gif) |
| 3.0 Microscopic – Microscopic representation of a cell with part labeled or a cut away view of a cellular component with large structural components such as membrane proteins labeled. |
![[thin space (1/6-em)]](https://www.rsc.org/images/entities/char_2009.gif) |
| 4.0 Montage – Combines multiple types of representations |
| • Particulate – Combination of particulate representations in a montage. |
| • Symbolic – Combination of symbolic representations in a montage. |
| • Dual – Combination of particulate, microscopic, and symbolic representations in a montage. |
| • Anatomy and physiology – Macroscopic representations relating to the anatomy of an organism (muscles, organs, or blood vessels, for example) in conjunction with another type of representation, such as a particulate or symbolic representation. |
![[thin space (1/6-em)]](https://www.rsc.org/images/entities/char_2009.gif) |
| 5.0 Schematic – Steps in a process such as protein folding, a chemical synthesis, experimental procedure, or larger overall process. In the case of chemical synthesis or pathways only names of molecules are used—no particles are shown. |
![[thin space (1/6-em)]](https://www.rsc.org/images/entities/char_2009.gif) |
| 6.0 Animation – Multimedia animation to illustrate concepts at any level or in any domain. |
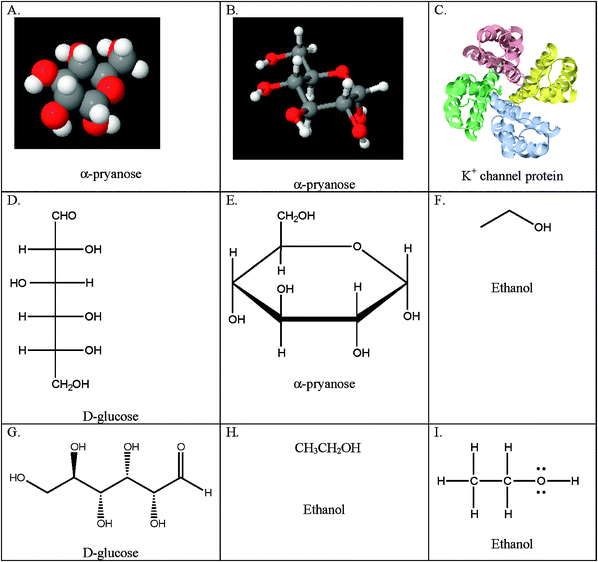 | ||
| Fig. 7 Examples of particulate representations by type. A. Space filling; B. Ball and stick; C. Ribbon diagram; D. Fischer projection; E. Haworth projection; F. Skeleton formula; G. Wedge-dash notation; H. Condensed formula; I. Lewis structure. | ||
Additionally, a code named “sequential subunit” was used to classify protein primary structure and oligosaccharides in the particulate category. Both proteins and oligosaccharides are polymers with repeating components—amino acids or saccharides. Rather than have an individual code for a specific rendering (such as protein primary structure or oligosaccharide) the representations were thought of as encoding sequential information and as such were grouped into one code.
The second category of codes, symbolic representations, in many instances carries numerical (measurements and values) information. Tables that provide a classification of information about reaction types, enzymes, abbreviations, etc. are also included in this category. The microscopic category is composed of representations of cells and cellular components.
Montage representations are combinations of two or more types of representations used to convey a particular concept or collection of concepts. Montages may be particulate, symbolic, dual (a combination of particulate, symbolic, and/or microscopic), or anatomy and physiology. An example of a dual montage is shown in Fig. 8. This slide was used in the first year biochemistry course and contains a table (symbolic) classifying the 20 amino acids and particulate representations of all 20 molecules. Anatomy and physiology montages served to highlight the physiological relevance of a biochemical process or concept; they typically included macroscopic diagrams relating to the anatomy of an organism in conjunction with another type of representations, such as a particulate or symbolic representation.
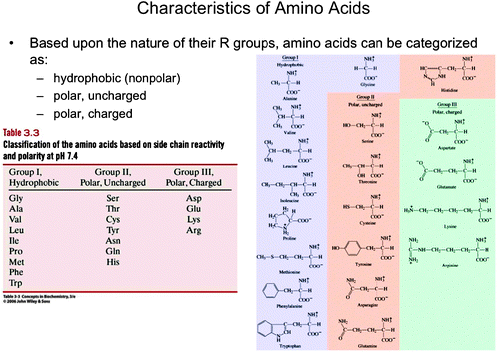 | ||
| Fig. 8 Dual montage from the first year biochemistry course displaying a table (symbolic) classifying the amino acids based upon chemical behavior using their three letter codes, and the particulate representations of the amino acids (Boyer, 2005). This material is reproduced with permission of John Wiley & Sons, Inc. | ||
Schematic representations were used to illustrate the steps in a biochemical process, experimental procedure, or larger multi-step process. These representations typically involved flowcharts in which steps of a process were depicted in a sequential fashion, and may also include symbolic or particulate representations as relevant to illustrating the process. Finally, animations included multiple domains of biochemistry.
Discussion and implications
The TOBER connection to the biochemistry tetrahedron
The TOBER can be mapped on to the surface and volume of the Biochemistry Tetrahedron as shown in Fig. 9. The vertices are associated with the particulate, microscopic, macroscopic, and symbolic domains. The ERs from the TOBER that map to these vertices are listed at the appropriate vertex. However, not every ER is uniquely associated with a vertex, some are placed along the edges between domains. The dual montage code that emerged from the data when two different types of ERs were used would lie on an edge between domains. An example would be a dual montage that combines a ribbon diagram, a particulate ER, with a graph, a symbolic ER. Such a montage could be placed along the edge of the tetrahedron between the particulate and symbolic vertices. Another case would be a dual montage with a view of a cell, a microscopic ER, combined with numerical data, a symbolic ER, comparing the size of a cell to other entities. Here the montage would lie on the edge between the microscopic and symbolic vertices.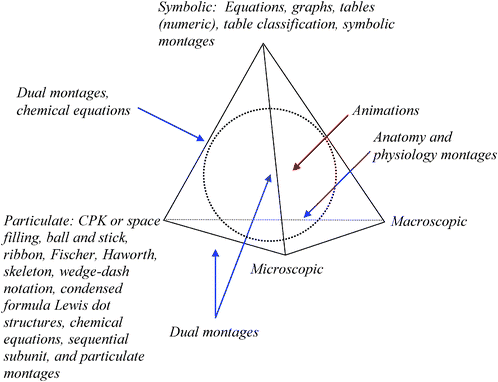 | ||
| Fig. 9 The Biochemistry Tetrahedron with the TOBER mapped on it. The blue arrows indicate ERs lying on an edge. Schematics may lie on the edges or in the interior volume of the tetrahedron. Animations lie in the interior as represented by the red arrow. | ||
The Biochemistry Tetrahedron allows one to conceptualize where schematic ERs lie as well. Those that show a chemical process such as glycolysis, but only do so using the names of chemicals or classes of chemicals (e.g. proteins or fats) rather than actual renderings of molecules would lie on the edge between symbolic and particulate domains. Fig. 10 is an example of such a schematic.
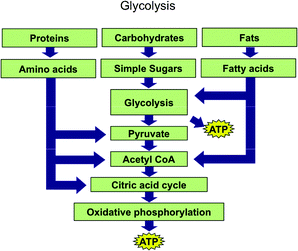 | ||
| Fig. 10 Glycolysis representation used in the first year biochemistry course coded as a schematic. | ||
Each name of a chemical in the process such as pyruvate, acetyl CoA, or ATP is putatively associated with a representation of a molecule. Faculty teaching biochemistry courses likely associate each chemical name with multiple types of particulate representations—a skeleton diagram, a condensed formula, a ball and stick model, etc. Further, they associate classes of chemicals in Fig. 10 such as proteins, carbohydrates, fats, and fatty acids with particulate representations.
Another schematic used in the first-year biochemistry course dealt with the production of biofuels shown as in Fig. 11. The schematic involved plants (macroscopic) and names of macroscopic processes (size reduction, and solid and liquid separation), particulate chemical processes (e.g. enzymatic hydrolysis), names of molecules (ethanol), and symbolic references to types of reactions (e.g. fermentation and neutralization). This particular schematic ER lies on a face of the tetrahedron between the macroscopic, symbolic, and particulate domains.
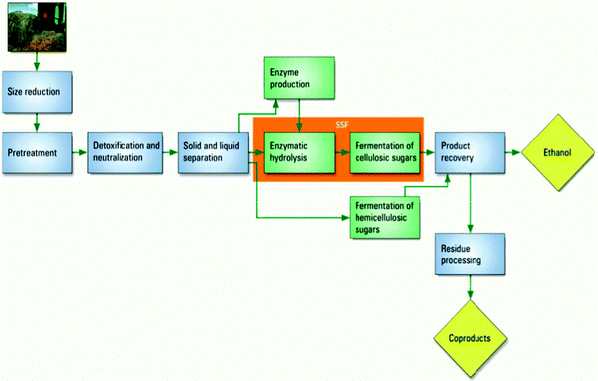 | ||
| Fig. 11 Production of ethanol through biofuels coded as a schematic in a first year biochemistry course. | ||
Anatomy and Physiology Montages were composed of an anatomical ER, an organ for example, and particulate ERs. They map on to the edge of the Biochemistry Tetrahedron defined by the macroscopic and particulate vertices. Animations lie in the interior volume of the tetrahedron mixing the domains of biochemistry in different proportions across the multimedia representations.
Connections of Ainsworth's functional taxonomy of multiple ERs to the TOBER and biochemistry tetrahedron
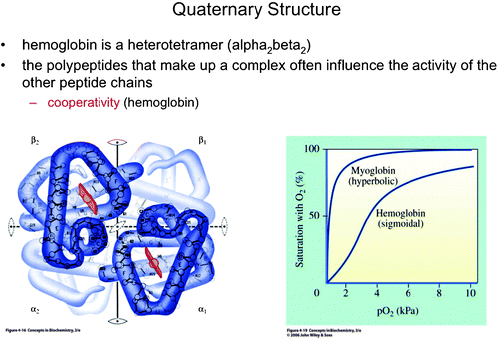 | ||
| Fig. 12 Hemoglobin and its sigmoidal binding curve. Myoglobin, which follows Michaelis–Menten behavior, was shown as a contrast to hemoglobin. The figure allows the professor to highlight complementary information in each representation and to introduce the concept of “cooperativity” (Boyer, 2005). This material is reproduced with permission of John Wiley & Sons, Inc. | ||
Montages were used in all courses observed in this study. When faculty use these types of representations in the classroom it is very important to make clear to the students how the individual ERs of the montage are related to one another. An instructor should probe for student understanding of each ER, make explicit the meaning represented by each ER as required, and use Ainsworth's taxonomy to clarify the learning outcome for the montage (1999, 2006). For example, is the purpose of the montage to further complement student understanding? Do the ERs focus attention on one particular concept or invariant feature? Are the ERs used to help students construct new understandings between familiar ERs? Montages can help students make connections between and among ERs, but it is important that the instructor be explicit about the nature of the connection and what they hope the students will learn. The student must know what each ER encodes and how that information is presented before they can connect multiple ERs in the way faculty hope to facilitate learning. To that end, Schönborn and Anderson (2010) have identified eight cognitive skills related to visual literacy in biochemistry that faculty can use to guide instruction and design assessments.
These contributions lay a foundation for rich and deep studies about the use and student understanding of biochemistry representations. For example, we have conducted research in the Towns group which investigates student understanding of a variety of protein representations and the student's the ability to make claims or inferences from multiple representations which will appear in future publications. Biochemistry as a field is filled with enormous molecular complexity and requires the integration of knowledge from chemistry and biology. Research in biochemistry education is an interdisciplinary endeavor spanning the fields of chemistry and biology education research. Developing theoretical foundations on which to base further research is critical to drive biochemistry education research forward in a meaningful grounded way.
Conclusions
This study adds to the knowledge base in chemistry and biochemistry education research by introducing the Biochemistry Tetrahedron and the TOBER which can be used as tools and frameworks for research. They provide new ways of guiding and constructing transfer studies across domains and disciplines. For practitioners they can serve as guides for faculty as they develop curricula in biochemistry. Ainsworth's functional taxonomy of multiple ERs (Ainsworth, 1999, 2006) clarifies the purpose of multiple ERs and can help researchers and practitioners consider how they can be used to construct deeper understanding, constrain and focus interpretation, or complement one another.Acknowledgements
The researchers wish to thank the professors for letting us collect observations in the three courses. This research is supported by the National Science Foundation under Grant No. 0736934 (CCLI now TUES). Any opinions, findings, and conclusions or recommendations expressed in this material are those of the authors and do not necessarily reflect the views of the National Science Foundation.References
- Ainsworth S. E., (1999), A functional taxonomy of multiple representations. Comput. Educ., 33(2/3), 131–152.
- Ainsworth S. E., (2006), DeFT: A conceptual framework for considering learning with multiple representations. Learn. Inst., 16(3), 183–198.
- Ainsworth S. E. and Van Labeke N., (2004), Multiple forms of dynamic representation. Learn. Instr., 14(3), 241–255.
- Boyer R., (2005), Concepts in Biochemistry. Hoboken, NJ: John Wiley & Sons, Inc.
- Bucat B., (2010). Language and visualization. Paper presented at the Royal Australian Chemistry Institute, Melbourne, Australia.
- Chu Y. C., (2008), Learning difficulties in genetics and the development of related attitudes in Taiwanese junior high schools. Ph.D. Thesis, University of Glasgow.
- Gabel D., (1998), The complexity of chemistry and implication for teaching. In K. G. Tobin and B. J. Fraser (ed.), International handbook of science education, (pp. 233–248). Boston, MA: Kluwer Academic Publishers.
- Gabel D. L., Samuel K. V. and Hunn D., (1987), Understanding the particular nature of matter. J. Chem. Educ., 64, 695–697.
- Gilbert J. K. and Treagust D. (Eds)., (2009), Multiple representations in chemical education (pp. 1–8). The Netherlands: Springer.
- Gilbert J. K. and Treagust D., (2009a), Introduction: Macro, submicro, and symbolic representations and the relationship between them: Key models in chemical education. In J. K. Gilbert and D. Treagust (ed.), Multiple representations in chemical education. The Netherlands: Springer.
- Goodsell D. S. and Johnson G. T., (2007), Filling the gaps: Artistic license in education and outreach. PLoS Biol. 5: e308.
- Hinton M. E. and Nakhleh M., (1999). Students, microscopic, macroscopic, and symbolic representations of chemical reactions. Chem. Educator, 4, 1–29.
- Johnstone A. H., (1991), Why is science difficult to learn? Things are seldom what they seem J. Comput. Assist. Learn., 7, 75–83.
- Kapteijn M., (1990), The functions of organizational levels in biology for describing and planning biology education. In P. L. Lijnse, Licht, Pl, de Vos, Wl, and Vaarlo, A. J. (ed.), Relating macroscopic phenomnea to microscopic particles (pp. 139–150). Utrect, Netherlands: CD-Press.
- Keig P. F. and Rubba P. A., (1993), Translation of representations of the structure of matter and its relationship to reasoning, gender, spatial reasoning, and specific prior knowledge. J. Res. Sci. Teach., 30(8), 883–903.
- Kelly R. and Jones L., (2007), Exploring how different features of animations of sodium chloride dissolution affect students' explanations. J. Sci. Educ. Tech., 16(5), 413–429.
- Kelly R. M. and Jones L. L., (2008), Investigating students' ability to transfer ideas learned from molecular animations of the dissolution process. J. Chem. Educ., 85, 303–309.
- Kozma R. B., Chin E., Russell J. and Marx N., (2000), The roles of representations and tools in the chemistry laboratory and their implications for chemistry instruction. J. Learn. Sci., 9(2), 105–143.
- Kozma R. B. and Russell J., (1997), Multimedia and understanding: Expert and novice responses to different representations of chemical phenomena. J. Res. Sci. Teach., 34, 949–968.
- Kozma R. and Russell J., (2005), Students becoming chemists: Developing representational competence. In J. K. Gilbert (Ed.), Visualization in science education (pp. 121–126). Netherlands: Springer.
- Kramer I., (2010), A search for the best methods to illustrate complex information. RCSB Protein Data Bank Newsletter, 44, 6–7. Retrieved from http://www.pdb.org/pdb/general_information/news_publications/newsletters/2009q4/education_corner.html.
- Marbach-Ad G. and Stavy R., (2000), Student's cellular and molecular explanation of genetic phenomena. J. Biol. Educ., 34(4), 200–205.
- Nakhleh M., (1994), Students' models of matter in the context of acid–base chemistry. J. Chem. Educ., 71, 495–499.
- Pribyl J. R. and Bodner G. M., (1987), Spatial ability and its role in organic Chemistry: A study of four organic courses. J. Res. Sci. Teach., 24(3), 229–240.
- Reid N., (2009), Working memory and science education: Conclusions and implications. Res. Sci. Tech. Educ., 27(2), 245–250.
- Sanger M. J. and Phelps A. J., (2007), What are students thinking when they pick their answer? A content analysis of students' explanations of gas properties. J. Chem. Educ., 84, 870–874.
- Schönborn K. J. and Anderson T. R., (2006), The Importance of visual literacy in the education of biochemists. Biochem. Mol. Biol. Edu., 34(2), 94–102.
- Schönborn K. J. and Anderson T. R., (2009), A model of factors determining students' ability to interpret external representations in biochemistry. Int. J. Sci. Educ., 31(2), 193–232.
- Schönborn K. J. and Anderson T. R., (2010), Bridging the educational research-practice gap: Foundations for assessing and developing biochemsitry students' visual literacy. Biochem. Mol. Biol. Edu., 38(5), 347–354.
- Schönborn K. J., Anderson T. R. and Grayson D. J., (2002), Student difficulties with the interpretation of a textbook diagram of immunoglobulin G (IgG). Biochem. Mol. Biol. Edu., 30(2), 93–97.
- Talanquer V., (2011), Macro, submicro, and symbolic: The many faces of the chemsitry “triplet”. Int. J. Sci. Educ., 33(2), 179–195.
- Teichert M., Tien L., Anthony S. and Rickey D., (2008), Effects of context on students' molecular-level ideas. Int. J. Sci. Educ., 30(8), 1095–1114.
- Tuckey H., Selvaratnam J. and Bradley J., (1991), Identification and rectification of student difficulties concerning three-dimensional structures, rotation, and reflection. J. Chem. Educ., 68, 460–464.
- Villafane S. M., Bailey C. P., Loertscher J., Minderhout V. and Lewis J. E., (2011), Development and analysis of an instrument to assess student understanding of foundational concepts before biochemistry coursework. Biochem. Mol. Biol. Educ., 39(2), 102–109.
- Wu H. K., Krajcik J. S. and Soloway E., (2001), Promoting understanding of chemistry representations: Students use of a visualization tool in the classroom. J. Res. Sci. Teach., 38, 821–842.
- Wu H. K. and Shah P., (2004), Exploring visuospatial thinking in chemistry learning. Sci. Educ., 88(3), 465–492.
| This journal is © The Royal Society of Chemistry 2012 |
