DOI:
10.1039/C1JM13178H
(Paper)
J. Mater. Chem., 2012,
22, 130-139
Enhanced light-harvesting capability by phenothiazine in ruthenium sensitizers with superior photovoltaic performance
Received
8th July 2011
, Accepted 28th September 2011
First published on 2nd November 2011
Abstract
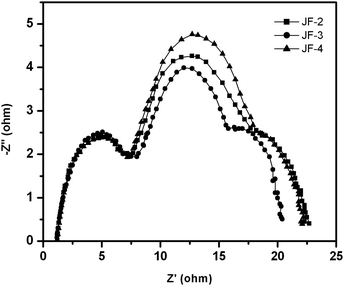
This paper reports on the design and synthesis of two new ruthenium dyes [Ru(dcbpy)(potip)(NCS)2] (JF-3, dcbpy = 4,4′-dicarboxylic acid-2,2′-bipyridine, potip = 2-(4-(10H-phenothiazin-10-yl)-5-octylthiophen-2-yl)-1H-imidazo[4,5-f][1,10]phenanthroline, and [Ru(dcbpy)(dpotip)(NCS)2] (JF-4, dpotip = 2-(4-(N,N-diphenylamino)-5-octylthiophen-2-yl)-1H-imidazo[4,5-f][1,10]phenanthroline) that contain electron-donating phenothiazine-based or N,N-diphenylamino-based ancillary ligands. The ruthenium dye JF-3, in which an excellent electron-donating phenothiazine is incorporated, shows superior DSC performance (9.1%; compared to 8.8% for N3). A comparison of the electron-donating phenothiazine and N,N-diphenylamino groups utilized in the molecular architecture of ruthenium dyes demonstrates that the phenothiazine group efficiently increases the molar extinction coefficient of band II and also broadens that band in the UV-vis absorption spectrum, reduces device resistance, increases electron lifetime, and enhances power-conversion efficiency. This finding not only clarifies the significance of multifunctionalized design in the molecular architecture of ruthenium dyes, but also represents an alternative route for the introduction of an excellent electron-donating group for improving the light-harvesting characteristics of ruthenium dyes as well as DSC performance.
1. Introduction
Humans require energy for almost any type of activity that they perform. The world annual energy consumption is ca. 4.7 × 10²⁰ J and is expected to grow by about 2% each year for the next 25 years.1,2 However, fossil fuel reserves, such as oil, coal and gas, are rapidly becoming depleted. The development of alternative energy sources to meet our needs has become a significant topic in recent years.3–5 Energy from the sunlight that strikes the earth in 1 hour exceeds all of the energy consumed by humans in an entire year. Furthermore, the energy supplied from the sun is clean and sustainable.6 Photovoltaic technology is one of the most favorable ways to convert solar energy into some forms of usable energy.7 Dye-sensitized solar cells (DSCs) have attracted widespread interest owing to the fact that they are relatively cost-effective, easy to manufacture, and can be readily shaped with flexible substrates to satisfy the demands of various applications.8,9 DSC performance is deeply affected by three crucial components: porous nanocrystalline TiO2 film, photosensitizers, and electrolyte. Since the report of the ruthenium-based photosensitizer, [Ru(dcbpy)2(NCS)2] (N3, where dcbpy = 4,4′-dicarboxylic acid-2,2′-bipyridine), by Grätzel and coworkers in 1993,10 various structural modifications have been proposed to improve its power-conversion efficiency.11–25 Certain light-harvesting chromophores such as thiophene16,25 and carbazole17 that are employed in producing multifunctionalized ruthenium dyes are known to enhance their power-conversion efficiency. In addition, the electron-donating phenothiazine was widely used to enhance the light-harvesting capability of organic dyes.26,27 Its structure is an analogous plane with a slight bending butterfly conformation in the ground state, which can impede the molecular aggregation and the formation of intermolecular excimers.26 However, issues related to how to select a beneficial chromophore to improve the light-harvesting capability of ruthenium dyes, and how it affects ruthenium dyes are still not very clear. Moreover, reports of alternate electron-donating groups that can be used for the structural modification of ruthenium dyes are also rare. In this paper, we address these issues. We introduced an excellent electron-donating phenothiazine for enhancing the light-harvesting capability of ruthenium dyes and applied the concept of multifunctionalized molecular design to the preparation of ruthenium dyes. A ruthenium dye with an electron-donating phenothiazine shows excellent photovoltaic performance greater than that with an N,N-diphenylamino group (Scheme 1). This up and down adjustment for the optimization of DSC efficiency is of fundamental importance. The origins of these effects can be explained by spectral data, theoretical studies, and device properties.
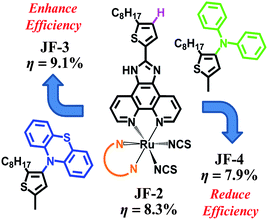 |
| | Scheme 1 The up and down adjustment of power-conversion efficiencies of the DSC with JF-2, JF-3, and JF-4. | |
2. Results and discussion
2.1. Synthesis
2-Bromo-3-(10H-phenothiazin-10-yl)thiophene and 2-bromo-3-(N,N-diphenylamino)thiophene were synthesized through a cross-coupling reaction28,29 of 3-bromothiophene with phenothiazine and N,N-diphenylamine, respectively, followed by bromination with N-bromosuccinimide (NBS) in dimethylformamide (DMF). 3-(10H-Phenothiazin-10-yl)-2-octylthiophene and 3-(N,N-diphenylamino)-2-octylthiophene were obtained by forming the dianion of their 2-bromo-3-substituted thiophene precursors with 1.2 equiv. of n-butyllithium, followed by reaction with 1-bromooctane. 4-(10H-Phenothiazin-10-yl)-5-octylthiophene-2-carbaldehyde and 4-(N,N-diphenylamino)-5-octylthiophene-2-carbaldehyde were then prepared using a synthetic procedure similar to that described above, except that N-formylpiperidine was used instead of 1-bromooctane. Eventually, the ancillary ligands, 2-(4-(10H-phenothiazin-10-yl)-5-octylthiophen-2-yl)-1H-imidazo[4,5-f][1,10]phenanthroline (potip) and 2-(4-(N,N-diphenylamino)-5-octylthiophen-2-yl)-1H-imidazo[4,5-f][1,10]phenanthroline (dpotip), were obtained by coupling the corresponding 4-(10H-phenothiazin-10-yl)-5-octylthiophene-2-carbaldehyde and 4-(N,N-diphenylamino)-5-octylthiophene-2-carbaldehyde with 1,10-phenanthroline-5,6-dione30 and ammonium acetate, which is used as the source of ammonia, in glacial acetic acid, according to protocols reported by Steck and Day.31Scheme 2 depicts the synthetic routes used in preparing the potip and dpotip ligands. The ruthenium dyes, JF-3 and JF-4 (Fig. 1), were prepared by treating a ruthenium dimer with each of the ancillary ligands, potip and dpotip, in DMF under an argon atmosphere using a typical one-pot synthesis.32 The one-pot synthesis consists of three different temperature regimes: [RuCl2(p-cymene)]2 reacts with the ancillary ligand at 80 °C, resulting in the formation of a mononuclear Ru(II) complex; the cymene ligand from the Ru(II) coordination sphere is replaced with dcbpy at 160 °C under dark conditions; and the desired ruthenium dye product is obtained by adding excess ammonium thiocyanate at 130 °C.
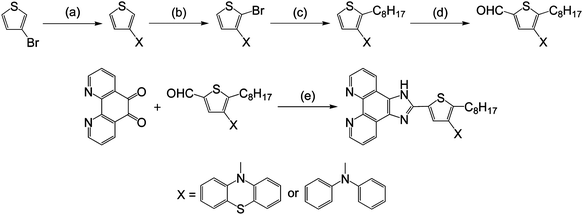 |
| | Scheme 2 Preparation of ancillary ligands, potip and dpotip: (a) Pd(dba)2, P(tBu)3, NaOtBu, toluene, reflux 1.5 h; (b) NBS, DMF, 0 °C; (c) n-butyllithium, 1-bromooctane, THF, −78 °C; (d) n-butyllithium, N-formylpiperidine, THF, −78 °C; (e) NH4OAc, CH3COOH, reflux 2 h. | |
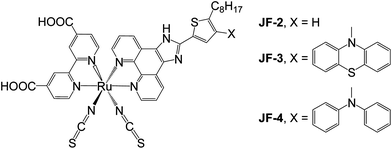 |
| | Fig. 1 Molecular structures of JF-2, JF-3, and JF-4. | |
2.2. Photophysical properties
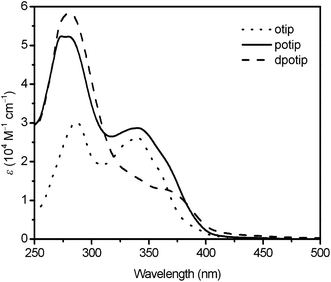
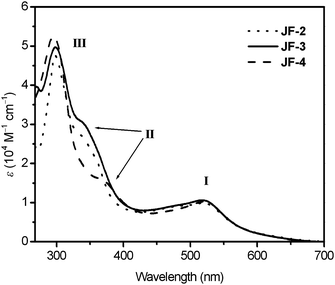
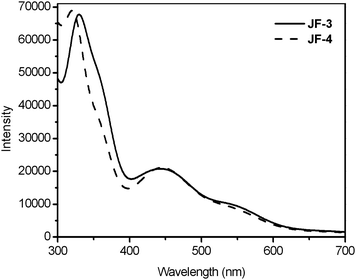
Fig. 2 shows UV-vis absorption spectra of the free ligands, potip, dpotip and otip (where otip, 2-(5-octylthiophen-2-yl)-1H-imidazo[4,5-f][1,10]phenanthroline, was used as ancillary ligand for JF-2 in our previous study,18Fig. 1), in DMF solution. All ligands display an intense absorption band with a shoulder in the UV-vis region. The absorption maxima (λmax) for all ligands are in the range of 270–290 nm. The λsh of dpotip (375 nm) is red-shifted by 35 nm compared to that (340 nm) of otip, and the molar extinction coefficient (ε) of the shoulder for dpotip is reduced to half that for otip. However, the ε value of potip is doubled at λmax and increased slightly at λsh compared with that of otip, indicating that the phenothiazine group strengthens the molar extinction coefficient in the UV-vis absorption spectra of otip. The UV-vis absorption spectra of JF-2, JF-3, and JF-4 show three main features, assigned as bands I, II (shoulder), and III with increasing energy order (Fig. 3). The UV-vis absorption data for dyes, JF-2, JF-3 and JF-4, are listed in Table 1.18 The ε values (0.99–1.05 × 10⁴ M−1 cm−1) and positions (520 nm) of the lowest metal-to-ligand charge transfer (MLCT) band I for all dyes are nearly identical. However, the ε values of band II are increased in the order JF-4 < JF-2 < JF-3. The order of the absorption band II wavelength for all dyes is consistent with that of λsh in their corresponding ancillary ligands, indicating that band II is an ancillary ligand-localized transition. Moreover, the ancillary ligand with an electron-donating phenothiazine group can efficiently increase the molar extinction coefficient of band II and hence result in superior light-harvesting characteristics.
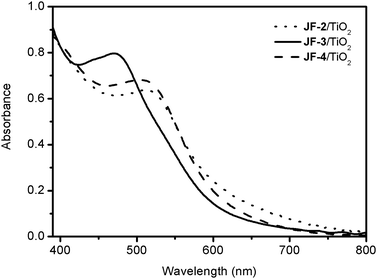
Fig. 4 shows the UV-vis absorption spectra of JF-2, JF-3 and JF-4, when anchored onto the surface of 2.4 μm thick transparent nanocrystalline TiO2 films. The lowest energy MLCT bands of JF-2/TiO2 (513 nm), JF-3/TiO2 (470 nm) and JF-4/TiO2 (510 nm) are blue-shifted by 6, 50 and 10 nm, respectively, compared with their spectra in DMF solution (Fig. 3). This blue-shift of the spectra on TiO2 films can be attributed to π-stacking interactions or the formation of aggregates on the TiO2 surface.33 In addition, one can see the broader absorption spectrum of JF-3 compared to JF-4 (and also JF-2), suggesting a better molecular planar configuration between thiophene and phenothiazine groups in JF-3 than that of thiophene and the N,N-diphenylamino group in JF-4 (vide infra).
2.3. Electrochemical behaviors
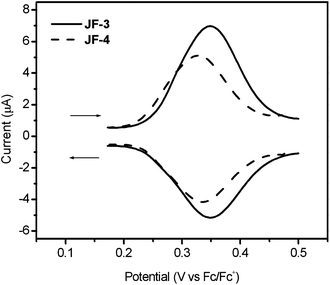
The electrochemical behaviors of dyes, JF-3 and JF-4, were investigated by square-wave voltammetry (Fig. 5) and their oxidation potentials are listed in Table 1. The redox potentials of dyes, JF-3 and JF-4, were unequivocally determined to be 0.35 and 0.33 (V vs. Fc/Fc+). The highest-occupied molecular orbital (HOMO) and lowest-unoccupied molecular orbital (LUMO) energy levels of JF-2, JF-3 and JF-4 were calculated from their oxidation potentials and their absorption edges obtained from UV-vis absorption spectra (listed in Table 1). The energy levels of the HOMO of JF-2, JF-3 and JF-4 at −5.50, −5.45 and −5.43 eV are more positive than the iodide electron donor. This provides a sufficient driving force for efficient dye regeneration, and the avoidance of geminate charge recombination. Furthermore, the energy levels of the LUMO of JF-2, JF-3 and JF-4 at −3.62, −3.65 and −3.60 eV are more negative than the conduction band of TiO2, ensuring a sufficient driving force for electron injection from the excited dyes to TiO2.
Table 1 Optical, electrochemical data of JF-3 and JF-4
| Dye |
ε/×104 M−1 cm−1 |
E
ox of RuIII/II (V vs. Fc/Fc+)b |
E
HOMO
c/eV |
E
LUMO
c/eV |
| π–π* |
π–π* or 4d–π* |
4d–π* |
|
Absorption maxima, λmax (nm).
The Ag/AgNO3 reference electrode was calibrated with a ferrocene/ferrocinium (Fc/Fc+) redox couple. The electrochemical experiments were carried out in 0.1 M tetrabutylammonium tetrafluoroborate/DMF solution.
The values of EHOMO and ELUMO were calculated with the following formula: HOMO (eV) = Eox − EFc/Fc+ + 5.1; LUMO (eV) = HOMO − Eg. Eg is the absorption onset estimated from the UV-vis absorption spectra of the sensitizers.
|
|
JF-2
|
4.76 (298)a |
2.17 (358) |
0.99 (519) |
0.38 |
−5.50 |
−3.62 |
|
JF-3
|
3.59 (298) |
3.02 (342) |
1.05 (520) |
0.35 |
−5.45 |
−3.65 |
|
JF-4
|
4.95 (296) |
1.56 (373) |
1.02 (520) |
0.33 |
−5.43 |
−3.60 |
2.4. Molecular modeling
The optimized molecular structures of JF-3 and JF-4 as well as their frontier molecular orbitals of their calculated HOMO and LUMO were computed by density functional theory (DFT), and the data are shown in Fig. 6. The HOMOs of JF-3 and JF-4 are populated from Ru-t2g to the NCS-π orbital, while their LUMOs are delocalized homogeneously on the anchoring ligand (dcbpy).
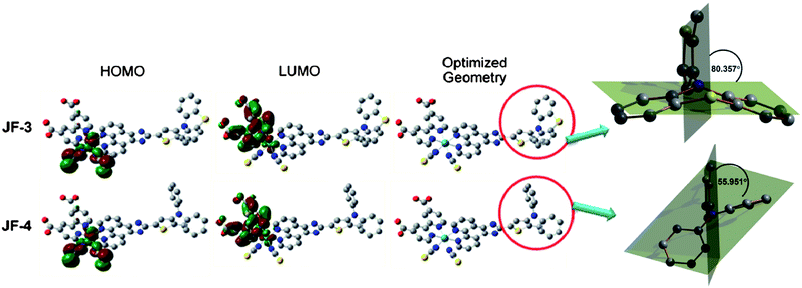 |
| | Fig. 6 Optimized molecular structures and the frontier orbitals of JF-3 and JF-4 along with isodensity plots for the HOMO and LUMO orbitals. Atoms in yellow, gray, red, cyan and blue color correspond to sulfur, carbon, oxygen, ruthenium and nitrogen, respectively. | |
This spatially directed separation of HOMO and LUMO is an ideal condition for DSCs, which is good for dye regeneration and interfacial electron injection from the excited dye to the conduction band of TiO2. On closer inspection, the dihedral angle between the planes of thiophene and phenothiazine is 80.357°, and the phenothiazine group in the structure of JF-3 is an analogous plane with a slight bending, however, the N,N-diphenylamino group in the structure of JF-4 is twisted and non-planar (Fig. 6). Therefore, the phenothiazine group is more highly conjugated than the N,N-diphenylamino group.
The calculated absorption spectra of JF-3 and JF-4 obtained by computing their optimized structures from time-dependent density functional theory (TDDFT) calculations are shown in Fig. 7. For both dyes, JF-3 and JF-4, the calculated absorption spectra from 420 to 700 nm are not different. However, the intensity of the calculated absorption spectra between 340 and 400 nm for JF-3 is obviously higher than that of JF-4. Overall, the experimental and predicted electronic spectra are in good agreement. Both the calculated results and experimental absorption spectra are consistent with the higher molar extinction coefficient of band II in JF-3 than that in JF-4.
2.5. Photovoltaic performance
As shown in Fig. 8, the short-circuit photocurrent density (Jsc), open-circuit voltage (Voc), and fill factor (ff) of the JF-3-sensitized solar cell under AM 1.5 sunlight (100 mW cm−2) are 17.1 mA cm−2, 0.74 V and 0.72, respectively, yielding an overall power-conversion efficiency (η) of 9.1% which is higher than that of JF-2 (8.3%)18 and JF-4 (7.9%). The photophysical data for the ruthenium dyes in solution showed that the ε values for band II (Fig. 3 and Table 1) are increased in the order JF-4 < JF-2 < JF-3. Moreover, the UV-vis absorption spectra of the dyes on the TiO2 film (Fig. 4) showed that the ε values are in the order JF-4 ≈ JF-2 < JF-3, which basically follow the same trend as that in the solution state. These results are consistent with the findings relative to photovoltaic performance, which is increased in the order of JF-4 < JF-2 < JF-3. The incident photon-to-current conversion efficiency (IPCE) of the JF-3-sensitized solar cell exceeds 80% in the spectral range 410–610 nm, reaching a maximum of 88% at 521 nm (Fig. 9). The calculated Jsc from the overlap integral of the IPCE spectrum of the JF-3-sensitized solar cell is 16.0 mA cm−2, and the mismatch factor34 in our device fabrication for the calculated and measured photocurrent density is less than 1.07. Data related to the photovoltaic performance for JF-3- and JF-4-sensitized solar cells are summarized in Table 2.
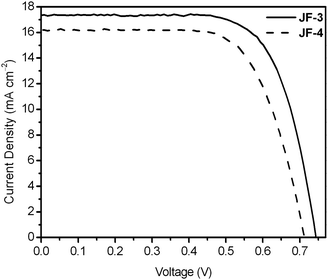 |
| | Fig. 8 Current density–voltage characteristics of the JF-3- and JF-4-sensitized solar cells under AM 1.5 simulated sunlight (100 mW cm−2) illumination (thickness of TiO2: 12 μm; cell active area: 0.16 cm2). | |
Table 2 Photovoltaic performance and parameters for JF-3 and JF-4
| Dye |
J
sc/mA cm−2 |
V
oc/V |
ff |
η
a (%) |
τ/ms |
L
n/μm |
|
The cell performance data of JF-3 and JF-4 are the average of four measurements, and the power-conversion efficiency of N3-sensitized solar cell (where N3 is [Ru(dcbpy)2(NCS)2]) measured by the same device fabrication process is 8.8%.
The values in parentheses were calculated by integration of the IPCE with the AM 1.5G solar spectrum.
|
|
JF-3
|
17.1 (16.0)b |
0.74 |
0.72 |
9.1 |
6.4 |
29.2 |
|
JF-4
|
16.1 (15.1) |
0.71 |
0.69 |
7.9 |
4.3 |
31.6 |
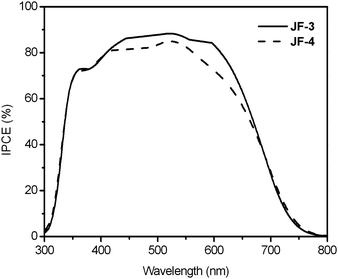 |
| | Fig. 9 Incident photon-to-current conversion efficiency spectra of JF-3- and JF-4-sensitized solar cells under AM 1.5 simulated sunlight (100 mW cm−2) illumination (thickness of TiO2: 12 μm; cell active area: 0.16 cm2). | |
3. Conclusions
In conclusion, we report on the design and synthesis of two new ruthenium dyes, JF-3 and JF-4, containing ancillary ligands with electron-donating groups. The dye JF-3, which contains an electron-donating phenothiazine group, exhibits superior device performance. A comparison of the phenothiazine and N,N-diphenylamino groups utilized in molecular engineering for ruthenium dyes demonstrates that the phenothiazine group can efficiently broaden band II and increase its molar extinction coefficient in the UV-vis absorption spectrum, reduce device resistances, increase electron lifetime, and therefore enhance power-conversion efficiency. This finding of up and down adjustment provides an alternative route for improving the light-harvesting capability of ruthenium dyes as well as DSC performance via a multifunctionalized design of the ancillary ligand.
4. Experimental
Materials and measurements
All reactants and solvents were purchased from commercial sources and were used as received. 1H NMR spectra were recorded on a Bruker AMX400 or AV400 spectrometer with tetramethylsilane as the internal standard. Elemental analyses were determined on a Perkin-Elmer 2400 CHN analyzer. Mass spectrometry was performed with a JMS-700 double focusing mass spectrometer (JEOL, Tokyo, Japan). UV-vis absorption spectra were recorded with a UV-vis spectrophotometer (Hewlett Packard 8453). The square-wave voltammetry was performed on a CH Instruments electrochemical analyzer in DMF solutions (10−3 M) with a platinum plate as the working electrode, a platinum wire auxiliary electrode, and a nonaqueous Ag/AgNO3 reference electrode. The supporting electrolyte was tetrabutylammonium tetrafluoroborate (0.1 M) and ferrocene was selected as the internal standard. The solutions were bubbled with N2 for 10 min before measurements. The scan rate for cyclic voltammetry (CV) was 100 mV s−1. The square-wave voltammograms were swept with a potential step increment of 10 mV and a frequency of 25 Hz. Electrochemical impedance spectra (EIS) of the DSCs were obtained using a potentiostat/galvanostat equipped with FRA2 modules under a constant light illumination of 100 mW cm−2 and the frequency range used was from 10 mHz to 65 kHz. The applied bias voltage and ac amplitude were set at the open-circuit voltage (Voc) of the DSCs and 10 mV, respectively.
3-(10H-Phenothiazin-10-yl)thiophene
To a two-necked flask containing 3-bromothiophene (1092.4 mg, 6.7 mmol), phenothiazine (1335.1 mg, 6.7 mmol), Pd(dba)2 (80.5 mg, 0.14 mmol) and sodium tert-butoxide (1105.3 mg, 11.5 mmol) were added a solution of tri-tert-butylphosphine in toluene (0.5 M, 0.25 mL) and 35 mL of anhydrous toluene under an argon atmosphere. The mixture was refluxed for 90 min. The hot reaction mixture was filtered to remove insoluble solids. The filtrate was concentrated under reduced pressure to give a yellow powder. The crude product was purified by chromatography using CH2Cl2/hexane (2![[thin space (1/6-em)]](https://www.rsc.org/images/entities/char_2009.gif) :
:![[thin space (1/6-em)]](https://www.rsc.org/images/entities/char_2009.gif) 8) as the eluent to afford 1248.1 mg (0.78 mmol, yield 66%) of 3-(10H-phenothiazin-10-yl)thiophene as pure white solid. 1H NMR (400 MHz, DMSO-d6, δ): 7.88 (d, J = 8.0 Hz, 1H), 7.75 (s, 1H), 7.21 (d, J = 8.0 Hz, 1H), 7.09 (d, J = 7.2 Hz, 2H), 6.99 (d, J = 6.8 Hz, 2H), 6.88 (d, J = 6.8 Hz, 2H), 6.32 (d, J = 7.2 Hz, 2H); EIMS (m/z): 281.1 [M+].
8) as the eluent to afford 1248.1 mg (0.78 mmol, yield 66%) of 3-(10H-phenothiazin-10-yl)thiophene as pure white solid. 1H NMR (400 MHz, DMSO-d6, δ): 7.88 (d, J = 8.0 Hz, 1H), 7.75 (s, 1H), 7.21 (d, J = 8.0 Hz, 1H), 7.09 (d, J = 7.2 Hz, 2H), 6.99 (d, J = 6.8 Hz, 2H), 6.88 (d, J = 6.8 Hz, 2H), 6.32 (d, J = 7.2 Hz, 2H); EIMS (m/z): 281.1 [M+].
3-(N,N-Diphenylamino)thiophene
The compound 3-(N,N-diphenylamino)thiophene was synthesized following a similar procedure to that described for the 3-(10H-phenothiazin-10-yl)thiophene, except that N,N-diphenylamine was used in place of phenothiazine. The crude product was purified by chromatography using CH2Cl2/hexane (2![[thin space (1/6-em)]](https://www.rsc.org/images/entities/char_2009.gif) :
:![[thin space (1/6-em)]](https://www.rsc.org/images/entities/char_2009.gif) 8) as the eluent to afford 3-(N,N-diphenylamino)thiophene as a pure white solid (yield 70%). 1H NMR (400 MHz, DMSO-d6, δ): 7.51 (d, J = 8.0 Hz, 1H), 7.27 (t, J = 7.6 Hz, 4H), 6.99 (m, 6H), 6.84 (d, J = 5.6 Hz, 2H); EIMS (m/z): 251.2 [M+].
8) as the eluent to afford 3-(N,N-diphenylamino)thiophene as a pure white solid (yield 70%). 1H NMR (400 MHz, DMSO-d6, δ): 7.51 (d, J = 8.0 Hz, 1H), 7.27 (t, J = 7.6 Hz, 4H), 6.99 (m, 6H), 6.84 (d, J = 5.6 Hz, 2H); EIMS (m/z): 251.2 [M+].
2-Bromo-3-(10H-phenothiazin-10-yl)thiophene
NBS (979.3 mg, 5.5 mmol) in 20 mL of DMF was added dropwise under darkness to a solution of 3-(10H-phenothiazin-10-yl)thiophene (1407.9 mg, 5.0 mmol) in DMF at 0 °C. The reaction mixture was stirred at room temperature for another 10 h before being poured into water. The organic layer was separated, and the aqueous layer was extracted with methylene chloride. The organic layers were collected, dried over anhydrous MgSO4 and the removal of the solvent gave the crude product. The crude product was purified by chromatography using CH2Cl2/hexane (2![[thin space (1/6-em)]](https://www.rsc.org/images/entities/char_2009.gif) :
:![[thin space (1/6-em)]](https://www.rsc.org/images/entities/char_2009.gif) 8) as the eluent to afford 1447.5 mg (4.02 mmol, yield 80%) of 2-bromo-3-(10H-phenothiazin-10-yl)thiophene as pure white solid. 1H NMR (400 MHz, DMSO-d6, δ): 7.98 (d, J = 5.2 Hz, 1H), 7.28 (d, J = 5.2 Hz, 1H), 7.07 (d, J = 8.4 Hz, 2H), 6.99 (t, J = 7.6 Hz, 2H), 6.88 (t, J = 7.6 Hz, 2H), 6.17 (d, J = 8.4 Hz, 2H); EIMS (m/z): 359.0 [M+].
8) as the eluent to afford 1447.5 mg (4.02 mmol, yield 80%) of 2-bromo-3-(10H-phenothiazin-10-yl)thiophene as pure white solid. 1H NMR (400 MHz, DMSO-d6, δ): 7.98 (d, J = 5.2 Hz, 1H), 7.28 (d, J = 5.2 Hz, 1H), 7.07 (d, J = 8.4 Hz, 2H), 6.99 (t, J = 7.6 Hz, 2H), 6.88 (t, J = 7.6 Hz, 2H), 6.17 (d, J = 8.4 Hz, 2H); EIMS (m/z): 359.0 [M+].
2-Bromo-3-(N,N-diphenylamino)thiophene
The compound 2-bromo-3-(N,N-diphenylamino)thiophene was synthesized following a similar procedure to that described for 2-bromo-3-(10H-phenothiazin-10-yl)thiophene, except that 3-(N,N-diphenylamino)thiophene was used in place of 3-(10H-phenothiazin-10-yl)thiophene. The crude product was purified by chromatography using CH2Cl2/hexane (2![[thin space (1/6-em)]](https://www.rsc.org/images/entities/char_2009.gif) :
:![[thin space (1/6-em)]](https://www.rsc.org/images/entities/char_2009.gif) 8) as the eluent to afford 2-bromo-3-(N,N-diphenylamino)thiophene as pure white solid (yield 87%). 1H NMR (400 MHz, DMSO-d6, δ): 7.70 (d, J = 5.6 Hz, 1H), 7.28 (t, J = 7.6 Hz, 4H), 6.99 (t, J = 7.2 Hz, 2H), 6.90 (m, 5H); EIMS (m/z): 329.1 [M+].
8) as the eluent to afford 2-bromo-3-(N,N-diphenylamino)thiophene as pure white solid (yield 87%). 1H NMR (400 MHz, DMSO-d6, δ): 7.70 (d, J = 5.6 Hz, 1H), 7.28 (t, J = 7.6 Hz, 4H), 6.99 (t, J = 7.2 Hz, 2H), 6.90 (m, 5H); EIMS (m/z): 329.1 [M+].
3-(10H-Phenothiazin-10-yl)-2-octylthiophene
2-Bromo-3-(10H-phenothiazin-10-yl)thiophene (1081.2 mg, 3.0 mmol) was dissolved in 30 mL THF in a well-dried flask under the protection of a N2 flow. The solution was cooled in a liquid nitrogen/acetone cooling bath, and n-butyllithium (2.1 mL, 3.36 mmol, 1.6 M in hexane) was then added dropwise. The cooling bath was removed, and the solution was allowed to warm to room temperature and 1-bromooctane (579.1 mg, 3.0 mmol) was then added in one portion. After 6 h, the solution was poured into 200 mL of cool water. The organic layer was separated, and the aqueous layer was extracted with ether. The organic layers were collected, dried over anhydrous MgSO4 and removal of the solvent gave the crude product. The crude product was purified by chromatography using hexane as the eluent to afford 787.6 mg (2.0 mmol, yield 67%) of 3-(10H-phenothiazin-10-yl)-2-octylthiophene as a colorless liquid. 1H NMR (400 MHz, DMSO-d6, δ): 7.66 (d, J = 5.2 Hz, 1H), 7.16 (d, J = 5.2 Hz, 1H), 7.04 (d, J = 7.2 Hz, 2H), 6.93 (d, J = 7.2 Hz, 2H), 6.83 (t, J = 7.2 Hz, 2H), 6.22 (d, J = 8.0 Hz, 2H), 2.82 (t, J = 8.2 Hz, 2H), 1.68 (m, 2H), 1.34 (m, 10H), 0.95 (t, J = 7.6 Hz, 3H); EIMS (m/z): 393.3 [M+].
3-(N,N-Diphenylamino)-2-octylthiophene
The compound 3-(N,N-diphenylamino)-2-octylthiophene was synthesized following a similar procedure to that described for 3-(10H-phenothiazin-10-yl)-2-octylthiophene, except that 2-bromo-3-(N,N-diphenylamino)thiophene was used in place of 2-bromo-3-(10H-phenothiazin-10-yl)thiophene. The crude product was purified by chromatography using hexane as the eluent to afford 3-(N,N-diphenylamino)-2-octylthiophene as colorless liquid (yield 62%). 1H NMR (400 MHz, CD2Cl2, δ): 7.25 (t, J = 8.0 Hz, 4H), 7.18 (d, J = 5.6 Hz, 1H), 7.03 (d, J = 8.0 Hz, 4H), 6.96 (t, J = 7.2 Hz, 2H), 6.82 (d, J = 5.6 Hz, 1H), 2.49 (t, J = 8.0 Hz, 2H), 1.89 (m, 2H), 1.34 (m, 10H), 0.95 (t, J = 6.4 Hz, 3H); EIMS (m/z): 363.3 [M+].
4-(10H-Phenothiazin-10-yl)-5-octylthiophene-2-carbaldehyde
3-(10H-Phenothiazin-10-yl)-2-octylthiophene (1966.5 mg, 5.0 mmol) was dissolved in 30 mL THF in a well-dried flask under the protection of a N2 flow. The solution was cooled in a liquid nitrogen/acetone cooling bath, and n-butyllithium (3.5 mL, 5.6 mmol, 1.6 M in hexane) was then added dropwise. The cooling bath was removed, and the solution was allowed to warm to room temperature and N-formylpiperidine (572.3 mg, 5.1 mmol) was then added in one portion. After 6 h, the solution was poured into 200 mL of cool water. The organic layer was separated, and the aqueous layer was extracted with ether. The organic layers were collected, dried over anhydrous MgSO4 and the removal of the solvent gave the crude product. The crude product was purified by chromatography using CH2Cl2/hexane (1![[thin space (1/6-em)]](https://www.rsc.org/images/entities/char_2009.gif) :
:![[thin space (1/6-em)]](https://www.rsc.org/images/entities/char_2009.gif) 1) as the eluent to afford 1432.5 mg (3.4 mmol, yield 68%) of 4-(10H-phenothiazin-10-yl)-5-octylthiophene-2-carbaldehyde as light yellow liquid. 1H NMR (400 MHz, DMSO-d6, δ): 9.96 (s, 1H), 8.31 (d, J = 2.8 Hz, 1H), 7.12 (d, J = 7.6 Hz, 2H), 7.01 (t, J = 7.6 Hz, 2H), 6.91 (t, J = 7.2 Hz, 2H), 6.31 (d, J = 8.0 Hz, 2H), 2.75 (t, J = 7.6 Hz, 2H), 1.52 (m, 2H), 1.33 (m, 10H), 0.98 (t, J = 8.0 Hz, 3H); EIMS (m/z): 421.3 [M+].
1) as the eluent to afford 1432.5 mg (3.4 mmol, yield 68%) of 4-(10H-phenothiazin-10-yl)-5-octylthiophene-2-carbaldehyde as light yellow liquid. 1H NMR (400 MHz, DMSO-d6, δ): 9.96 (s, 1H), 8.31 (d, J = 2.8 Hz, 1H), 7.12 (d, J = 7.6 Hz, 2H), 7.01 (t, J = 7.6 Hz, 2H), 6.91 (t, J = 7.2 Hz, 2H), 6.31 (d, J = 8.0 Hz, 2H), 2.75 (t, J = 7.6 Hz, 2H), 1.52 (m, 2H), 1.33 (m, 10H), 0.98 (t, J = 8.0 Hz, 3H); EIMS (m/z): 421.3 [M+].
4-(N,N-Diphenylamino)-5-octylthiophene-2-carbaldehyde
The compound 4-(N,N-diphenylamino)-5-octylthiophene-2-carbaldehyde was synthesized following a similar procedure to that described for 4-(10H-phenothiazin-10-yl)-5-octylthiophene-2-carbaldehyde, except that 3-(N,N-diphenylamino)-2-octylthiophene was used in place of 3-(10H-phenothiazin-10-yl)-2-octylthiophene. The crude product was purified by chromatography using CH2Cl2/hexane (1![[thin space (1/6-em)]](https://www.rsc.org/images/entities/char_2009.gif) :
:![[thin space (1/6-em)]](https://www.rsc.org/images/entities/char_2009.gif) 1) as the eluent to afford 4-(N,N-diphenylamino)-5-octylthiophene-2-carbaldehyde as light yellow liquid (yield 64%). 1H NMR (400 MHz, CD2Cl2, δ): 9.74 (s, 1H), 7.55 (s, 1H), 7.25 (t, J = 6.4 Hz, 4H), 7.01 (m, 6H), 2.52 (t, J = 7.6 Hz, 2H), 1.52 (m, 2H), 1.25 (m, 10H), 0.88 (t, J = 6.4 Hz, 3H); EIMS (m/z): 391.3 [M+].
1) as the eluent to afford 4-(N,N-diphenylamino)-5-octylthiophene-2-carbaldehyde as light yellow liquid (yield 64%). 1H NMR (400 MHz, CD2Cl2, δ): 9.74 (s, 1H), 7.55 (s, 1H), 7.25 (t, J = 6.4 Hz, 4H), 7.01 (m, 6H), 2.52 (t, J = 7.6 Hz, 2H), 1.52 (m, 2H), 1.25 (m, 10H), 0.88 (t, J = 6.4 Hz, 3H); EIMS (m/z): 391.3 [M+].
2-(4-(10H-Phenothiazin-10-yl)-5-octylthiophen-2-yl)-1H-imidazo[4,5-f][1,10]phenanthroline (potip)
A mixture of 1,10-phenanthroline-5,6-dione (210.5 mg, 1.0 mmol), 4-(10H-phenothiazin-10-yl)-5-octylthiophene-2-carbaldehyde (422.3 mg, 1.0 mmol), ammonium acetate (1550.0 mg, 20.1 mmol) and glacial acetic acid (30 mL) was refluxed for 2 h. After the reaction, the mixture was poured into 200 mL of cool water and the resulting precipitate was isolated by filtration. The crude products were washed with water and purified by chromatography using CH2Cl2/hexane/MeOH (5![[thin space (1/6-em)]](https://www.rsc.org/images/entities/char_2009.gif) :
:![[thin space (1/6-em)]](https://www.rsc.org/images/entities/char_2009.gif) 5
5![[thin space (1/6-em)]](https://www.rsc.org/images/entities/char_2009.gif) :
:![[thin space (1/6-em)]](https://www.rsc.org/images/entities/char_2009.gif) 1) as the eluent to afford potip (355.3 mg, 0.581 mmol, 58%) as yellow solid. 1H NMR (400 MHz, DMSO-d6, δ): 9.02 (d, J = 4.0 Hz, 2H), 8.80 (d, J = 7.6 Hz, 2H), 7.95 (s, 1H), 7.81 (s, 2H), 7.11 (d, J = 8.0 Hz, 2H), 7.04 (d, J = 6.4 Hz, 2H), 6.91 (t, J = 7.6 Hz, 2H), 6.47 (d, J = 8.0 Hz, 2H), 2.76 (t, J = 7.2 Hz, 2H), 1.56 (m, 2H), 1.17 (m, 10H), 0.85 (m, 3H); FABMS (m/z): 612.2 [M + H]+.
1) as the eluent to afford potip (355.3 mg, 0.581 mmol, 58%) as yellow solid. 1H NMR (400 MHz, DMSO-d6, δ): 9.02 (d, J = 4.0 Hz, 2H), 8.80 (d, J = 7.6 Hz, 2H), 7.95 (s, 1H), 7.81 (s, 2H), 7.11 (d, J = 8.0 Hz, 2H), 7.04 (d, J = 6.4 Hz, 2H), 6.91 (t, J = 7.6 Hz, 2H), 6.47 (d, J = 8.0 Hz, 2H), 2.76 (t, J = 7.2 Hz, 2H), 1.56 (m, 2H), 1.17 (m, 10H), 0.85 (m, 3H); FABMS (m/z): 612.2 [M + H]+.
2-(4-(N,N-Diphenylamino)-5-octylthiophene-2-yl)-1H-imidazo[4,5-f][1,10]phenanthroline (dpotip)
The compound dpotip was synthesized following a similar procedure to that described for potip, except that 4-(N,N-diphenylamino)-5-octylthiophene-2-carbaldehyde was used in place of 4-(10H-phenothiazin-10-yl)-5-octylthiophene-2-carbaldehyde. The crude products were washed with water and purified by chromatography using CH2Cl2/hexane/MeOH (5![[thin space (1/6-em)]](https://www.rsc.org/images/entities/char_2009.gif) :
:![[thin space (1/6-em)]](https://www.rsc.org/images/entities/char_2009.gif) 5
5![[thin space (1/6-em)]](https://www.rsc.org/images/entities/char_2009.gif) :
:![[thin space (1/6-em)]](https://www.rsc.org/images/entities/char_2009.gif) 1) as the eluent to afford dpotip (yield 57%) as brown solid. 1H NMR (400 MHz, DMSO-d6, δ): 8.99 (d, J = 2.4 Hz, 2H), 8.78 (d, J = 8.4 Hz, 2H), 7.78 (dd, J = 6.0, 8.4 Hz, 2H), 7.65 (s, 1H), 7.30 (d, J = 5.8 Hz, 4H), 6.99 (m, 6H), 2.78 (t, J = 7.6 Hz, 2H), 1.61 (m, 2H), 1.24 (m, 10H), 0.85 (t, J = 6.4 Hz, 3H); FABMS (m/z): 582.3 [M + H]+.
1) as the eluent to afford dpotip (yield 57%) as brown solid. 1H NMR (400 MHz, DMSO-d6, δ): 8.99 (d, J = 2.4 Hz, 2H), 8.78 (d, J = 8.4 Hz, 2H), 7.78 (dd, J = 6.0, 8.4 Hz, 2H), 7.65 (s, 1H), 7.30 (d, J = 5.8 Hz, 4H), 6.99 (m, 6H), 2.78 (t, J = 7.6 Hz, 2H), 1.61 (m, 2H), 1.24 (m, 10H), 0.85 (t, J = 6.4 Hz, 3H); FABMS (m/z): 582.3 [M + H]+.
[Ru(dcbpy)(potip)(NCS)2] (JF-3)
[RuCl2(p-cymene)]2 (306.4 mg, 0.5 mmol) and potip (582.5 mg, 1.0 mmol) were added to dry DMF (20 mL). The reaction mixture was heated at 80 °C under N2 for 4 h and then dcbpy (4,4′-dicarboxylic acid-2,2′-bipyridine; 244.3 mg, 1.0 mmol) was added. The reaction mixture was refluxed at 160 °C for another 4 h in the dark. Excess NH4NCS was added to the reaction mixture and heated at 130 °C for 5 h. After the reaction, the solvent was removed by a rotary evaporator. The product was collected and washed with water and diethyl ether. The crude product was dissolved in methanol and then passed through a column using methanol as the eluent. The main band was collected and concentrated, 375.3 mg (0.35 mmol, 35%) of black solid was obtained. 1H NMR (400 MHz, DMSO-d6, δ): 9.52 (m, 2H), 9.05 (m, 2H), 8.87 (s, 1H), 8.74 (s, 1H), 8.32 (m, 2H), 8.03 (s, 1H), 7.85 (d, J = 4.8 Hz, 1H), 7.68 (d, J = 5.6 Hz, 1H), 7.62 (d, J = 6.4 Hz, 1H), 7.47 (d, J = 5.6 Hz, 1H), 7.13 (d, J = 8.0 Hz, 2H), 7.04 (t, J = 7.6 Hz, 2H), 6.92 (t, J = 7.6 Hz, 2H), 6.47 (d, J = 8.0 Hz, 2H), 2.75 (t, J = 6.8 Hz, 2H), 1.59 (m, 2H), 1.23 (m, 10H), 0.86 (t, J = 6.8 Hz, 3H); FABMS (m/z): 1073.2 [M+]. Anal. Calcd for C51H41N9O4RuS4: C 57.07, H 3.85, N 11.75, S 11.95; found: C 56.67, H 3.74, N 11.49, S 11.68%.
[Ru(dcbpy)(dpotip)(NCS)2] (JF-4)
The photosensitizer JF-4 was synthesized following a similar procedure to that described for JF-3, except that dpotip was used in place of potip. The crude product was dissolved in methanol and then passed through a column using methanol as the eluent. The main band was collected and concentrated, and a black solid was obtained as the product (yield 32%). 1H NMR (400 MHz, DMSO-d6, δ): 9.50 (m, 2H), 9.12 (s, 1H), 9.02 (s, 1H), 8.93 (s, 1H), 8.66 (s, 1H), 8.32 (d, J = 4.8 Hz, 2H), 7.81 (d, J = 4.0 Hz, 1H), 7.71 (d, J = 4.8 Hz, 1H), 7.65 (d, J = 4.8 Hz, 1H), 7.56 (d, J = 5.2 Hz, 1H), 7.44 (d, J = 5.2 Hz, 1H), 7.27 (m, 4H), 6.99 (m, 6H), 2.77 (t, J = 6.8 Hz, 2H), 1.59 (m, 2H), 1.28 (m, 10H), 0.85 (t, J = 6.8 Hz, 3H); FABMS (m/z): 1043.2 [M+]. Anal. Calcd for C51H43N9O4RuS3: C 58.72, H 4.15, N 12.08, S 9.22; found: C 58.39, H 4.46, N 11.79, S 9.13%.
Molecular modeling
The geometrical properties of the dyes, JF-3 and JF-4, were studied with density functional theory (DFT) and time-dependent density functional theory (TDDFT) calculations using the Gaussian 03 (G03) program package,44 employing the DFT method with Becke's three-parameter hybrid function45 and Lee–Yang–Parr's gradient corrected correlation function46 (B3LYP). The LanL2DZ effective core potential47 was used for the ruthenium atom and the split-valence 6-31G** basis set48 was applied for hydrogen, sulfur, carbon, oxygen and nitrogen atoms. The ground-state geometries of the dye molecules were optimized in the gas phase. Molecular orbitals were visualized using ‘Gauss View 3.09’. TDDFT calculations for JF-3 and JF-4 were performed using the conductor-like polarizable continuum model method (C-PCM)49–51 with dimethylformamide (DMF) as the solvent.52 The empirical solvent data, molecular radius and dielectric constant, employed in C-PCM are 2.647 Å and 36.71, respectively.
Preparation of TiO2 electrode
Preparation of the TiO2 precursor and electrode fabrication were carried out based on previous reports.53 The TiO2 film, serving as the photoanode, was prepared by the general sol–gel method. The precursor solution was prepared according to the following procedure: to 430 mL of a vigorously stirred 0.1 M nitric acid solution, 72 mL of Ti(C3H7O)4 was slowly added dropwise to form a mixture. After hydrolysis, the mixture was heated at 85 °C in a water bath and stirred vigorously for 8 h in order to achieve peptization. When the mixture was cooled to room temperature, the resulting colloid was filtered, and then heated in an autoclave at a temperature of 240 °C for 12 h to permit the growth of the TiO2 particles. After cooling the colloid to room temperature, it was ultrasonically vibrated for 10 min. The TiO2 colloid was concentrated to 13 wt%, and 30 wt% (with respect to TiO2 weight) of poly(ethylene glycol) (PEG, Mw = 20![[thin space (1/6-em)]](https://www.rsc.org/images/entities/char_2009.gif) 000 and 200
000 and 200![[thin space (1/6-em)]](https://www.rsc.org/images/entities/char_2009.gif) 000) was added to prevent the film from cracking during drying. To fabricate the TiO2 electrode, TTIP (titanium(IV) isopropoxide) was vigorously mixed with ME (2-methoxylethanol) (in the weight ratio of 1
000) was added to prevent the film from cracking during drying. To fabricate the TiO2 electrode, TTIP (titanium(IV) isopropoxide) was vigorously mixed with ME (2-methoxylethanol) (in the weight ratio of 1![[thin space (1/6-em)]](https://www.rsc.org/images/entities/char_2009.gif) :
:![[thin space (1/6-em)]](https://www.rsc.org/images/entities/char_2009.gif) 3) to form a metallorganic solution. The metallorganic solution was then spin-coated onto clean conducting fluorine-doped tin oxide (FTO) glasses with a sheet resistivity of 13 Ω per square, followed by annealing at 500 °C for 30 min to form a compact, thin TiO2 layer. A TiO2 paste was applied thrice to the top of this compact film using a glass rod to produce the appropriate thickness. For the first coating (paste 1), the TiO2 colloid mixed with PEG having a molecular weight of 200
3) to form a metallorganic solution. The metallorganic solution was then spin-coated onto clean conducting fluorine-doped tin oxide (FTO) glasses with a sheet resistivity of 13 Ω per square, followed by annealing at 500 °C for 30 min to form a compact, thin TiO2 layer. A TiO2 paste was applied thrice to the top of this compact film using a glass rod to produce the appropriate thickness. For the first coating (paste 1), the TiO2 colloid mixed with PEG having a molecular weight of 200![[thin space (1/6-em)]](https://www.rsc.org/images/entities/char_2009.gif) 000 was used. The second coating used a TiO2 paste (paste 2) containing a TiO2 colloid and PEG with a molecular weight of 20
000 was used. The second coating used a TiO2 paste (paste 2) containing a TiO2 colloid and PEG with a molecular weight of 20![[thin space (1/6-em)]](https://www.rsc.org/images/entities/char_2009.gif) 000. Paste 2 mixed with the light scattering particles of TiO2 (300 nm, 30 wt% in total TiO2) was used for the third (final) coating to reduce light loss by back scattering.
000. Paste 2 mixed with the light scattering particles of TiO2 (300 nm, 30 wt% in total TiO2) was used for the third (final) coating to reduce light loss by back scattering.
Device fabrication of dye-sensitized solar cells
The TiO2 film electrode with a 0.4 × 0.4 cm2 geometric area was immersed overnight in acetonitrile/tert-butanol mixtures (volume ratio 1![[thin space (1/6-em)]](https://www.rsc.org/images/entities/char_2009.gif) :
:![[thin space (1/6-em)]](https://www.rsc.org/images/entities/char_2009.gif) 1) containing 2 × 10⁻⁴ M dye sensitizers. A platinized FTO was used as a counter-electrode and had an active area of 0.16 cm2, produced by adhering a polyester tape with a thickness of 60 μm. The dye-sensitized photoanode was rinsed with acetonitrile and air-dried. After filling the spacer with electrolyte, the photoanode was placed on top of the counter-electrode and was then tightly clipped to form a cell. The electrolyte was composed of 0.6 M butylmethylimidazolim (BMII), 0.1 M LiI, 0.5 M 4-tert-butylpyridine, 0.03 M I2, and 0.5 M guanidinium thiocyanate (GuSCN) dissolved in acetonitrile. The photovoltaic characterizations of the solar cells with a mask (0.5 × 0.5 cm2) were carried out using a 150 W Peccell solar simulator (PEC-L11). Light intensity attenuated by a neutral density filter (Optosigma, 078–0360) at the measuring (cell) position was calibrated to be 100 mW cm−2 according to the reading from a radiant power meter (Oriel, 70260) connected by means of a thermopile probe (Oriel, 70263). Photoelectrochemical measurements (photocurrent density–voltage curves) of the DSCs were recorded using a potentiostat/galvanostat (PGSTAT 30, Autolab, Eco-Chemie, The Netherlands).
1) containing 2 × 10⁻⁴ M dye sensitizers. A platinized FTO was used as a counter-electrode and had an active area of 0.16 cm2, produced by adhering a polyester tape with a thickness of 60 μm. The dye-sensitized photoanode was rinsed with acetonitrile and air-dried. After filling the spacer with electrolyte, the photoanode was placed on top of the counter-electrode and was then tightly clipped to form a cell. The electrolyte was composed of 0.6 M butylmethylimidazolim (BMII), 0.1 M LiI, 0.5 M 4-tert-butylpyridine, 0.03 M I2, and 0.5 M guanidinium thiocyanate (GuSCN) dissolved in acetonitrile. The photovoltaic characterizations of the solar cells with a mask (0.5 × 0.5 cm2) were carried out using a 150 W Peccell solar simulator (PEC-L11). Light intensity attenuated by a neutral density filter (Optosigma, 078–0360) at the measuring (cell) position was calibrated to be 100 mW cm−2 according to the reading from a radiant power meter (Oriel, 70260) connected by means of a thermopile probe (Oriel, 70263). Photoelectrochemical measurements (photocurrent density–voltage curves) of the DSCs were recorded using a potentiostat/galvanostat (PGSTAT 30, Autolab, Eco-Chemie, The Netherlands).
Acknowledgements
This work was financially supported by Academia Sinica, Taiwan. We thank Dr H.-F. Lu, C.-H. Huang, and Dr C.-J. Lin for valuable discussion.
References
-
International Energy Outlook 2008, Energy Information Administration, 2008, http://www.eia.doe.gov/oiaf/ieo/index.html.
-
Basic Research Needs for Solar Energy Utilization, BES Workshop on Solar Energy Utilization, April 18–25, 2005.
- M. Grätzel, Acc. Chem. Res., 2009, 42, 1788 CrossRef.
- Y. Luo, D. Li and Q. Meng, Adv. Mater., 2009, 21, 4647 CrossRef CAS.
- A. B. F. Martinson, T. W. Hamann, M. J. Pellin and J. T. Hupp, Chem.–Eur. J., 2008, 14, 4458 CrossRef CAS.
- N. S. Lewis, Science, 2007, 315, 798 CrossRef CAS.
- N. Robertson, Angew. Chem., Int. Ed., 2006, 45, 2338 CrossRef CAS.
- M. Grätzel, Nature, 2001, 414, 338 CrossRef.
- B. O'Regan and M. Grätzel, Nature, 1991, 353, 737 CrossRef CAS.
- M. K. Nazeeruddin, A. Key, L. Rodicio, R. Humphrey-Baker, E. Müller, P. Liska, N. Vlachopoulos and M. Grätzel, J. Am. Chem. Soc., 1993, 115, 6382 CrossRef CAS.
- J. F. Yin, J. G. Chen, Z. Z. Lu, K. C. Ho, H. C. Lin and K. L. Lu, Chem. Mater., 2010, 22, 4392 CrossRef CAS.
- S.-H. Fan, A.-G. Zhang, C.-C. Ju, L.-H. Gao and K.-Z. Wang, Inorg. Chem., 2010, 49, 3752 CrossRef CAS.
- B. C. O'Regan, K. Walley, M. Juozapavicius, A. Anderson, F. Matar, T. Ghaddar, S. M. Zakeeruddin, C. Klein and J. R. Durrant, J. Am. Chem. Soc., 2009, 131, 3541 CrossRef CAS.
- Q. Yu, S. Liu, M. Zhang, N. Cai, Y. Wang and P. Wang, J. Phys. Chem. C, 2009, 113, 14559 CAS.
- J.-J. Kim, H. Choi, C. Kim, M.-S. Kang, H. S. Kang and J. Ko, Chem. Mater., 2009, 21, 5719 CrossRef CAS.
- C. Y. Chen, S. J. Wu, C. G. Wu, J. G. Chen and K. C. Ho, Angew. Chem., Int. Ed., 2006, 45, 5822 CrossRef CAS.
- C. Y. Chen, J. G. Chen, S. J. Wu, J. Y. Li, C. G. Wu and K. C. Ho, Angew. Chem., Int. Ed., 2008, 47, 7342 CrossRef CAS.
- J. F. Yin, D. Bhattacharya, Y. C. Hsu, C. C. Tsai, K. L. Lu, H. C. Lin, J. G. Chen and K. C. Ho, J. Mater. Chem., 2009, 19, 7036 RSC.
- F. Gao, Y. Wang, D. Shi, J. Zhang, M. Wang, X. Jing, R. Humphry-Baker, P. Wang, S. M. Zakeeruddin and M. Grätzel, J. Am. Chem. Soc., 2008, 130, 10720 CrossRef CAS.
- F. Gao, Y. Wang, J. Zhang, D. Shi, M. Wang, R. Humphry-Baker, P. Wang, S. M. Zakeeruddin and M. Grätzel, Chem. Commun., 2008, 2635 RSC.
- F. Matar, T. H. Ghaddar, K. Walley, T. DosSantos, J. R. Durrant and B. O′Regan, J. Mater. Chem., 2008, 18, 4246 RSC.
- C. Y. Chen, S. J. Wu, J. Y. Li, C. G. Wu, J. G. Chen and K. C. Ho, Adv. Mater., 2007, 19, 3888 CrossRef CAS.
- S.-R. Jang, C. Lee, H. Choi, J. J. Ko, J. Lee, R. Vittal and K.-J. Kim, Chem. Mater., 2006, 18, 5604 CrossRef CAS.
- P. Wang, C. Klein, R. Humphrey-Baker, S. M. Zakeeruddin and M. Grätzel, J. Am. Chem. Soc., 2005, 127, 808 CrossRef CAS.
- K.-J. Jiang, N. Masaki, J.-b. Xia, S. Noda and S. Yanagida, Chem. Commun., 2006, 2460 RSC.
- W. Wu, J. Yang, J. Hua, J. Tang, L. Zhang, Y. Long and H. Tian, J. Mater. Chem., 2010, 20, 1772 RSC.
- H. Tian, X. Yang, R. Chen, Y. Pan, L. Li, A. Hagfeldt and L. Sun, Chem. Commun., 2007, 3741 RSC.
- T. Okamoto, M. Kuratsu, M. Kozaki, K. Hirotsu, A. Ichimura, T. Matsushita and K. Okada, Org. Lett., 2004, 6, 3493 CrossRef CAS.
- J. F. Hartwig, M. Kawatsura, S. I. Hauck, K. H. Shaughnessy and L. M. Alcazar-Roman, J. Org. Chem., 1999, 64, 5575 CrossRef CAS.
- M. Yamada, Y. Tanaka, Y. Yoshimoto, S. Kuroda and I. Shimao, Bull. Chem. Soc. Jpn., 1992, 65, 1006 CrossRef CAS.
- E. A. Steck and A. R. Day, J. Am. Chem. Soc., 1943, 65, 452 CrossRef CAS.
- M. K. Nazeeruddin, S. M. Zakeeruddin, J.-J. Lagref, P. Liska, P. Comte, C. Barolo, G. Viscardi, K. Schenk and M. Grätzel, Coord. Chem. Rev., 2004, 248, 1317 CrossRef CAS.
- M. K. R. Fischer, S. Wenger, M. Wang, A. Mishra, S. M. Zakeeruddin, M. Grätzel and P. Bäuerle, Chem. Mater., 2010, 22, 1836 CrossRef CAS.
- V. Shrotriya, G. Li, Y. Yao, T. Moriarty, K. Emery and Y. Yang, Adv. Funct. Mater., 2006, 16, 2016 CrossRef CAS.
- S.-R. Jang, J.-H. Yum, C. Klein, K.-J. Kim, P. Wagner, D. Officer, M. Grätzel and M. K. Nazeeruddin, J. Phys. Chem. C, 2009, 113, 1998 CAS.
- J. M. Kroon, N. J. Bakker, H. J. P. Smit, P. Liska, K. R. Thampi, P. Wang, S. M. Zakeeruddin, M. Grätzel, A. Hinsch, S. Hore, U. Würfel, R. Sastrawan, J. R. Durrant, E. Palomares, H. Pettersson, T. Gruszecki, J. Walter, K. Skupien and G. E. Tulloch, Progr. Photovolt.: Res. Appl., 2007, 15, 1 CrossRef CAS.
- Q. Wang, S. Ito, M. Grätzel, F. Fabregat-Santiago, I. Mora-Seró, J. Bisquert, T. Bessho and H. Imai, J. Phys. Chem. B, 2006, 110, 25210 CrossRef CAS.
- Q. Wang, J.-E. Moser and M. Grätzel, J. Phys. Chem. B, 2005, 109, 14945 CrossRef CAS.
- L. Y. Lin, C. H. Tsai, K. T. Wong, T. W. Huang, L. Hsieh, S. H. Liu, H. W. Lin, C. C. Wu, S. H. Chou, S. H. Chen and A. I. Tsai, J. Org. Chem., 2010, 75, 4778 CrossRef CAS.
- C. Teng, X. Yang, C. Yang, S. Li, M. Cheng, A. Hagfeldt and L. Sun, J. Phys. Chem. C, 2010, 114, 9101 CAS.
- C. Teng, X. Yang, C. Yang, H. Tian, S. Li, X. Wang, A. Hagfeldt and L. Sun, J. Phys. Chem. C, 2010, 114, 11305 CAS.
- F. Fabregat-Santiago, J. Bisquert, L. Cevey, P. Chen, M. Wang, S. M. Zakeeruddin and M. Grätzel, J. Am. Chem. Soc., 2009, 131, 558 CrossRef CAS.
- D. Kuang, S. Ito, B. Wenger, C. Klein, J.-E. Moser, R. Humphry-Baker, S. M. Zakeeruddin and M. Grätzel, J. Am. Chem. Soc., 2006, 128, 4146 CrossRef CAS.
-
M. J. Frisch, G. W. Trucks, H. B. Schlegel, G. E. Scuseria, M. A. Robb, J. R. Cheeseman, J. A. Montgomery, Jr, T. Vreven, K. N. Kudin, J. C. Burant, J. M. Millam, S. S. Iyengar, J. Tomasi, V. Barone, B. Mennucci, M. Cossi, G. Scalmani, N. Rega, G. A. Petersson, H. Nakatsuji, M. Hada, M. Ehara, K. Toyota, R. Fukuda, J. Hasegawa, M. Ishida, T. Nakajima, Y. Honda, O. Kitao, H. Nakai, M. Klene, X. Li, J. E. Knox, H. P. Hratchian, J. B. Cross, V. Bakken, C. Adamo, J. Jaramillo, R. Gomperts, R. E. Stratmann, O. Yazyev, A. J. Austin, R. Cammi, C. Pomelli, J. Ochterski, P. Y. Ayala, K. Morokuma, G. A. Voth, P. Salvador, J. J. Dannenberg, V. G. Zakrzewski, S. Dapprich, A. D. Daniels, M. C. Strain, O. Farkas, D. K. Malick, A. D. Rabuck, K. Raghavachari, J. B. Foresman, J. V. Ortiz, Q. Cui, A. G. Baboul, S. Clifford, J. Cioslowski, B. B. Stefanov, G. Liu, A. Liashenko, P. Piskorz, I. Komaromi, R. L. Martin, D. J. Fox, T. Keith, M. A. Al-Laham, C. Y. Peng, A. Nanayakkara, M. Challacombe, P. M. W. Gill, B. G. Johnson, W. Chen, M. W. Wong, C. Gonzalez and J. A. Pople, Gaussian 03, Revision D.01, Gaussian Inc., Wallingford, CT, 2004 Search PubMed.
- A. D. Becke, J. Chem. Phys., 1993, 98, 5648 CrossRef CAS.
- C. Lee, W. Yang and R. G. Parr, Phys. Rev. B, 1988, 37, 785 CrossRef CAS.
- P. J. Hay and W. R. Wadt, J. Chem. Phys., 1985, 82, 270 CrossRef CAS.
- A. D. McLean and G. S. Chandler, J. Chem. Phys., 1980, 72, 5639 CrossRef CAS.
- M. Cossi, N. Rega, G. Scalmani and V. Barone, J. Comput. Chem., 2003, 24, 669 CrossRef CAS.
- M. Cossi and V. Barone, J. Chem. Phys., 2001, 115, 4708 CrossRef CAS.
- V. Barone and M. Cossi, J. Phys. Chem. A, 1998, 102, 1995 CrossRef CAS.
- E. S. Böes, P. R. Livotto and H. Stassen, Chem. Phys., 2006, 331, 142 CrossRef.
- Y. C. Hsu, H. Zheng, J. T. Lin and K. C. Ho, Sol. Energy Mater. Sol. Cells, 2005, 87, 357 CrossRef CAS.
|
| This journal is © The Royal Society of Chemistry 2012 |





![[thin space (1/6-em)]](https://www.rsc.org/images/entities/char_2009.gif) :
:![[thin space (1/6-em)]](https://www.rsc.org/images/entities/char_2009.gif) 8) as the eluent to afford 1248.1 mg (0.78 mmol, yield 66%) of 3-(10H-phenothiazin-10-yl)thiophene as pure white solid. 1H NMR (400 MHz, DMSO-d6, δ): 7.88 (d, J = 8.0 Hz, 1H), 7.75 (s, 1H), 7.21 (d, J = 8.0 Hz, 1H), 7.09 (d, J = 7.2 Hz, 2H), 6.99 (d, J = 6.8 Hz, 2H), 6.88 (d, J = 6.8 Hz, 2H), 6.32 (d, J = 7.2 Hz, 2H); EIMS (m/z): 281.1 [M+].
8) as the eluent to afford 1248.1 mg (0.78 mmol, yield 66%) of 3-(10H-phenothiazin-10-yl)thiophene as pure white solid. 1H NMR (400 MHz, DMSO-d6, δ): 7.88 (d, J = 8.0 Hz, 1H), 7.75 (s, 1H), 7.21 (d, J = 8.0 Hz, 1H), 7.09 (d, J = 7.2 Hz, 2H), 6.99 (d, J = 6.8 Hz, 2H), 6.88 (d, J = 6.8 Hz, 2H), 6.32 (d, J = 7.2 Hz, 2H); EIMS (m/z): 281.1 [M+].
![[thin space (1/6-em)]](https://www.rsc.org/images/entities/char_2009.gif) :
:![[thin space (1/6-em)]](https://www.rsc.org/images/entities/char_2009.gif) 8) as the eluent to afford 3-(N,N-diphenylamino)thiophene as a pure white solid (yield 70%). 1H NMR (400 MHz, DMSO-d6, δ): 7.51 (d, J = 8.0 Hz, 1H), 7.27 (t, J = 7.6 Hz, 4H), 6.99 (m, 6H), 6.84 (d, J = 5.6 Hz, 2H); EIMS (m/z): 251.2 [M+].
8) as the eluent to afford 3-(N,N-diphenylamino)thiophene as a pure white solid (yield 70%). 1H NMR (400 MHz, DMSO-d6, δ): 7.51 (d, J = 8.0 Hz, 1H), 7.27 (t, J = 7.6 Hz, 4H), 6.99 (m, 6H), 6.84 (d, J = 5.6 Hz, 2H); EIMS (m/z): 251.2 [M+].
![[thin space (1/6-em)]](https://www.rsc.org/images/entities/char_2009.gif) :
:![[thin space (1/6-em)]](https://www.rsc.org/images/entities/char_2009.gif) 8) as the eluent to afford 1447.5 mg (4.02 mmol, yield 80%) of 2-bromo-3-(10H-phenothiazin-10-yl)thiophene as pure white solid. 1H NMR (400 MHz, DMSO-d6, δ): 7.98 (d, J = 5.2 Hz, 1H), 7.28 (d, J = 5.2 Hz, 1H), 7.07 (d, J = 8.4 Hz, 2H), 6.99 (t, J = 7.6 Hz, 2H), 6.88 (t, J = 7.6 Hz, 2H), 6.17 (d, J = 8.4 Hz, 2H); EIMS (m/z): 359.0 [M+].
8) as the eluent to afford 1447.5 mg (4.02 mmol, yield 80%) of 2-bromo-3-(10H-phenothiazin-10-yl)thiophene as pure white solid. 1H NMR (400 MHz, DMSO-d6, δ): 7.98 (d, J = 5.2 Hz, 1H), 7.28 (d, J = 5.2 Hz, 1H), 7.07 (d, J = 8.4 Hz, 2H), 6.99 (t, J = 7.6 Hz, 2H), 6.88 (t, J = 7.6 Hz, 2H), 6.17 (d, J = 8.4 Hz, 2H); EIMS (m/z): 359.0 [M+].
![[thin space (1/6-em)]](https://www.rsc.org/images/entities/char_2009.gif) :
:![[thin space (1/6-em)]](https://www.rsc.org/images/entities/char_2009.gif) 8) as the eluent to afford 2-bromo-3-(N,N-diphenylamino)thiophene as pure white solid (yield 87%). 1H NMR (400 MHz, DMSO-d6, δ): 7.70 (d, J = 5.6 Hz, 1H), 7.28 (t, J = 7.6 Hz, 4H), 6.99 (t, J = 7.2 Hz, 2H), 6.90 (m, 5H); EIMS (m/z): 329.1 [M+].
8) as the eluent to afford 2-bromo-3-(N,N-diphenylamino)thiophene as pure white solid (yield 87%). 1H NMR (400 MHz, DMSO-d6, δ): 7.70 (d, J = 5.6 Hz, 1H), 7.28 (t, J = 7.6 Hz, 4H), 6.99 (t, J = 7.2 Hz, 2H), 6.90 (m, 5H); EIMS (m/z): 329.1 [M+].
![[thin space (1/6-em)]](https://www.rsc.org/images/entities/char_2009.gif) :
:![[thin space (1/6-em)]](https://www.rsc.org/images/entities/char_2009.gif) 1) as the eluent to afford 1432.5 mg (3.4 mmol, yield 68%) of 4-(10H-phenothiazin-10-yl)-5-octylthiophene-2-carbaldehyde as light yellow liquid. 1H NMR (400 MHz, DMSO-d6, δ): 9.96 (s, 1H), 8.31 (d, J = 2.8 Hz, 1H), 7.12 (d, J = 7.6 Hz, 2H), 7.01 (t, J = 7.6 Hz, 2H), 6.91 (t, J = 7.2 Hz, 2H), 6.31 (d, J = 8.0 Hz, 2H), 2.75 (t, J = 7.6 Hz, 2H), 1.52 (m, 2H), 1.33 (m, 10H), 0.98 (t, J = 8.0 Hz, 3H); EIMS (m/z): 421.3 [M+].
1) as the eluent to afford 1432.5 mg (3.4 mmol, yield 68%) of 4-(10H-phenothiazin-10-yl)-5-octylthiophene-2-carbaldehyde as light yellow liquid. 1H NMR (400 MHz, DMSO-d6, δ): 9.96 (s, 1H), 8.31 (d, J = 2.8 Hz, 1H), 7.12 (d, J = 7.6 Hz, 2H), 7.01 (t, J = 7.6 Hz, 2H), 6.91 (t, J = 7.2 Hz, 2H), 6.31 (d, J = 8.0 Hz, 2H), 2.75 (t, J = 7.6 Hz, 2H), 1.52 (m, 2H), 1.33 (m, 10H), 0.98 (t, J = 8.0 Hz, 3H); EIMS (m/z): 421.3 [M+].
![[thin space (1/6-em)]](https://www.rsc.org/images/entities/char_2009.gif) :
:![[thin space (1/6-em)]](https://www.rsc.org/images/entities/char_2009.gif) 1) as the eluent to afford 4-(N,N-diphenylamino)-5-octylthiophene-2-carbaldehyde as light yellow liquid (yield 64%). 1H NMR (400 MHz, CD2Cl2, δ): 9.74 (s, 1H), 7.55 (s, 1H), 7.25 (t, J = 6.4 Hz, 4H), 7.01 (m, 6H), 2.52 (t, J = 7.6 Hz, 2H), 1.52 (m, 2H), 1.25 (m, 10H), 0.88 (t, J = 6.4 Hz, 3H); EIMS (m/z): 391.3 [M+].
1) as the eluent to afford 4-(N,N-diphenylamino)-5-octylthiophene-2-carbaldehyde as light yellow liquid (yield 64%). 1H NMR (400 MHz, CD2Cl2, δ): 9.74 (s, 1H), 7.55 (s, 1H), 7.25 (t, J = 6.4 Hz, 4H), 7.01 (m, 6H), 2.52 (t, J = 7.6 Hz, 2H), 1.52 (m, 2H), 1.25 (m, 10H), 0.88 (t, J = 6.4 Hz, 3H); EIMS (m/z): 391.3 [M+].
![[thin space (1/6-em)]](https://www.rsc.org/images/entities/char_2009.gif) :
:![[thin space (1/6-em)]](https://www.rsc.org/images/entities/char_2009.gif) 5
5![[thin space (1/6-em)]](https://www.rsc.org/images/entities/char_2009.gif) :
:![[thin space (1/6-em)]](https://www.rsc.org/images/entities/char_2009.gif) 1) as the eluent to afford potip (355.3 mg, 0.581 mmol, 58%) as yellow solid. 1H NMR (400 MHz, DMSO-d6, δ): 9.02 (d, J = 4.0 Hz, 2H), 8.80 (d, J = 7.6 Hz, 2H), 7.95 (s, 1H), 7.81 (s, 2H), 7.11 (d, J = 8.0 Hz, 2H), 7.04 (d, J = 6.4 Hz, 2H), 6.91 (t, J = 7.6 Hz, 2H), 6.47 (d, J = 8.0 Hz, 2H), 2.76 (t, J = 7.2 Hz, 2H), 1.56 (m, 2H), 1.17 (m, 10H), 0.85 (m, 3H); FABMS (m/z): 612.2 [M + H]+.
1) as the eluent to afford potip (355.3 mg, 0.581 mmol, 58%) as yellow solid. 1H NMR (400 MHz, DMSO-d6, δ): 9.02 (d, J = 4.0 Hz, 2H), 8.80 (d, J = 7.6 Hz, 2H), 7.95 (s, 1H), 7.81 (s, 2H), 7.11 (d, J = 8.0 Hz, 2H), 7.04 (d, J = 6.4 Hz, 2H), 6.91 (t, J = 7.6 Hz, 2H), 6.47 (d, J = 8.0 Hz, 2H), 2.76 (t, J = 7.2 Hz, 2H), 1.56 (m, 2H), 1.17 (m, 10H), 0.85 (m, 3H); FABMS (m/z): 612.2 [M + H]+.
![[thin space (1/6-em)]](https://www.rsc.org/images/entities/char_2009.gif) :
:![[thin space (1/6-em)]](https://www.rsc.org/images/entities/char_2009.gif) 5
5![[thin space (1/6-em)]](https://www.rsc.org/images/entities/char_2009.gif) :
:![[thin space (1/6-em)]](https://www.rsc.org/images/entities/char_2009.gif) 1) as the eluent to afford dpotip (yield 57%) as brown solid. 1H NMR (400 MHz, DMSO-d6, δ): 8.99 (d, J = 2.4 Hz, 2H), 8.78 (d, J = 8.4 Hz, 2H), 7.78 (dd, J = 6.0, 8.4 Hz, 2H), 7.65 (s, 1H), 7.30 (d, J = 5.8 Hz, 4H), 6.99 (m, 6H), 2.78 (t, J = 7.6 Hz, 2H), 1.61 (m, 2H), 1.24 (m, 10H), 0.85 (t, J = 6.4 Hz, 3H); FABMS (m/z): 582.3 [M + H]+.
1) as the eluent to afford dpotip (yield 57%) as brown solid. 1H NMR (400 MHz, DMSO-d6, δ): 8.99 (d, J = 2.4 Hz, 2H), 8.78 (d, J = 8.4 Hz, 2H), 7.78 (dd, J = 6.0, 8.4 Hz, 2H), 7.65 (s, 1H), 7.30 (d, J = 5.8 Hz, 4H), 6.99 (m, 6H), 2.78 (t, J = 7.6 Hz, 2H), 1.61 (m, 2H), 1.24 (m, 10H), 0.85 (t, J = 6.4 Hz, 3H); FABMS (m/z): 582.3 [M + H]+.
![[thin space (1/6-em)]](https://www.rsc.org/images/entities/char_2009.gif) 000 and 200
000 and 200![[thin space (1/6-em)]](https://www.rsc.org/images/entities/char_2009.gif) 000) was added to prevent the film from cracking during drying. To fabricate the TiO2 electrode, TTIP (titanium(IV) isopropoxide) was vigorously mixed with ME (2-methoxylethanol) (in the weight ratio of 1
000) was added to prevent the film from cracking during drying. To fabricate the TiO2 electrode, TTIP (titanium(IV) isopropoxide) was vigorously mixed with ME (2-methoxylethanol) (in the weight ratio of 1![[thin space (1/6-em)]](https://www.rsc.org/images/entities/char_2009.gif) :
:![[thin space (1/6-em)]](https://www.rsc.org/images/entities/char_2009.gif) 3) to form a metallorganic solution. The metallorganic solution was then spin-coated onto clean conducting fluorine-doped tin oxide (FTO) glasses with a sheet resistivity of 13 Ω per square, followed by annealing at 500 °C for 30 min to form a compact, thin TiO2 layer. A TiO2 paste was applied thrice to the top of this compact film using a glass rod to produce the appropriate thickness. For the first coating (paste 1), the TiO2 colloid mixed with PEG having a molecular weight of 200
3) to form a metallorganic solution. The metallorganic solution was then spin-coated onto clean conducting fluorine-doped tin oxide (FTO) glasses with a sheet resistivity of 13 Ω per square, followed by annealing at 500 °C for 30 min to form a compact, thin TiO2 layer. A TiO2 paste was applied thrice to the top of this compact film using a glass rod to produce the appropriate thickness. For the first coating (paste 1), the TiO2 colloid mixed with PEG having a molecular weight of 200![[thin space (1/6-em)]](https://www.rsc.org/images/entities/char_2009.gif) 000 was used. The second coating used a TiO2 paste (paste 2) containing a TiO2 colloid and PEG with a molecular weight of 20
000 was used. The second coating used a TiO2 paste (paste 2) containing a TiO2 colloid and PEG with a molecular weight of 20![[thin space (1/6-em)]](https://www.rsc.org/images/entities/char_2009.gif) 000. Paste 2 mixed with the light scattering particles of TiO2 (300 nm, 30 wt% in total TiO2) was used for the third (final) coating to reduce light loss by back scattering.
000. Paste 2 mixed with the light scattering particles of TiO2 (300 nm, 30 wt% in total TiO2) was used for the third (final) coating to reduce light loss by back scattering.
![[thin space (1/6-em)]](https://www.rsc.org/images/entities/char_2009.gif) :
:![[thin space (1/6-em)]](https://www.rsc.org/images/entities/char_2009.gif) 1) containing 2 × 10⁻⁴ M dye sensitizers. A platinized FTO was used as a counter-electrode and had an active area of 0.16 cm2, produced by adhering a polyester tape with a thickness of 60 μm. The dye-sensitized photoanode was rinsed with acetonitrile and air-dried. After filling the spacer with electrolyte, the photoanode was placed on top of the counter-electrode and was then tightly clipped to form a cell. The electrolyte was composed of 0.6 M butylmethylimidazolim (BMII), 0.1 M LiI, 0.5 M 4-tert-butylpyridine, 0.03 M I2, and 0.5 M guanidinium thiocyanate (GuSCN) dissolved in acetonitrile. The photovoltaic characterizations of the solar cells with a mask (0.5 × 0.5 cm2) were carried out using a 150 W Peccell solar simulator (PEC-L11). Light intensity attenuated by a neutral density filter (Optosigma, 078–0360) at the measuring (cell) position was calibrated to be 100 mW cm−2 according to the reading from a radiant power meter (Oriel, 70260) connected by means of a thermopile probe (Oriel, 70263). Photoelectrochemical measurements (photocurrent density–voltage curves) of the DSCs were recorded using a potentiostat/galvanostat (PGSTAT 30, Autolab, Eco-Chemie, The Netherlands).
1) containing 2 × 10⁻⁴ M dye sensitizers. A platinized FTO was used as a counter-electrode and had an active area of 0.16 cm2, produced by adhering a polyester tape with a thickness of 60 μm. The dye-sensitized photoanode was rinsed with acetonitrile and air-dried. After filling the spacer with electrolyte, the photoanode was placed on top of the counter-electrode and was then tightly clipped to form a cell. The electrolyte was composed of 0.6 M butylmethylimidazolim (BMII), 0.1 M LiI, 0.5 M 4-tert-butylpyridine, 0.03 M I2, and 0.5 M guanidinium thiocyanate (GuSCN) dissolved in acetonitrile. The photovoltaic characterizations of the solar cells with a mask (0.5 × 0.5 cm2) were carried out using a 150 W Peccell solar simulator (PEC-L11). Light intensity attenuated by a neutral density filter (Optosigma, 078–0360) at the measuring (cell) position was calibrated to be 100 mW cm−2 according to the reading from a radiant power meter (Oriel, 70260) connected by means of a thermopile probe (Oriel, 70263). Photoelectrochemical measurements (photocurrent density–voltage curves) of the DSCs were recorded using a potentiostat/galvanostat (PGSTAT 30, Autolab, Eco-Chemie, The Netherlands).
