Design of passive mixers utilizing microfluidic self-circulation in the mixing chamber
Yung-Chiang
Chung
a,
Yuh-Lih
Hsu
b,
Chun-Ping
Jen
c,
Ming-Chang
Lu
d and
Yu-Cheng
Lin
*c
aElectronics Research & Service Organization, Industrial Technology Research Institute, Chutung, Hsinchu, Taiwan, R.O.C.
bDepartment of Life Science, National Tsing Hua University, Hsinchu, Taiwan, R.O.C.
cDepartment of Engineering Science, National Cheng Kung University, Tainan, Taiwan, R.O.C.
dEnergy and Resources Laboratories, Industrial Technology Research Institute, Chutung, Hsinchu, Taiwan, R.O.C.
First published on 4th December 2003
Abstract
This paper proposes the design of a passive micromixer that utilizes the self-circulation of the fluid in the mixing chamber for applications in the Micro Total Analysis Systems (μTAS). The micromixer with a total volume of about 20 µL and consisting of an inlet port, a circular mixing chamber and an outlet port was designed. The device was actuated by a pneumatic pump to induce self-circulation of the fluid. The self-circulation phenomenon in the micromixer was predicted by the computational simulation of the microfluidic dynamics. Flow visualization with fluorescence tracer was used to verify the numerical simulations and indicated that the simulated and the experimental results were in good agreement. Besides, an index for quantifying the mixing performance was employed to compare different situations and to demonstrate the advantages of the self-circulation mixer. The mixing efficiencies in the mixer under different Reynolds numbers (Re) were evaluated numerically. The numerical results revealed that the mixing efficiency of the mixer with self-circulation was 1.7 to 2 times higher than that of the straight channel without a mixing chamber at Re = 150. When Re was as low as 50, the mixing efficiency of the mixer with self-circulation in the mixing chamber was improved approximately 30% higher than that in the straight channel. The results indicated that the self-circulation in the mixer could enhance the mixing even at low Re. The features of simple mixing method and fabrication process make this micromixer ideally suitable for μTAS applications.
1 Introduction
The Micro Total Analysis Systems (μTAS) research, which is aimed at miniaturization and integration of biochemical analysis, has recently made explosive progress.1,2 However, there is still considerable technical challenge in integrating these procedures into a multi-stage system.3 The microfluid management devices, such as micropumps, microvalves, microsensors and micromixers, have been rapidly developed over the past few years.4 Rapid and effective mixing is essential for biochemical analysis. μTAS can reduce the analyzing time by rapid mixing and improve procedure control. Numerous microfluidic devices designed to improve mixing on the microscale have been reported in the literature. Mixing in these devices generally involves two steps: first, a heterogeneous mixture of substantially homogeneous domains of the two fluids is created by convection; second, diffusion between adjacent domains causes a homogeneous mixture at the molecular level.5 While examining the mixing efficiencies of various channel shapes for mini and micro channels, Branebjerg et al.6 noticed that sharp corners in the zigzag channel caused complete mixing due to turbulent flow in the case of mini channels while turbulence did not occur in the case of micro channels and the mixing was caused by diffusion only. However, the mixing procedures on the macroscopic scale, such as stirring or creation of turbulent flow cannot be scaled down to fit into the miniaturized systems (whose dimensions are so small to obtain Re over 2000, the critical value for turbulent flow). At the microscale, rapid mixing is not produced by turbulence due to the extremely weak inertial forces. Therefore, alternative mechanisms must be employed to improve mixing in microfluidic systems.The micromixers are classified into two categories: active and passive mixers. Active mixers employ external forces or forms of active control on the flow field by moving parts or varying gradients.7–10 Conversely, passive mixers5,11–17 exert no energy input except for the mechanism used to cause the microfluid flow at a constant rate. Liu et al.12 proposed a three-dimensional serpentine microchannel design with a C-shaped repeating unit as a means of implementing chaotic advection to enhance passive mixing. Their micromixer was fabricated in a silicon wafer using a double-sided KOH wet-etching technique. A plastic 3D L-shaped serpentine micromixer was subsequently developed to enhance the mixing of biological sample preparation.13 Three-dimensional polydimethylsiloxane (PDMS) microfabrication and plastic micromolding technique were employed to fabricate the L-shaped micromixers. Hong et al.14 designed an in-plane passive micromixer which employed the “Coanda effect” to improve mixing. T-type micromixers with constant and varying sizes of channels have been developed and their mixing performances have been studied.15 Stroock et al.16 proposed the staggered herringbone mixer to enhance mixing by chaotic advection. Jen et al.17 investigated a micromixer with twisted microchannels to enhance the mixing performance. Volpert et al.18 developed an active micromixer for improving the mixing of two fluids in a microchannel. The flow through the main channel of the micromixer was unsteadily perturbed by three sets of secondary flow channels, whereby enhancing the mixing. Lee et al.19 designed a micromixer, which employs unsteady pressure perturbations superimposed to a mean stream to enhance the mixing. The channels of the mixer were etched into silicon wafer using the deep reactive ion etching (DRIE) technique and anodically bonded to Pyrex plates. Although active mixers may effectively provide rapid mixing, the actuators used in these mixers need extra energy and are difficult to fabricate. Additionally, the electrical field and heat generated by the active control of these mixers may damage the biological samples. The operation and integration of active mixers onto a biochemical system are problems that need to be overcome. Passive mixers have the potential to be an attractive solution due to their simplicity and easy operation.
Most of the passive mixers are usually suitable for mixing two fluids in two channels, afterwards they will be mixed in the third channel. Consider that two or more fluids (or reagents) are injected into the same channel on a microfluidic chip simultaneously. The fluids are totally unmixed initially when they contact each other. In this case, it is difficult to highly improve the mixing performance if one uses these conventional passive mixers. In the present study, a novel passive mixer that utilizes microfluidic self-circulation in the mixing chamber is proposed to improve the mixing performance. The self-circulation of microfluid in the mixing chamber is achieved by the forward and backward pumping of the working fluids. The mixing performance of the passive micromixer at different Re was investigated by numerical simulations. The simulated results were verified by flow visualization using fluorescence tracer. This micromixer is suitable for μTAS since it does not require microfabricated electrodes or heaters and therefore has minimal effect on the biochemical process. It is, therefore, particularly suited to micro devices for biochemical analysis, such as polymerase chain reaction (PCR) and DNA hybridization.
2 Device design and experimental setup
The development of microfluidic self-circulation in the mixing chamber can be described in terms of Re, which is a measure of inertia to viscous effect. When the fluid flowing into the mixing chamber is starting to be separated into a main flow region (M) and a circulation region (S), as shown in Fig. 1a, the minimum Re is defined as the critical Re, Rec. The velocity of region M is higher than that of region S. In region S, the circulating velocity is higher than the central velocity, thus forming a free vortex that increases the contact area and improves the mixing.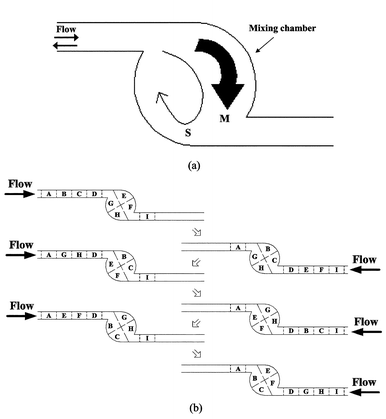 | ||
| Fig. 1 Schematic diagram of the two regions in the chamber: (a) main flow (M) and circulation (S); (b) the self-circulation process in the micromixer. | ||
The phenomenon of microfluidic self-circulation in the micromixer is illustrated in Fig. 1b. Fluid volume in the chamber and the channels is divided into nine parts, denoted by A–I. The fluid is injected into the channels and the mixing chamber. The flow is actuated back and forth by a pump. Initially, the fluid moves forth, parts E and F are shifted downstream and replaced by parts B and C. Parts G and H are stationary (or they become a circulation). Then, the fluid moves back, parts G and H are shifted upstream, and parts B and C are stationary. After that, the fluid moves forward again, parts B and C arrive at the right channel, and parts E and F are stationary. Finally, the fluid moves back again, parts E and F arrive at the left channel, and parts G and H are stationary. Based on these steps, the fluid can be transported from one channel to the other. It is worth noticing that the two pump cycles can perform one fluid-transporting cycle. If the volumes of parts A and I could be made to approach zero by a servo system, there would always be no fluid volume in one of the channels and the fluid in the chamber and channels could be alternately transported to any channel. This design can be integrated with a bi-directional pumping device.20,21
Based on the above concept, two micromixers (M1 and M2) were designed as shown in Fig. 2. The mixer M1 (Fig. 2a) had a chamber of diameter 4 mm and channels that are symmetrical about the central point with a width of 500 µm. The mixer M2 was identical to M1 except that there was a circular pillar of diameter 1 mm in the center of the chamber, as depicted in Fig. 2b. The directions of flows in both cases are also indicated in Fig. 2.
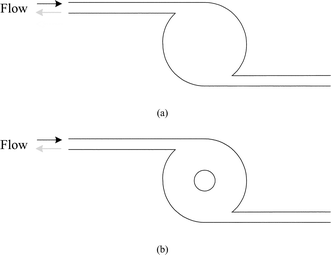 | ||
| Fig. 2 Schematic diagram of the two types of mixers. (a) M1: mixer with a circular chamber; (b) M2: mixer with an annular chamber. | ||
The device was constructed with two PMMA (poly-methyl methacrylate) layers. The upper PMMA layer was blank. The structures of the components were built on the lower PMMA layer using a CNC high-speed engraving and milling machine. The device consisted of a mixing chamber (4 mm in diameter and 500 µm in depth) and two channels (500 × 500 µm in cross-section), and the total volume was about 20 µL. After bonding the two PMMA layers and drilling two 1.5 mm diameter holes to form liquid inlets and outlets, a complete PMMA block 50 mm long, 50 mm wide and 15 mm high was fabricated. The flow pattern in the micromixer was traced by injecting a solution of yellow-green polystyrene fluorescent particles (15 µm diameter) through an inlet port. The flow field was visualized by a LEICA-MZFLIII fluorescence stereomicroscope (McBain Instruments, Chatsworth, CA, USA). The bi-directional motion of the fluid was generated by the push/pull action of a syringe injector. The switching time, which was defined as the time period of a complete cycle of one push and pull action, was determined based on the length of the channel and the longitudinal velocity of the fluid. The switching time was 2 s in experiments.
3 Numerical simulation
The Navier–Stokes equations and the continuity equation,22 which are given below, can be solved numerically to predict the flow field within an arbitrary device. | (1) |
 | (2) |
Fluid dynamic simulations based on Finite Volume Method and three-dimensional structured grids as implemented in the CFD-ACE™ software (CFD Research Corporation, Alabama, USA) were employed to predict the flow fields under typical operating conditions. The Algebraic MultiGrid (AMG) solver was used for velocity and pressure correction, and Conjugates Gradient Squared (CGS) and Preconditioning (Pre) solver were used for species. The inlet fluid velocity was kept constant, so that the flow field at some moment was considered as in quasi-steady state. The boundary conditions at the outlet were set at a fixed-pressure. The total number of cells in the mixer case and straight channel case were approximately 17![[thin space (1/6-em)]](https://www.rsc.org/images/entities/char_2009.gif) 000 and 9000, respectively. The details of the numerical method were: the maximum iteration was 250, the convergence critical was 10−5 and minimum residual was 10−15. In the initial state, the fluid in the inlet channel and left-half mixing chamber was ethanol and in the other parts water. The Re values, which are the ratios of the inertial forces to the viscous forces, were in the range of 5 to 400, which are less than 2000 (the limit for turbulent flow). Therefore the flows in these cases can be considered as laminar.
000 and 9000, respectively. The details of the numerical method were: the maximum iteration was 250, the convergence critical was 10−5 and minimum residual was 10−15. In the initial state, the fluid in the inlet channel and left-half mixing chamber was ethanol and in the other parts water. The Re values, which are the ratios of the inertial forces to the viscous forces, were in the range of 5 to 400, which are less than 2000 (the limit for turbulent flow). Therefore the flows in these cases can be considered as laminar.
To evaluate the mixing efficiency of the micromixer, quantification of percentage of mixing, which was modified from a previous work,23 was used as an index in the present study. Here, the mole fraction difference is considered as the fluidic mixing index, and the boundary conditions are assumed to be isolated. The mole fraction distribution in the mixer after each cycle was simulated. Initially, the mole fraction of ethanol at the entire inlet channel and half of the chamber were set at 1.0 and the remaining part of the mixer was full of water (the mole fraction of water was 1.0). As the time of the fluid moving back and forth periodically increases, the percentage of mixing increases and the mole fraction distribution in the mixer became more uniform. The percentage of mixing, ϕ, after each cycle was determined by the following equation:
 | (3) |
![[N with combining macron]](https://www.rsc.org/images/entities/i_char_004e_0304.gif) is the equilibrium mole fraction of ethanol (or water) in the mixer. Vi is the volume at the sampling points, n is the number of sampling points and the subscript o represented the initial state in the mixer.
is the equilibrium mole fraction of ethanol (or water) in the mixer. Vi is the volume at the sampling points, n is the number of sampling points and the subscript o represented the initial state in the mixer.
The fluids were forced to move back and forth periodically in the three-dimensional CFD simulations. In all cases, the flow was simulated to proceed forwards to the middle of the inlet channel at which it inverted its direction and then moved backwards. Therefore, the sampling points located between the middle of the inlet channel and the middle of the outlet channel were chosen to guarantee that the sampling points were always those that initially existed in the channel. The switching times for Re = 150 and 50 were calculated to be 0.166 and 0.5 s, respectively. A similar approach was applied when the sizes of the sampling cells were changed. The cross section of the channel was 500 × 500 µm as Re is larger than 50, and becomes 50 × 50 µm as Re gets smaller than 50. When the mixing performances (including the streamlines, velocity distribution and mixing percentage) of different channel (and chamber) sizes (50 × 50, 100 × 100 and 500 × 500 µm) of the devices but at the same Re (from 5 to 300) were compared, they were still similar (data not shown).
4 Results and discussion
The velocity and pressure distributions in the mixer M1 were calculated and the results are depicted in Figs 3 and 4. As the Re was gradually reduced from 300 to 50, the maximum velocity of the main flow region was shifted to the central zone as shown in Fig. 3. The self-circulation in the mixing chamber still existed, but the center of the circulation was shifted upstream, and the area of circulation region became smaller. Not only the area of the circulation region decreased, but the path of the main fluid also moved towards the central zone of the chamber. The area of circulation was nearly equal to one quarter of the chamber at Re = 50. At Re = 10, the circulation almost disappeared, and the flow was similar to the symmetrical creeping flow. The pressure drop from upstream to downstream was larger for higher Re as illustrated in Fig. 4. For Re = 300, the pressure drop after the mixing chamber was about 300 Pa. The pressure drop was 100, 20 and 4 Pa at Re = 150, 50 and 10, respectively. There were sharp pressure drops in the corners of the downstream channels, and this phenomenon was more obvious when Re was increased. Pressure drop in the main flow region was larger than that in the circulation region as Re > 50. The pressure contour for Re = 10 (Fig. 4d) indicated that the pressure distribution was almost symmetrical about the central point of the chamber.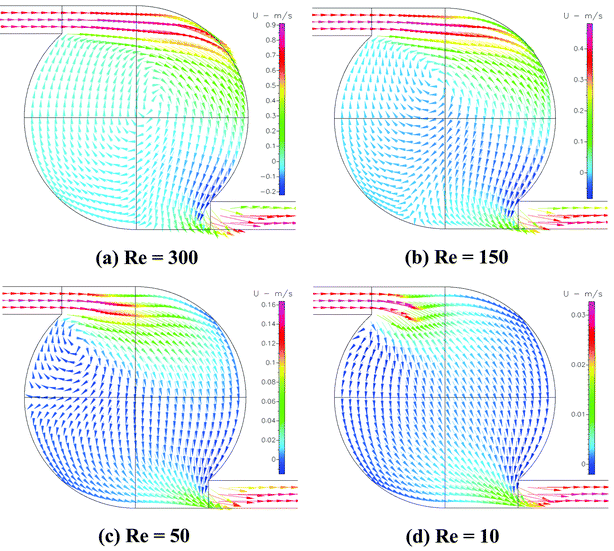 | ||
| Fig. 3 Calculated velocity field in the mixer with the circular chamber (M1) at Re equals (a) 300, (b) 150, (c) 50 and (d) 10. | ||
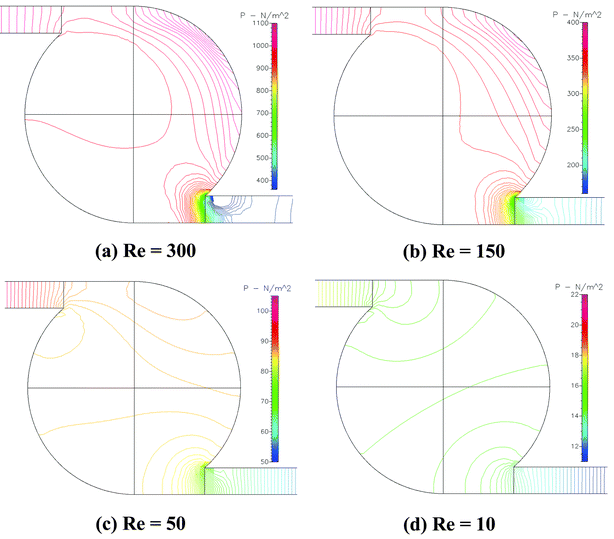 | ||
| Fig. 4 Calculated pressure distributions in the mixer with a circular chamber (M1) at Re equals (a) 300, (b) 150, (c) 50 and (d) 10. | ||
The velocity and pressure distributions in the mixer M2 for different Re are plotted in Figs 5 and 6. At Re = 300 (Fig. 5a), the flow phenomenon was similar to that of M1 at the same Re, except that the center of the vortex was slightly shifted and the circulation area was smaller. At Re = 150 (Fig. 5b) and 50 (Fig. 5c), the circulation regions were relatively smaller than those in the mixer M1 (Figs 3b and 3c). At Re = 10, the circulation region in the mixing chamber totally disappeared (Fig. 5d). The pressure distributions in the mixer M2 (Fig. 6) were similar to those in the mixer M1 at the same Re, except that the distributions near the pillar were different. Similar to the pressure contour in the mixer M1, the pressure distribution in the mixing chamber of the mixer M2 when Re = 10 was symmetrical about the central point of the chamber (Fig. 6d).
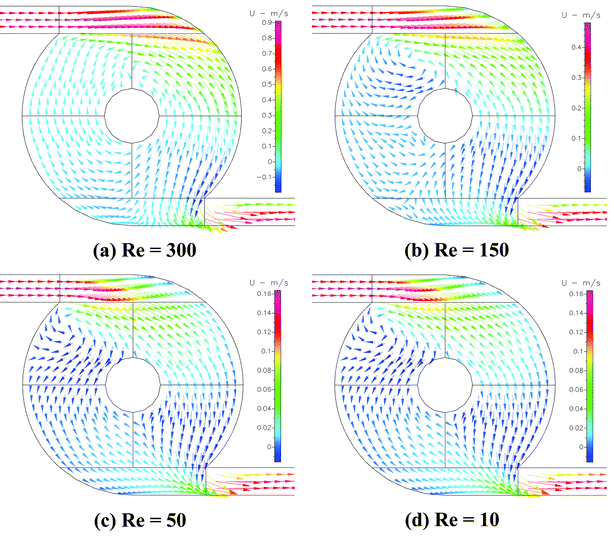 | ||
| Fig. 5 Calculated velocity field in the mixer with an annular chamber (M2) at Re equals (a) 300, (b) 150, (c) 50 and (d) 10. | ||
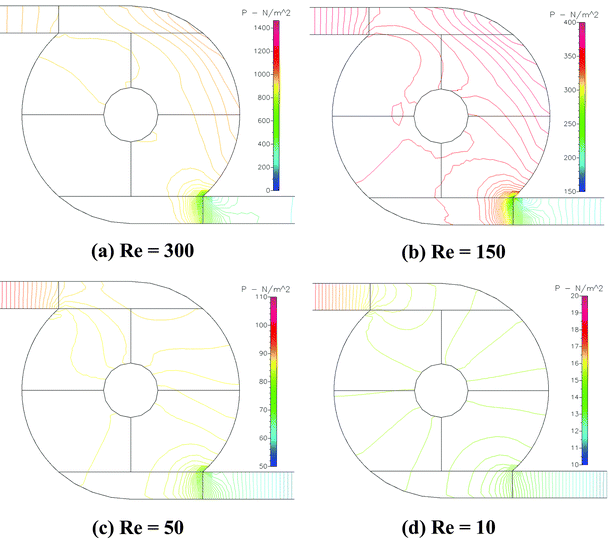 | ||
| Fig. 6 Calculated pressure distributions in the mixer with an annular chamber (M2) at Re equals (a) 300, (b) 150, (c) 50 and (d) 10. | ||
The tendency for the main flow region to completely occupy the mixing chamber could be easily understood from the ratio of the area of circulation region to the area of the chamber (Rc). The area of circulation region was calculated from the streamline and velocity distributions. The variation of Rc with Re was computed and is shown in Fig. 7. The ratio of the circulation area to the total mixing chamber, Rc, was equal to zero at Re = 20 for the mixer M1 and at Re = 40 for the mixer M2. However, the values of Rc for the mixer M1 and M2 increased asymptotically when Re was increased further. The asymptotic values of the mixer M1 and M2 were found to be 0.7 and 0.6 respectively. From Fig. 7, the Re corresponding to the same Rc values in the mixer M1 were always found to be smaller than those in the mixer M2. Therefore, the mixer M1 was more suitable for operating at Re varying from 20 to 400 than the mixer M2. Further studies were conducted by using this (M1) mixer design.
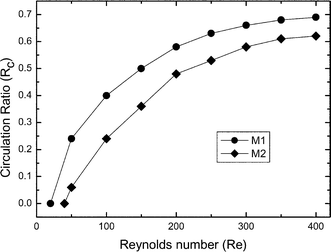 | ||
| Fig. 7 The ratios of circulation region in the mixing chambers of M1 and M2 at different Re. | ||
The streamlines of flow in M1 at different Re are shown in Fig. 8. The self-circulation area was the largest at Re = 300, and it gradually became small as the Re decreased. As mentioned above, the self-circulation area totally disappeared at Re = 10. The flow pattern obtained from the fluorescence images are shown in Fig. 9. The particles in the channel followed a tangential path in the mixing chamber (Fig. 9a) in which the fluid was moving forward and the Re was equal to 150. Nevertheless, the particles in the opposite side of the chamber were self-circulated or nearly stationary. The velocity field for the fluid moving backward (Fig. 9b) at Re = 50 was of less magnitude than that in Fig. 9a. As a result, the circulation zone became smaller, and the moving path of the particles was less noticeable. A comparison between the simulated and experimental results (Figs 7 and 9) indicated that the experimental results were quite close to the simulated results. However, the circulation region in the experiments was larger than that predicted by the simulated results. The deviations in the numerical results could be due to the non-incorporation of the surface roughness factor in the numerical simulation. The fabrication error might be another possible reason that caused the differences between the numerical and experimental results. These situations will influence the accuracy of the predicted results. The larger circulation area could result in an improved self-circulation leading to a better mixing performance. The experimental results demonstrated the occurrence of the self-circulation in the mixing chamber.
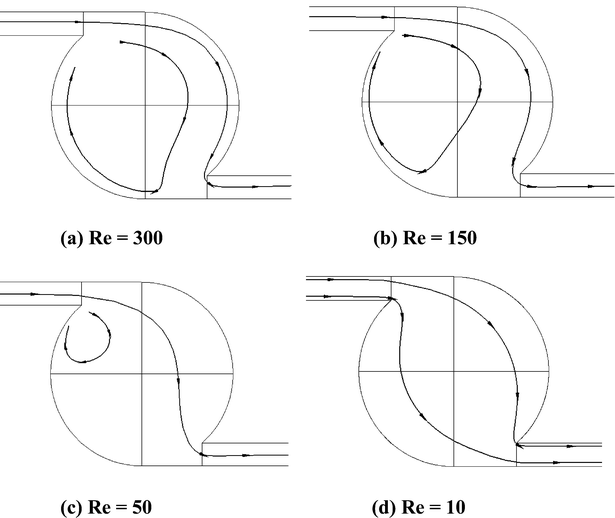 | ||
| Fig. 8 Streamlines of flow in M1 at Re equals (a) 300, (b) 150, (c) 50 and (d) 10. | ||
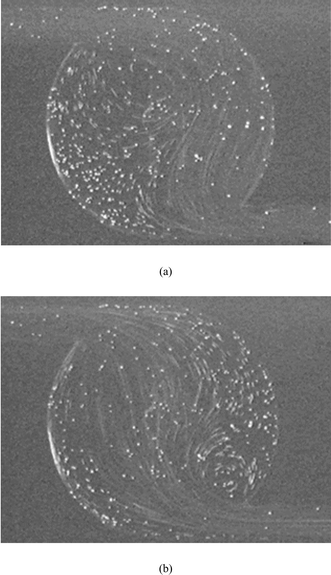 | ||
| Fig. 9 Fluorescence stereomicroscopic image of the self-circulation mixer: (a) fluid moving from left to right at Re = 150; (b) fluid moving from right to left at Re = 50. | ||
The performance of the mixer with the self-circulation was evaluated using the percentage of mixing calculated according to eqn. (3). If the boundary conditions were isolated, the average mole fraction at any time would be the same. In the present case, the average difference was smaller than 0.1%, which corresponded to the isolation assumption. The percentage of mixing in the mixer M1 and the straight channel without the mixing chamber at different Re were calculated and compared as shown in Fig. 10. Fig. 10a indicated the numerical results of the fluid moving back and forth in the mixer M1 and the straight channel with a width of 500 µm (Re = 150). The results showed that the percentage of mixing increased as the number of cycles (forward and backward) increased in M1 and in the straight channel. However, the mixer M1 exhibited better mixing performance and the percentages of mixing were about 1.7 to 2 times larger compared to those in the straight channel. When the fluids were stationary in the mixer M1, the fluids could hardly mix even after the same time corresponding to eight cycles. The mixer with self-circulation in the mixing chamber did improve the mixing of the fluids. As Re was decreased to 50, the variation of the percentage of mixing in the mixer M1 and the straight channel with the number of cycles is as depicted in Fig. 10b. The fluids in the mixer M1 still showed a better mixing than that in the straight channel. The percentages of mixing in the mixer M1 at different cycles were approximately 1.3 times higher than those in the straight channel. When the size of the mixers was scaled down, for example, the width of the inlet channel became 50 µm, which is one-tenth of the aforementioned mixer, the calculated percentage of mixing in the mixer M1 and the straight channel at Re = 5 after different cycles were as plotted in Fig. 10c. The percentages of mixing in the mixer M1 at different cycles were only about 1.1 times larger than those in the straight channel. When the fluids were stationary in the mixer M1, mixing occurred due to the smaller size and the effect of diffusion became more obvious. These results revealed that the mixing chamber design in the mixer M1 could slightly enhance the mixing at low Re. It was possibly due to the sudden increase in the contact area of the fluid when the fluid flowed from the channel into the chamber.
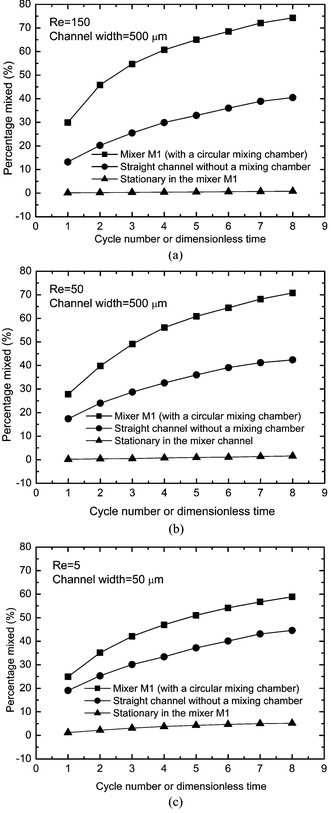 | ||
| Fig. 10 The calculated mixing percentages in the mixer with the circular mixing chamber (M1) and in the straight channel without the mixing chamber for different numbers of cycles or dimensionless time (time/period time in the flowing case, for the stationary cases compared to the flowing cases at the same time) at (a) Re = 150; (b) Re = 50 and (c) Re = 5. | ||
5 Conclusion
We have outlined the design of a micromixer utilizing the self-circulation approach, and verified its principle of operation using numerical modeling. The mixer demonstrated the ability to mix fluid utilizing self-circulation within the device of the mixing chamber. When the Re was higher than a critical value, Rec (Rec = 20 by simulation), the fluid would be separated into two regions: main flow region and circulation region. Two pumping cycles performed one fluid-transporting cycle in the device, and the fluid in the chamber and channels could be alternately transported to any channel. Two types of mixers, one having a hollow mixing chamber and the other having a pillar in the center of the mixing chamber, were investigated and compared. The simulation results demonstrated that the one with a hollow mixing chamber exhibited better mixing performance, especially at Re ranged from 20 to 400. The experimental results agreed with the simulation results. However, the circulation region in the experiments was larger than that predicted by the simulation results presumably due to the wall roughness and the fabrication errors. The proposed novel design of passive mixers can be applied in the field of μTAS.References
- A. Manz, N. Graber and H. M. Widmer, Miniaturized total chemical analysis systems: a novel concept for chemical sensing, Sens. Actuators, B, 1990, 1, 244–248 CrossRef.
- Y. Baba, S. Shoji and A. van den Berg (Eds.), Micro Total Analysis Systems 2002: Proceedings of the μTAS 2001 Symposium held in Nara, Japan, November 2002, Kluwer Academic Publishers.
- M. A. Burns, B. N. Johnson, S. N. Brahmasandra, K. Handique, J. R. Webster, M. Krishnan, T. S. Sammarco and P. D. T. Burke, An integrated nanoliter DNA-analysis device, Science, 1998, 1, 484–487 CrossRef CAS.
- S. Shoji and M. Esashi, Micro flow devices and systems, J. Micromech. Microeng., 1994, 4, 157–171 CrossRef CAS.
- J. Branebjerg, P. Gravesen, J. P. Krog and C. R. Nielsen, Fast mixing by lamination, in Proceedings of the IEEE Micro Electro Mechanical Systems, San Diego, USA, February 1996, pp. 441–446 Search PubMed.
- J. Branebjerg, B. Fabius and P. Gravesen, Application of Miniature Analyzers: from Microfluidic Components to μTAS, in Proceedings of Micro Total Analysis Systems Conference, Twente, Netherlands, November 1994, pp. 141–151 Search PubMed.
- J. Evans, D. Liepmann and A. P. Pisano, Planar laminar mixer, in Proceedings of the IEEE Micro Electro Mechanical Systems, Nagoya, Japan, January 1997, pp. 96–101 Search PubMed.
- R. M. Moroney, R. M. White, R. T. Howe, Ultrasonic induced microtransport, in Proceedings of the IEEE Micro Electro Mechanical Systems, Nara, Japan, January 1991, pp. 277–282 Search PubMed.
- S. Böhm, K. Greiner, S. Schlautmann, S. de Vries and A. van den Berg, A rapid vortex micromixer for studying high-speed chemical reactions, in Proceedings of the μTAS 2001 Symposium, California, USA, October 2001, pp. 25–27 Search PubMed.
- M. H. Oddy, J. G. Santiago and J. C. Mikkelsen, Electrokinetic instability micromixers, in Proceedings of the μTAS 2001 Symposium, California, USA, October 2001, pp. 34–36 Search PubMed.
- R. Miyake, T. S. J. Lammerink, M. Elwenspoek and J. H. J. Fluitman, Micro mixer with fast diffusion, in Proceedings of the IEEE Micro Electro Mechanical Systems, Fort Lauderdale, USA, February 1993, pp. 248–253 Search PubMed.
- R. H. Liu, M. A. Stremler, K. V. Sharp, M. G. Olsen, J. G. Santiago, R. J. Adrian, H. Aref and D. J. Beebe, Passive mixing in a three-dimensional Serpentine microchannel, J. MEMS, 2000, 9, 190–197 Search PubMed.
- R. H. Liu, M. Ward, J. Bonanno, D. Ganser, M. Athavale and P. Grodzinski, Plastic in-line chaotic micromixer for biological applications, in Proceedings of the μTAS 2001 Symposium, California, USA, October 2001, pp. 163–164 Search PubMed.
- C. C. Hong, J. W. Choi and C. H. Ahn, kA novel in-plane passive micromixer using Coanda effect, in Proceedings of the μTAS 2001 Symposium, California, USA, October 2001, 31–33 Search PubMed.
- D. Gobby and P. Angeli and A. Gavriilidis, Mixing characteristics of T-type microfluidic mixers, J. Micromech. Microeng., 2001, 11, 126–132 CrossRef.
- A. D. Stroock, S. K. W. Dertinger, A. Ajdari, I. Mezić, H. A. Stone and G. M. Whitesides, Chaotic mixer for microchannels, Science, 2002, 295, 647–651 CrossRef CAS.
- C. P. Jen, C. Y. Wu, Y. C. Lin and C. Y. Wu, Design and simulation of the gaseous micromixer with chaotic advection in twisted microchannels, Lab Chip, 2003, 3, 77–81 RSC.
- M. Volpert, C. D. Meinhart, I. Mezic and M. Dahelh, An actively controlled micromixer, in: Proceedings of MEMS ASME IMECE, Nashville, Tennessee, November 1999, 483–487.
- Y. K. Lee, J. Deval, P. Tabeling and C. M. Ho, Chaotic mixing in electrokinetically and pressure driven micro flows, in Proceedings of the IEEE Micro Electro Mechanical Systems, Interlaken, Switzerland, January 2001, pp. 483–486.
- C. P. Jen and Y. C. Lin, Design and simulation of bi-directional microfluid driving systems, J. Micromech. Microeng., 2002, 17, 115–121 CrossRef.
- C. P. Jen, W. D. Wu, C. Y. Wu, Y. C. Lin, G. G. Wu and C. C. Chang, Improved design and experimental demonstration of the bi-directional microfluidic driving system, Sens. Actuators, B, 2003, 96, 701–708 CrossRef.
- R. B. Bird, W. E. Stewart and E. N. Lightfoot, Transport Phenomena, Wiley, New York, USA, 1960 Search PubMed.
- T. J. Johnson, D. Ross and L. E. Locascio, Rapid microfluidic mixing, Anal. Chem., 2002, 1, 45–51 CrossRef.
| This journal is © The Royal Society of Chemistry 2004 |
