A comparison between bridges and force-chains in photoelastic disk packing†
Ling
Zhang
a,
Shuxiao
Cai
a,
Zunpeng
Hu
a and
Jie
Zhang‡
*ab
aDepartment of Physics and Astronomy, Shanghai Jiao Tong University, Shanghai 200240, China
bInstitute of Natural Sciences, Shanghai Jiao Tong University, Shanghai 200240, China. E-mail: jiezhang2012@sjtu.edu.cn
First published on 23rd October 2013
Abstract
In a dense granular material, force-chains form naturally as a backbone to support an external load. Due to the limitation of experimental techniques, the determination of the force-chain network in 3D packing is rather difficult, requiring a precise measurement of contact forces between particles. For 3D packing under gravity, it has long been proposed that bridges form as load-bearing structures. Identification of a bridge is relatively easy, requiring only the geometric information of particles. Although both concepts have existed for years, their relationship remains elusive. In this study, we aim towards resolving such a connection by comparing bridges and force-chains in packing of photoelastic disks. No direct correspondence between bridges and force-chains is observed. In addition, when a bridge grows longer, its probability of being a force-chain or part of the force-chain network decreases exponentially. Nonetheless, both are consistent in distinguishing certain properties of packing of strong hysteresis. To test the load-bearing assumption of bridges, stresses of particles in/out of bridges are analysed and compared and only minor differences are found.
Introduction
Dense granular materials can exhibit large spatial fluctuations due to (1) the negligible role played by thermal fluctuations and (2) the existence of the self-organized force-chain network, where much of the external load is transmitted and supported through filament-like structures comprising a fraction of the total particles.1 The first observation of force-chains in experiments can perhaps be dated back to 1960s2 and in recent years, physicists have renewed their interest in this subject.3–6 Understanding the properties of the force-chain network plays a key role in understanding the granular physics, with wide applications in related fields, such as jamming,7–10 acoustic transmission,11,12 geophysics,12 soil mechanics,13 and impact dynamics.14Despite its great importance and relevance, the direct measurement of the force-chain network in an experiment is a great challenge,6 even for 2D systems.5,15 Therefore much of the research work for 3D packing focuses on the geometric structure of granular packing, which is a very interesting subject16 and can be directly measured using X-ray tomography, the MRI technique and index-matching 3D tomography. Since the geometrical structure and the force-chain network structure are two different aspects of a dense granular material, a great challenge is to build a connection between these two. Mehta and her coworkers proposed theoretically that bridge structures can form in granular packing and they conjectured that these mutually stable geometric structures are related to force-chains and force-chains may well be just long-lived linear bridges.17,18 In their definition, a bridge is a cluster of particles where mutual stability is supported by neighbouring grains and a bridge can be further categorized as a linear or a complex bridge according to its topology.19 Some proposed statistical features of bridges were observed in recent experiments in colloidal and granular packing.20–22 Despite the success, it is still not clear how bridges and force-chains are related due to the lack of the independent force-network information.
This study is aimed to resolve this issue in a 2D experiment using photo-elastic particles. In this study, we focus on a direct comparison between bridges and force-chains in two different kinds of granular packing under gravity where force-chain networks are different in the mean force-chain orientation. We find no clear evidence that there is a straightforward connection between bridges and force-chains. However, we find that the respective bridge structures in these two kinds of packing exhibit different orientation distributions, consistent with the force-chain networks. This suggests that there is an intrinsic connection between bridges and force-chains in these kinds of granular packing. In contrast to the general assumption that bridges are major load-bearing structures, we find no convincing evidence through the direct comparison of the stress distributions of particles in/out of bridges.
Experimental methods
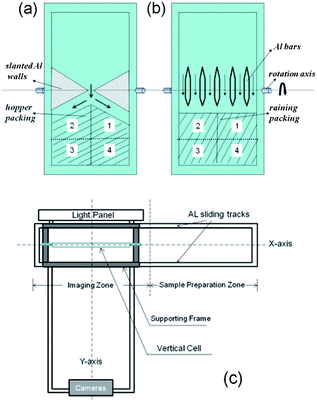
The experiment was performed using bi-disperse photoelastic disks in a 2D vertical cell, as shown in Fig. 1 (a and b). These disks were made of PSM-4 materials purchased from Vishay, with a diameter of 1.0 cm for small disks and a diameter of 1.2 cm for large ones in order to prevent crystallization and segregation. There were about 40% large disks in a total number of more than 6000 disks. The cell was constructed with a single disk layer sandwiched between two identical rectangular Plexiglass panels, coated to minimize the electrostatic charge accumulation. On the cell's side-walls, two aluminium rods were mounted to allow the cell to rotate freely on a support frame.The vertical cell is about 1.8 meter tall and 0.9 meter wide. About 30 cm behind the cell, there is a light panel, and about 1.8 meters away in front of the cell, there are four high resolution cameras, as drawn in the layout of the experimental set-up shown in Fig. 1(c). The layout of the set-up consists of two major regimes: on the left there is an imaging zone and on the right there is a sample preparation zone as viewed from the above. When a packing was imaged, the centres of the light panel, the vertical cell, and the cameras were aligned on the same axis, depicted as the Y-axis in Fig. 1(c). Each time, a new packing was produced in the sample preparation zone through the rotation of the cell so that the upper and bottom compartments of the cell could be switched. Two protocols were applied to generate two different types of disk packing, as illustrated in Fig. 1(a and b). In the 1st protocol, slanted aluminium walls were placed near the center of the cell to create a 2D hopper-like geometry, dividing the cell into two partitions; in the 2nd protocol, the hopper-like structure was replaced with an array of rhombus-shaped aluminium bars, forming six equal-spaced channels from wall to wall. Both protocols applied rotation: once the cell was rotated, the two partitions switched and particles started flowing down through the hopper-like outlet to the bottom to create a new packing. In the 1st protocol, the particles were first deposited at the center area of a growing granular heap and then redistributed through the dynamical avalanches, whereas in the 2nd protocol particles were raining down uniformly on a flat growing granular pile.
After a sample packing was prepared, the vertical cell was then slid back to the imaging zone along a horizontal track (made of 80/20 AL materials) with its axis, depicted as the X-axis in Fig. 1(c), perpendicular to the Y-axis. During this process, small disturbances would be produced and applied to the packing. One major disturbance came from the collision between the supporting frame of the cell and the bumper at the left end of the track, which was placed to ensure that the cell was aligned with centres of the light panel and the cameras. When the supporting frame of the cell hit the bumper, the sliding would then be stopped. Despite the disturbances generated during the sliding and especially during the collision, disk packing was observed to be stable.
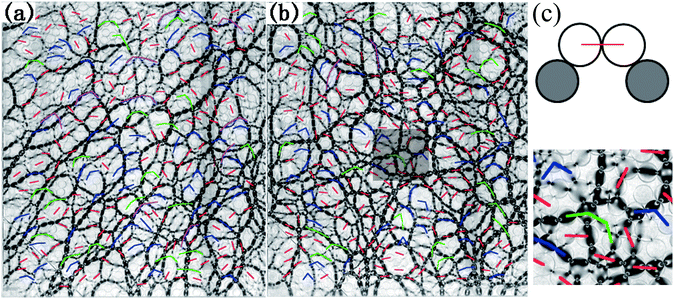
Applying the above two different protocols produces packing with different force networks. Sample force networks of each packing are shown as the background images in Fig. 2. Each packing is divided into four quadrants, monitored with the 2 × 2 array of digital cameras. Each image in Fig. 2 is from the 3rd quadrant, with the right edge near the center line of the respective packing. For each protocol, multiple runs, 511 of the 1st protocol and 495 of the 2nd protocol, were performed under the same controllable conditions to create an ensemble. One single run is a realization of the ensemble. The analysis in this paper has been focused on the 3rd quadrant of packing from these two different protocols, which allows the test of whether the analysis of the bridge structure can capture the difference of the force network structures.
Methods of analysis
We apply the method of bridge identification that is well documented in the literature,17,18,20,22 where two major criteria were used to select a single stabilizing subset for each bridge. One is the lowest center of mass (LCOM) criterion and the other is the lowest mean square separation (LSQS) criterion. In this paper, we only present the results from the LSQS criterion; results from LCOM are similar except that the average bridge length is shorter. Thus our conclusion in this paper is independent of the particular bridge identification criterion. The force-chain is identified based on three criteria similar to what have been described in ref. 23. First, we need to filter out particles carrying stresses smaller than the global average. Then among the remaining set of candidate particles, each carries a unique stress orientation and a threshold angle is introduced to quantify the alignment of these individual directions to identify force-chains. In order to differentiate connected parallel chains, a third threshold is also used. More detailed discussions will be presented elsewhere.Results and discussion
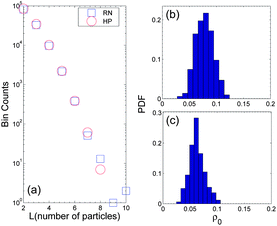
Fig. 2 shows the plot of the spatial distribution of bridges drawn right on top of the sample force-chain network images of two different kinds of packing. The force-chain network structures are qualitatively different in these two images: force-chains are more isotropically orientated in image (b) than in image (a), where image (a) (respectively, image (b)) was generated using the first (respectively, the second) protocol. In the following, for simplicity, we will call the packing produced using the first (respectively, the second) protocol the HP packing (respectively, the RN packing). In Fig. 2, different colors are used to paint bridges of different sizes with red lines for size L = 2, blue lines for size L = 3, green lines for size L = 4, and purple lines for sizes L ≥ 5. In Fig. 2(a and b), the base particles of each individual bridge, as drawn in Fig. 2(c), are not shown. Direct examination of these images suggests that there is no one-to-one mapping between an individual bridge and a force-chain in either the HP or the RN packing. But the bridge orientation in the HP packing shows a preferred direction compared to the RN packing, consistent with the force-chain network. Here we define the bridge orientation as the orientation of the line connecting the centres of two ending particles of a bridge. Thus bridge structures do capture essential characteristics of the force-chain network.In Fig. 2, one notices that as the bridge size increases its population decreases significantly. To describe this quantitatively, Fig. 3(a) shows the plot of the bridge size distribution for both the HP and the RN packing. We note that there are two main features: first, in either packing the bridge size distribution is nearly identical, independent of the preparation history of the packing; second, the distribution decays rapidly, close to an exponential form, consistent with the findings in the literature.17,18,20,21
To compare bridges and force-chains, in Fig. 3(b and c), we plot the PDF of the population fraction ρ0 of the actual number of bridges being force-chains or part of the force-chain network. Here we define a bridge being a force-chain or part of the force-chain network in a strict way that every particle on the bridge must belong to a force-chain. The values of ρ0 are computed over each individual runs. In both kinds of packing, the distribution has a narrow peak around a few percent, consistent with the observation in Fig 2. Fig. 3(b and c) suggest that there is a weak correspondence between a bridge and a force-chain, in contrast to what was proposed in the literature.17–19 This is quite surprising since bridges are believed to be a major force-bearing structure in granular packing. We understand this as follows. The definition of the bridge includes a mutual stability criterion between neighbouring particles of the same bridge,17–22 which is manifested on the shape of the bridge to curve down, forming an arch-like linear structure. Thus the orientation of a bridge aligns mainly along the horizontal direction on statistical average, whereas, in contrast, a force-chain can curve up or down. In an ideal situation with an infinite spatial resolution, the LSQS criterion of bridge identification is equivalent to finding an optimal bridge path with a maximum sum of contact forces between bridge particles, which is still a local constraint. In contrast, the definition of the force-chain includes a global constraint that a force-chain candidate particle shall have the maximum eigenvalue of its force–moment tensor larger than the global threshold, typically set as the global average.23,24 Thus the bridge definition allows particles in the weak force network to become a constituent particle of a bridge.
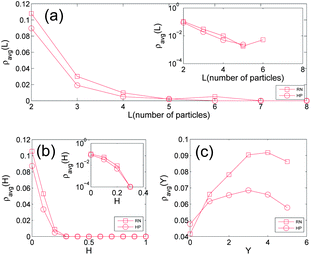
It is intuitive to conjecture that longer bridges may be in better agreement with force-chains. To our surprise, our results however show something quite opposite: as the bridge length increases, the agreement between bridges and force-chains gets worse and at a given bridge length L the average fraction of the number of bridges being force-chains or part of the force-chain network ρavg(L) decays rapidly in an exponential way as a function of the bridge size L, as can be seen in Fig. 4(a). Here ρavg(L) is computed over all runs for the HP and RN packing. The results seem to suggest that the probability of a bridge particle being a force-chain particle is approximately constant and is independent of other particles on the same bridge from the perspective of the mean-field approximation. This will naturally lead to the exponential decay seen in Fig. 4(a) following a random-walk-type argument. We also analysed the average fraction of bridges being the force-chain network ρavg(H) versus the aspect ratio of the bridge H. Here H is the ratio of the thickness of a bridge (with the exclusion of two base particles) versus its width as measured using a rectangular bounding box. Fig. 4(b) shows that ρavg(H) decays rapidly as H increases. As a last check, we analysed the average fraction ρavg(Y) of bridges being part of the force-chain network at different heights Y of the packing. ρavg(Y) does seem to increase from top to bottom, and this trend is more prominent for RN packing compared to the HP packing. This may indicate the vertical inhomogeneity of the collective motions of disks during the process of gravitational deposition, e.g. lower disks may have more time to stabilize. Presumably, the vertical inhomogeneity should be stronger in the RN packing compared to the HP packing because of the particular ways the two different types of packing are formed. These results are shown in Fig. 4(c).
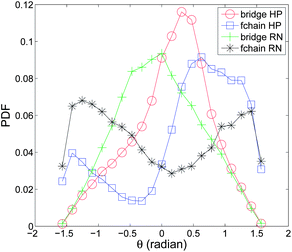
Fig. 5 shows the probability distributions of the orientation angles of bridges and force-chains in the HP and the RN packing. For simplicity, we label both orientation angles using the same symbol θ. From this figure, we see that there is a certain connection between bridges and force-chains in that both can consistently distinguish the HP and RN packing. In both kinds of packing, the distribution of the bridge orientation angle exhibits a single peak: in the RN packing, the distribution is nearly symmetric around the origin, whereas in the HP packing, the distribution is asymmetric with the peak shifted to an angle near 0.5 radians. In contrast, the distribution of the force-chain orientation exhibits double peaks in both kinds of packing. In the RN packing, the force-chain orientation is nearly symmetric, with double peaks centered near ±1.4 radians, indicating force-chains being aligned symmetrically along the vertical direction in order to support the particle weight. In the HP packing, the force-chain orientation is non-symmetric with a strong peak centered on 0.8 radians and a weak peak centered on −1.4 radians. We note that this asymmetry is due to two reasons: (1) the history of packing preparation using the first protocol which creates a left–right symmetry in the force network along the center line of the HP packing; (2) the breaking of this left–right symmetry through the selection of the 3rd quadrant of the packing. The shift of the peak of the bridge orientation distribution suggests that the bridge structure successfully captures the hysteresis of the granular packing, which is consistent with the force-chain network.
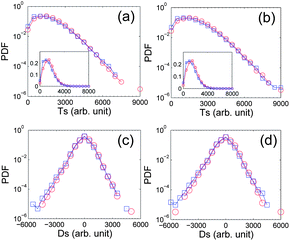
Fig. 6 shows the stress distribution of in-bridge and out-of-bridge particles in the HP and the RN packing. The top (respectively, bottom) figure shows the PDF of the trace, Ts (respectively, the deviator, Ds) of the force-moment tensor of in/out-of-bridge particles. The force–moment tensor of a particle is calculated by first computing the direct product of a vector contact force and the related position vector, pointing from the center of the particle to the position of the contact, for a given contact, and then summing every direct product for all contacts of the particle. More details can be found in ref. 10 and 25. We find that the distribution of Ts or Ds is nearly identical for two particle groups. A more careful examination of the results using a linear–linear plot shows a small difference in Ts, as displayed in the insets of Fig. 6(a and b), where the peak Ts shifts to a larger value for in-bridge particles compared to out-of-bridge particles. The results in Fig. 6(a and b) are not as prominent as in ref. 26, where simulations show a clear difference in Ts for in/out-of-bridge particles. The consistency between Fig. 6 and 3(b and c) suggests that the bridge is not the major load-bearing structure in a granular packing.
Conclusions
In summary, we study the bridge statistics in a 2D experiment using packing of photo-elastic disks, allowing us to measure bridges and force-chains at the same time and to make possible a detailed comparison between bridges and force-chains. We do not find a direct correspondence between bridges and force-chains, in contrast to what was proposed in the literature.17,18 For two kinds of prototype packing, the bridge orientation statistics successfully captures the differences of the force-chain network. However, no convincing evidence is discovered to support the assumption that bridges are the major load-bearing structures in these systems.Acknowledgements
J.Z. warmly thanks the hospitality of LANL, where the original experiment was performed. J.Z. acknowledges support from a startup fund of the Shanghai Jiao Tong University, the award of the Chinese 1000-Plan (C) fellowship, and Shanghai Pujiang Program (13PJ1405300). Discussions with Dr Bob Ecke and Dr Bob Behringer during the DFD 2012 meeting in San Diego are greatly appreciated. J.Z. thanks Yixin Cao and Yujie Wang for useful discussions.References
- H. M. Jaeger, S. R. Nagel and R. P. Behringer, Rev. Mod. Phys., 1996, 68, 1259–1273 CrossRef.
- P. Dantu, Geotechnique, 1968, 18, 50 CrossRef.
- C. h. Liu, S. R. Nagel, D. A. Schecter, S. N. Coppersmith, S. Majumdar, O. Narayan and T. A. Witten, Science, 1995, 269, 513–515 CAS.
- J. Geng, D. Howell, E. Longhi, R. P. Behringer, G. Reydellet, L. Vanel, E. Clément and S. Luding, Phys. Rev. Lett., 2001, 87, 035506 CrossRef CAS.
- T. S. Majmudar and R. P. Behringer, Nature, 2005, 435, 1079–1082 CrossRef CAS PubMed.
- J. Zhou, S. Long, Q. Wang and A. D. Dinsmore, Science, 2006, 312, 1631 CrossRef CAS PubMed.
- A. J. Liu and S. R. Nagel, Nature, 1998, 396, 21–22 CrossRef CAS PubMed.
- K. To, P.-Y. Lai and H. K. Pak, Phys. Rev. Lett., 2001, 86, 71–74 CrossRef CAS.
- M. van Hecke, J. Phys.: Condens. Matter, 2010, 22, 033101 CrossRef CAS PubMed.
- D. Bi, J. Zhang, B. Chakraborty and R. P. Behringer, Nature, 2011, 480, 355–358 CrossRef CAS PubMed.
- X. Jia, C. Caroli and B. Velicky, Phys. Rev. Lett., 1999, 82, 1863–1866 CrossRef CAS.
- P. A. Johnson and X. Jia, Nature, 2005, 437, 871–874 CrossRef CAS PubMed.
- J. Duran, Sands, Powders, and Grains: An Introduction to the Physics of Granular Materials (Partially Ordered Systems), Springer, 1999 Search PubMed.
- A. H. Clark, L. Kondic and R. P. Behringer, Phys. Rev. Lett., 2012, 109, 238302 CrossRef.
- K. W. Desmond, P. J. Young, D. Chen and E. R. Weeks, Soft Matter, 2013, 9, 3424–3436 RSC.
- S. Torquato and F. H. Stillinger, Rev. Mod. Phys., 2010, 82, 2633–2672 CrossRef.
- A. Mehta, Soft Matter, 2010, 6, 2875 RSC.
- A. Mehta, G. C. Barker and J.-M. Luck, Phys. Today, 2009, 62, 050000 CrossRef.
- A. Mehta, G. C. Barker and J. M. Luck, J. Stat. Mech.: Theory Exp., 2004, 2004, P10014 CrossRef.
- M. C. Jenkins, M. D. Haw, G. C. Barker, W. C. K. Poon and S. U. Egelhaaf, Phys. Rev. Lett., 2011, 107, 038302 CrossRef CAS.
- Y. Cao, B. Chakrabortty, G. C. Barker, A. Mehta and Y. Wang, Europhys. Lett., 2013, 102, 24004 CrossRef CAS.
- M. C. Jenkins, M. D. Haw, G. C. Barker, W. C. K. Poon and S. U. Egelhaaf, Soft Matter, 2011, 7, 684 RSC.
- J. F. Peters, M. Muthuswamy, J. Wibowo and A. Tordesillas, Phys. Rev. E: Stat. Phys., Plasmas, Fluids, Relat. Interdiscip. Top., 2005, 72, 041307 CrossRef CAS.
- F. Radjai, D. E. Wolf, M. Jean and J.-J. Moreau, Phys. Rev. Lett., 1998, 80, 61–64 CrossRef CAS.
- J. Zhang, T. Majmudar, A. Tordesillas and R. Behringer, Granular Matter, 2010, 12, 159–172 CrossRef CAS PubMed.
- C. Carlevaro and L. Pugnaloni, Eur. Phys. J. E: Soft Matter Biol. Phys., 2012, 35, 1–7 CrossRef PubMed.
Footnotes |
| † The original experiment was done at LANL. |
| ‡ Center for Nonlinear Studies, LANL, Los Alamos, NM 87545, USA. |
| This journal is © The Royal Society of Chemistry 2014 |

