Efficient iron–cobalt oxide bifunctional electrode catalysts in rechargeable high current density zinc–air batteries†
Wei Jian
Sim
 a,
Mai Thanh
Nguyen
 *a,
Zixuan
Huang
a,
Soorathep
Kheawhom
 b,
Chularat
Wattanakit
 c and
Tetsu
Yonezawa
 *a
*a
aDivision of Materials Science and Engineering, Faculty of Engineering, Hokkaido University, Kita 13 Nishi 8, Kita-ku, Sapporo, Hokkaido 060-8628, Japan. E-mail: tetsu@eng.hokudai.ac.jp; mai_nt@eng.hokudai.ac.jp
bDepartment of Chemical Engineering, Faculty of Engineering, Chulalongkorn University, Payathai Road Pathumwan, Bangkok 10330, Thailand
cVidyasirimedhi Institute of Science and Technology (VISTEC), Wangchan Valley 555 Moo 1 Payupnai, Wangchan, Rayong 21210, Thailand
First published on 4th April 2022
Abstract
Iron–cobalt (FeCo) oxides dispersed on reduced graphene oxide (rGO) were synthesized from nitrate precursors at loading levels from 10 wt% to 60 wt%. These catalysts were tested in lab-scale zinc–air batteries (ZABs) at a high current density of 100 mA cm−2 of the cathode area for the first time, cycling between 60 min of discharging and 60 min of charging. The optimum loading level for the best ZAB cycling performance was found to be 40 wt%, at which CoFe2O4 and CoO nanocrystals were detected. A discharge capacity of at least 90% was maintained for about 60 cycles with FeCo 40 wt%, demonstrating superior stability over amorphous FeCo oxides with FeCo 10 wt% despite similar performance at electrochemical tests. At a high current density of 100 mA cm−2, OER catalytic activity was found to be the limiting factor in ZAB's cyclability. The discrepancies between the ORR/OER catalytic activities by electrochemical and battery cycling test results highlight the role and importance of rGO in improving electrical conductivity and activation of metal oxide electrocatalysts under high current density conditions. The difference of battery cycling test results from traditional electrochemical test results suggests that electrochemical tests conducted at low current densities may be inadequate in predicting practical battery cycling performance.
1. Introduction
Secondary zinc–air batteries (ZABs) provide a cost-efficient and environmentally friendly solution for grid-scale energy storage.1 However, despite their high specific energy density, ZABs are limited by their low current density due to the slow kinetics of the oxygen reduction reaction (ORR)2 and high overpotentials of the oxygen evolution reaction (OER)3 during the discharging and charging processes, respectively. This is addressed commercially with the use of well-established noble metal catalysts such as Pt for the ORR4 and RuO2 for the OER.5 Their scarcity and high costs, however, limit their applications.Many d-transition metal oxides and hydroxides show promising electrocatalytic performances and offer possible substitutes for noble metal catalysts.6–9 These d-transition metal oxide catalysts can be formulated in bi-metallic compositions to take advantage of the unique electronic configuration of transition metals,10–14 resulting in catalytic performance superior to single metal catalysts.11 Charging and discharging cycling tests in these numerous studies, however, were mainly carried out at low current densities below 30 mA cm−2.12–15 Mentions of high current density usually made references to polarisation curves which provide an instantaneous snapshot of maximum power delivery.13–15 A non-exhaustive review of current densities and cycle times in discharging–charging cycling tests in recent works is summarised graphically in Fig. 1, clearly indicating a lack of attention towards high current densities.3,7,10–27 This work aims to study sustained battery performance at high current densities and shed light on the challenges faced in this new direction.
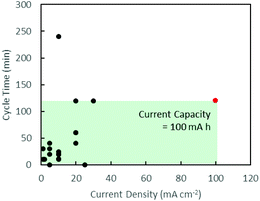 | ||
| Fig. 1 Graphical summary of battery test conditions in recent works. Black: existing literature.3,7,10–27 Red: this work. The area of the green box illustrates the current capacity of the battery tests carried out in this work. | ||
While transition metal oxides exhibit catalytic properties as mentioned previously, metal oxides inherently have poor electrical conductivity. As with metal nanoparticles, increasing the specific surface area by minimising particle sizes generally results in greater catalytic activity.28,29 Decreasing the size of particles to nanoscale allows otherwise insulated metal oxides to participate in electron accepting and donating reactions. Another way to increase catalysts’ accessibility to electrons is to deposit them on electrically conductive substrates such as graphene and its derivatives.10–14,30 Graphite can be chemically exfoliated to graphene oxide (GO) which, with the oxygen functional groups and structural defects,31 offers another tool in the dispersion of nanoparticles and the formation of thin films.32 While GO has poor electrical conductivity by itself, reduced graphene oxide (rGO) with the removal of oxygen functional groups from GO is electrically conductive.33–35 This offers the possibility of metal oxide precursor dispersion in GO and the synthesis of metal oxide catalysts embedded in rGO in one single thermal decomposition process.36 This takes advantage of both the dispersion effect of the oxygen functional groups of GO, and the resulting conveniently electrically conductive rGO as the final product.37,38
When employing multiple transition metals in metal oxides, their different valence states and electronic structures contribute to greater catalytic activity compared to single metal oxides.39 Fe and Co are common transition metals whose bimetallic oxides have proven to exhibit electrocatalytic activities.40–42 Wei et al.43 dispersed bimetallic oxides on GO using hexacyanometalate solutions which produces toxic cyanate gaseous by-products. Gong et al.44 dispersed Co–Fe oxides on synthesised graphene and Kone et al.45 grew in situ a mixture of a bimetallic CoFe alloy and CoFe2O4 on carbon nanotubes. Herein, rGO decorated Fe and Co oxides (FeCo-rGO) were synthesized from only relatively safer nitrate precursors and evaluated as bifunctional catalysts for air electrodes at a high current density (100 mA cm−2) of secondary ZABs for the first time. Furthermore, our 60 min discharge and 60 min charge for each cycle at this high current density subject the cells and catalysts to much more severe conditions compared to published works which are mostly at current densities below 30 mA cm−2 and cycle times of 15 min or less.12–15 It was found that among catalysts with 0–100 wt% loading levels of metals, the catalyst with 40 wt% metal loading enabled the most stable cycle performance of at least 90% discharge capacity. This came from the optimal dispersion and amount of CoFe2O4 and CoO nanocrystals on rGO for both high ORR and OER performances. The results reveal that carbon corrosion in the charging process (OER) is the limiting factor in high current density rechargeable ZABs.
2. Experimental
2.1 Chemicals and materials
Potassium hydroxide (KOH, >85.0%), cobalt(II) nitrate (Co(NO3)2·6H2O, >98.0%), graphite powder (special grade), and platinum on a carbon catalyst (Pt/C, 5 wt% Pt) were purchased from Wako. Iron(III) nitrate (Fe(NO3)3·9H2O, >99.0%), potassium permanganate (KMnO4, >99.3%), sodium nitrate (NaNO3, >99.0%), and aqueous hydrogen peroxide (H2O2aq, >35%) were purchased from Junsei, Japan. Zinc(II) chloride (ZnCl2, >98.0%) and hydrochloric acid (HClaq, 35–37%) were purchased from Kanto, Japan. Nafion solution (5%) was obtained from Sigma-Aldrich. All the above reagents were used as purchased without further purification. Pure water with a resistivity of 18.2 MΩ cm (Pure lab., Organo, Japan) was used. Zinc plate (>99%, thickness: 3 mm) test pieces of anodes for battery tests were obtained from Nilaco, Japan. Expanded polytetrafluoroethylene (ePTFE, SEF-010(HB)) was obtained from Chukoh Chemical Industries, Japan. Nickel foam, Celmet #8, was purchased from Sumitomo Electric Industries Ltd. Sigracet 22 BB from Sgl Carbon GmbH was used as a gas diffusion layer (GDL).2.2 Preparation of graphene oxide
GO was synthesized by Hummers’ method. 2.0 g of graphite powder was mixed with 1.0 g of NaNO3 and 100 mL of concentrated sulfuric acid for 30 min in an ice bath. 8.0 g of KMnO4 was added to the mixture and stirred for 3 h in an oil bath maintained at 35 °C. Subsequently, 200 mL of pure water was added, and the temperature of the oil bath was increased to 98 °C. After stirring for another 1 h, 400 mL of pure water was added. The mixture was allowed to cool to room temperature before 26 mL of 35% aqH2O2 was added. The resulting mixture was then washed with 5% hydrochloric acid and pure water until the pH of the solution was no longer acidic. The neutral mixture was finally centrifuged, and vacuum dried at 60 °C overnight to obtain dry GO.2.3 Preparation of FeCo-rGO catalysts
Catalysts were prepared by thermal decomposition of metal nitrates dispersed on GO. GO was dispersed in pure water by ultrasound sonification. Fe(NO3)3·9H2O and Co(NO3)2·6H2O in equal molar ratio were dissolved in water before being added to the GO dispersion. The weight percentages of Fe and Co were calculated based on the atomic masses of Fe and Co (eqn (1)). | (1) |
Samples with various FeCo loadings were prepared (Table 1). The mixture was vacuum dried at 60 °C before sintering at 350 °C for 4 h in a tube furnace under nitrogen gas flow at 100 mL min−1. Heating ramp was 5 °C min−1 from room temperature to 120 °C, and 0.5 °C min−1, from 120 to 200 °C, and 5 °C min−1 from 200 to 350 °C.
| No. | Description | FeCo wt% | Label |
|---|---|---|---|
| 1 | rGO | 0 | FeCo 0 wt% |
| 2 | GO with FeCo 10 wt% | 10 | FeCo 10 wt% |
| 3 | GO with FeCo 20 wt% | 20 | FeCo 20 wt% |
| 4 | GO with FeCo 40 wt% | 40 | FeCo 40 wt% |
| 5 | GO with FeCo 50 wt% | 50 | FeCo 50 wt% |
| 6 | GO with FeCo 60 wt% | 60 | FeCo 60 wt% |
| 7 | Fe(III)/Co(II) oxide | 100 | FeCo 100 wt% |
2.4 Characterisation
The resulting samples were analysed with an X-ray diffractometer (XRD, Rigaku Miniflex II X-ray diffractometer, Cu Kα radiation, λ = 1.5418 Å, scanning speed of 3° min−1). Analyses of the morphology, crystal structure, and composition of the samples were carried out using a transmission electron microscope (TEM, JEOL JEM-2000FX at 200 kV accelerating voltage) and a spherical aberration scanning TEM (STEM, JEM-ARM200F, 200 kV). Both the TEM and STEM are equipped with an energy dispersive X-ray spectroscope (EDS) for composition analysis. Selected area electron diffraction (SAED) patterns of the samples were collected using TEM with lattice spacing measurements corrected using an Au reference. Electrolytes were analysed with a UV-vis spectrometer (Shimadzu UV-1800) in the UV-vis region (200 to 800 nm). Fe and Co concentrations in electrolytes after cycling tests were measured with an inductive coupled plasma atomic emission spectrometer (ICP-AES, Shimadzu ICPE-9000). Images of the GDL after battery cycling tests were taken with an optical microscope (Keyence VHX-7000).2.5 Battery tests
In full-cell charge and discharge cycling tests, laboratory-scale ZABs were used (Fig. 2). Zn plates with 3 mm thickness were used as anodes. A catalyst ink for the cathode was prepared by dispersing 10 mg of each sample in 1 mL of 0.5% Nafion solution under sonification. 100 μL of 0.5% Nafion was first applied on a pressed nickel foam followed by 100 μL of the catalyst ink. The treated nickel foam was subsequently assembled into a cathode by pressing it together with a carbon-based GDL and ePTFE. The area of the cathode exposed to the electrolyte was 1 cm2. 6.0 M KOH with 0.2 M ZnCl2 was used as an aqueous electrolyte. Cycling tests were carried out at 100 mA cm−2 of the cathode with a battery tester from Neware (BTS4000 5 V Series). Cycling tests were started with 60 min of discharge before switching immediately to 60 min of charge and repeated until the cell no longer maintained a charge or discharge current density of 100 mA cm−2.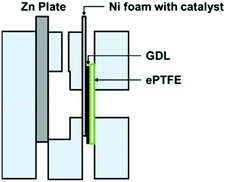 | ||
| Fig. 2 A laboratory-scale ZAB for battery test showing the assembly of an air cathode comprising nickel foam with a catalyst, a GDL and ePTFE. | ||
2.6 Electrochemical tests
Electrochemical tests were carried out with an electrochemical station, HZ-Pro S4 (Hokuto Denko, Japan). ORR cyclic voltammetry (CV) tests were carried out from 1.1 to 0.4 V vs. reversible hydrogen electrode (RHE) at a scan rate of 50 mV s−1. The CV baseline was measured in an argon-saturated electrolyte then CV measurements in an oxygen-saturated electrolyte were carried out. ORR linear scan voltammetry (LSV) tests were carried out in an oxygen-saturated electrolyte from 1.1 to 0.3 V vs. RHE. OER LSV tests were carried out from 1.0 V vs. RHE until the OER onset was detected. A pre-polished glassy carbon (GC) rotating disc electrode (RDE) with an area of 0.196 cm2 was used as the working electrode (WE). A Pt wire and an Hg/HgO electrode were used as a counter electrode (CE) and a reference electrode (RE), respectively. The electrolyte used for all electrochemical tests was 1.0 M KOH. A catalyst ink was prepared by dispersing 5 mg of catalyst samples in 1 mL of 0.5% Nafion solution. The ink was prepared by sonification for 30 min. 20 μL of the obtained catalyst ink was then drop-cast on the RDE and allowed to dry overnight.3. Results and discussion
3.1 Crystal structures and morphologies of the catalysts
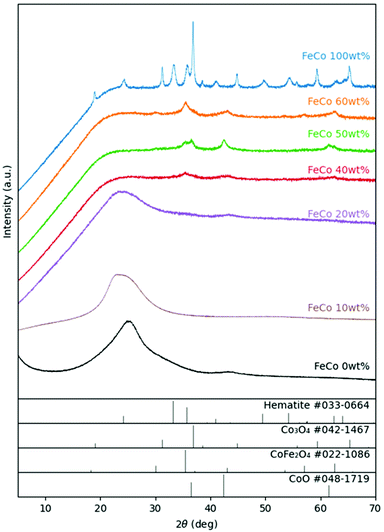
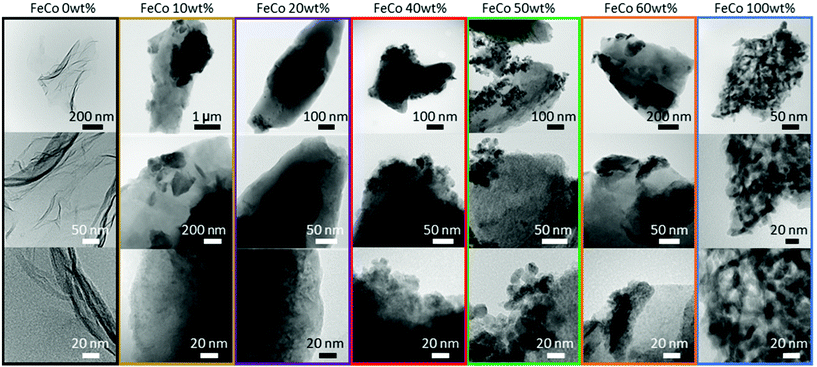
For the samples sintered in the presence of GO, XRD (Fig. 3) revealed the presence of spinel oxide crystalline structures belonging to cobalt ferrite (CoFe2O4) and a rocksalt crystalline structure, which is assigned to cobalt(II) oxide (CoO). However, in the absence of GO, nitrates decomposed yielding Fe2O3 (hematite) and cobalt(II,III) oxide (Co3O4). The presence of GO influenced the incorporation of Fe ions into spinel oxide crystals which would otherwise form rhombohedral hematite. The disappearance of the rGO (002) peak at approximately 24° in 2θ suggests further exfoliation of GO during the sintering process with the addition of nitrates up to an FeCo loading of 40 wt%. Gaseous decomposition products of nitrates intercalated between the GO layers could mechanically exfoliate GO during sintering,46 increasing the available surface area of GO for the nucleation of metal oxide particles. The increased contact between metal oxides and rGO improves the electrical access of metal oxides as electrocatalysts, which would otherwise be electrical insulators.TEM images of all samples are shown in Fig. 4. The TEM image of the FeCo 0 wt% sample confirmed the successful synthesis of rGO nanosheets. The nanoparticles of metal oxides could be seen in the samples of FeCo 10–100 wt%. However, the poor contrast and definition of the particles did not allow their sizes to be accurately quantified. From 40% loading, there are aggregations of FeCo oxides on rGO. Agglomeration of nanoparticles was observed in FeCo 100 wt%. Shades of lighter contrast in the agglomerates suggest the presence of voids or some degree of porosity in the agglomerates. Gaseous products during the sintering process could have contributed to this non-compact structure.
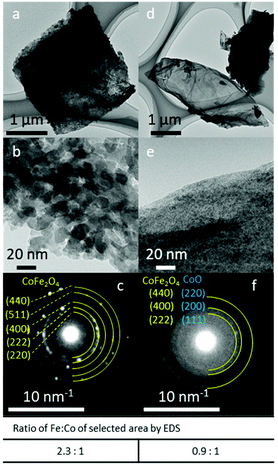
The SAED patterns of FeCo 40 wt% revealed the crystal structures of the particles (Fig. 5). Generally, two patterns of diffraction were observed. In areas where particles of 10–20 nm could be resolved (Fig. 5b), a spinel oxide structure of CoFe2O4 was observed in the SAED pattern (Fig. 5c). This is consistent with the XRD results and the average Fe![[thin space (1/6-em)]](https://www.rsc.org/images/entities/char_2009.gif) :
:![[thin space (1/6-em)]](https://www.rsc.org/images/entities/char_2009.gif) Co = 2.3
Co = 2.3![[thin space (1/6-em)]](https://www.rsc.org/images/entities/char_2009.gif) :
:![[thin space (1/6-em)]](https://www.rsc.org/images/entities/char_2009.gif) 1.0 (mol/mol) ratio measured by EDS for the particles in the area analysed with SAED. In areas where small (<5 nm) and no distinct particles could be resolved (Fig. 5e), diffuse rings in the SAED pattern (Fig. 5f) were observed, suggesting the presence of nanocrystals in random orientations. The measured lattice spacings (2.525, 2.083 and 1.494 Å) from the three diffused SAED rings can either be assigned to the (111), (200) and (220) planes of the rocksalt crystalline structure of CoO, respectively, or they can be assigned to the (222), (400) and (440) planes of spinel oxide, CoFe2O4. This is because these interplane distances in CoO and CoFe2O4 are similar and the difference in the lattice distances is under the precision limit of the d-spacings calculated from the diffraction patterns obtained with our TEM. Thus, the presence of CoO could not be confirmed with TEM-SAED analysis. EDS analysis of the areas where particles could not be resolved showed Fe and Co in an approximately equal ratio, suggesting the presence of both Fe and Co oxide. Thus, fine-structure analysis with STEM was conducted.
1.0 (mol/mol) ratio measured by EDS for the particles in the area analysed with SAED. In areas where small (<5 nm) and no distinct particles could be resolved (Fig. 5e), diffuse rings in the SAED pattern (Fig. 5f) were observed, suggesting the presence of nanocrystals in random orientations. The measured lattice spacings (2.525, 2.083 and 1.494 Å) from the three diffused SAED rings can either be assigned to the (111), (200) and (220) planes of the rocksalt crystalline structure of CoO, respectively, or they can be assigned to the (222), (400) and (440) planes of spinel oxide, CoFe2O4. This is because these interplane distances in CoO and CoFe2O4 are similar and the difference in the lattice distances is under the precision limit of the d-spacings calculated from the diffraction patterns obtained with our TEM. Thus, the presence of CoO could not be confirmed with TEM-SAED analysis. EDS analysis of the areas where particles could not be resolved showed Fe and Co in an approximately equal ratio, suggesting the presence of both Fe and Co oxide. Thus, fine-structure analysis with STEM was conducted.
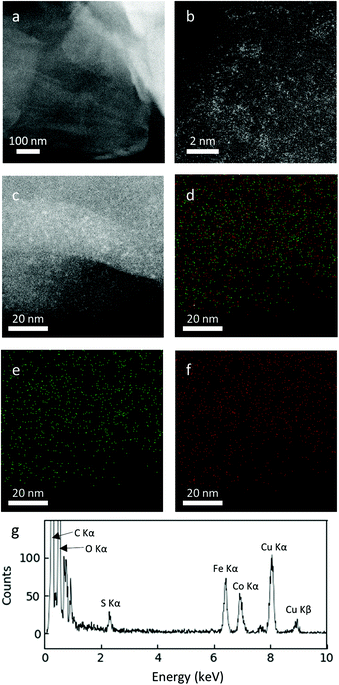
The fine crystal structures of the FeCo oxide nanoparticles embedded on rGO were further verified using atomic resolution STEM. At a low FeCo loading of 10 wt%, Fe and Co oxides existed as amorphous nanoclusters on the surface of rGO (Fig. 6). EDS elemental mapping revealed the uniform distribution of Fe and Co over the entire surface of the rGO particles in an approximately equal ratio. This amorphous nature of Fe and Co oxides agrees with the XRD results, in which no crystalline structure of Fe or Co was detected for this sample.
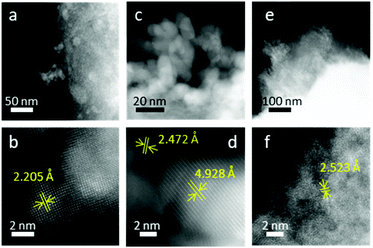
At FeCo 40 wt%, both well-defined particles (Fig. 7a–d) and areas without distinct particles (Fig. 7e and f) were observed. Particles with d-spacings attributed to CoO and CoFe2O4 could be identified. In Fig. 7b, the d-spacing of 2.205 Å can be attributed to the (200) plane of CoO. In Fig. 7d, the d-spacings of 2.472 Å and 4.928 Å can be attributed to the (111) plane of CoO and the (111) plane of CoFe2O4, respectively.
On the surface of rGO where no distinct particles were observed (Fig. 7e), the d-spacing of 2.523 Å can be attributed to the (311) plane of CoFe2O4 (Fig. 7f). EDS analysis revealed that the particles showing a CoO rock salt lattice structure (Fig. 7b) were composed of mostly Co, while areas with a spinel oxide crystal structure tend to have Fe and Co in equal ratios. Particles rich in Fe were not detected. In stoichiometric cobalt ferrite, CoO and Fe2O3 exist in equimolar ratio. The presence of only CoO particles but not Fe-rich particles indicated that CoO was indeed in excess for the formation of CoFe2O4. EDS analysis confirmed the non-stoichiometric ratio of Fe and Co in the spinel oxide crystallites, which is reasonable considering deviations in stoichiometry have been reported for cobalt ferrite47 and other spinel oxides.48–50
The absence of a well-defined crystal structure in low FeCo loadings is evidence of the influence of oxygen functional groups on the nucleation of metal nitrates during the drying of the precursors and subsequently the formation of the respective amorphous metal oxides. It is likely the polar oxygen functional groups disrupted the formation of large crystalline structures by providing a large number of nucleation sites on the surface of rGO. At higher FeCo loading levels, however, the surface of rGO approached saturation with metal oxides and well-defined crystallites formed on the existing layer of metal oxides, or at the fringes of the rGO particles. On the samples synthesized with graphite at an FeCo loading of 40 wt% (Fig. S1†), the areas of light contrast on the basal surface of graphite were commonly observed whereas such areas were not found on FeCo 40 wt%. This observation confirmed the role and necessity of oxygen functional groups present in GO in the nucleation and dispersion of FeCo oxides. Without oxygen functional groups, metal oxides have been found to preferentially nucleate on the edge planes rather than on the basal planes of graphite.51
3.2 Battery performance
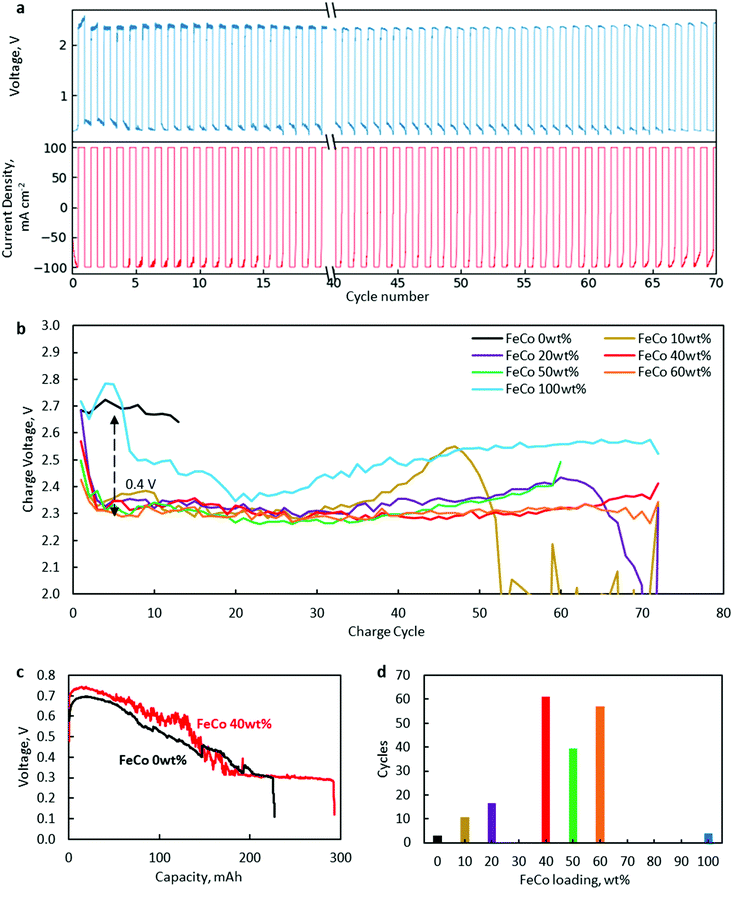
Battery cycling tests at 100 mA cm−2 revealed a significant increase in the lifetime of FeCo 10–60 wt% compared to the control samples of only rGO and FeCo 100 wt% (without rGO).The results are presented in Fig. 8. A typical charge/discharge profile of a ZAB using FeCo 40 wt% is shown in Fig. 8a while those of other samples are provided in Fig. S2–S7.† The charge potential of every charging cycle of all samples up to cycle 70 or till the battery broke down, whichever was earlier, is shown in Fig. 8b. From the discharge profile of a cell with FeCo 40 wt% in Fig. 8c, the discharge voltage could be maintained close to the initial value of 0.6 V for a discharge capacity of 100 mA h before gradually decreasing to 0.3 V. Thus, a discharge time of 60 min was chosen. The numbers of cycles with a discharge capacity of at least 90% of each sample at 100 mA cm−2 are shown in Fig. 8d. Similar evaluations for minimum discharge capacities of 95% and 85% were carried out (Fig. S8†). The maximum average number of cycles was found to be 61 with FeCo 40 wt%. It is apparent that a significant improvement in the cycling performance was achieved with FeCo loading up to 40 wt%. FeCo loading beyond 40 wt% did not show significant improvement in the cycling performance. Furthermore, the control sample FeCo 100 wt% showed poor retention of discharge capacity in cycling tests which highlights the importance of rGO for catalyst activation.
Since both CoO and CoFe2O4 were present, there is a need to ascertain the contribution of each compound to the cycling performance. Efforts to synthesise only spinel oxide, CoFe2O4, such as using nitrate precursors in stoichiometric ratios, always resulted in the presence of CoO. Therefore, separate tests with only Co oxides dispersed on rGO were conducted to isolate the catalytic activity of CoO. With Co at 50 wt% loading, 90% discharge capacity was sustained for an average of only 7 cycles, which is inferior compared to FeCo 50 wt% with an average of 40 cycles. Similar tests carried out with only Fe oxides dispersed on rGO yielded an average of only 5 cycles. Hence, it is clear that the superior cyclability can be attributed to the catalytic activity of CoFe2O4.
Cycling performance was found to correlate closely with charging potential. The poor performance of FeCo 0 wt% and FeCo 100 wt% could be attributed to high charging potentials. FeCo 10 wt% was found to initially exhibit a similar charging potential to the samples with higher loading levels. However, the charging potential was found to increase gradually after around cycle 30, which could be explained due to the lower number of possible charge/discharge cycles. Compared to the control samples, all test samples showed excellent OER catalytic activity, decreasing charging potential from approximately 2.7 V to 2.3 V, an improvement of 0.4 V. Since a decrease in the charging potential was present even with an FeCo loading of 10 wt%, it is evident that the amorphous structure observed in FeCo 10 wt% contributed to the catalyst performance. The OER activity of the amorphous FeCo oxides can be attributed to the large number of defects on the surface of the amorphous structure of binary metal oxides.6 However, it is also clear from Fig. 8b that the stability of the catalysts under OER conditions is much better at FeCo loading levels between 40 and 60 wt%.
High charging potential limiting cycling performance suggests that carbon corrosion at the cathode is the main mechanism for battery failure. Electrolytes were retrieved from batteries with the FeCo 40 wt% catalyst after 3, 7, 11 and 23 cycles. UV-vis measurements showed increasing absorbance in the UV range (200–400 nm) with increasing the cycle number (Fig. S9†). Conjugated carbon double bonds like those found in polyenes are known to absorb UV. In the batteries, carbon compounds oxidised and physically detached from the GDL and dispersed in the electrolyte could contribute to this absorbance. Further evidence of carbon corrosion was physically confirmed with optical microscopy observation of the GDL after cycling tests (Fig. S10†). Degradation of the GDL led to breakdown of the hydrophobic porous structure, resulting in a smaller surface area for ORR/OER activity and the eventual flooding of the GDL by the electrolyte. Significant staining of the GDL with the electrolyte after 23 cycles confirmed the loss of hydrophobicity and suggested the movement of the three-phase interface, where the ORR/OER occurs, into the middle of the GDL, instead of at the surface.
Besides oxidation of the GDL during the OER, gaseous oxygen evolved during charging is also considered to be responsible for the mechanical degradation of the GDL and also dislodging the catalyst from the nickel foam. This phenomenon was clearly observed during OER electrochemical tests with a rotating electrode where the catalyst layer detached from the RDE under extended OER conditions. The catalyst may also dissolute into the electrolyte under OER conditions.52 The electrolyte was retrieved from cells with FeCo40 wt% after 10 and 20 cycles and analysed with ICP-AES. Co was detected at 0.08 mg L−1 and 0.44 mg L−1, respectively, while the Fe concentration was below the detection limit. The presence of Co was likely due to the dissolution of CoO and not CoFe2O4 as no significant Fe concentration was detected after 20 cycles. This result suggests two possibilities. First, CoFe2O4 was stable for at least 20 cycles under severe OER conditions. Second, since there was no significant decrease of charging potential after 20 cycles, CoO could be playing a minor role in OER catalytic activity relative to CoFe2O4.
3.3 Electrochemical tests
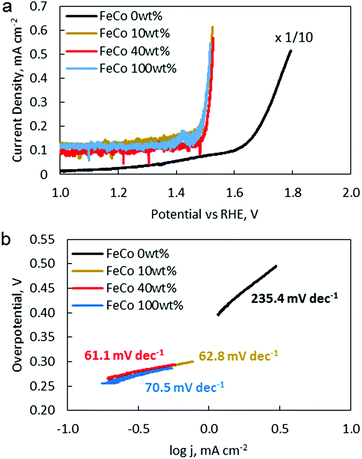
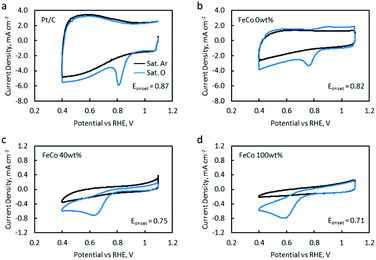
OER catalytic activity was verified by LSV (Fig. 9a). The OER onset potentials for FeCo 10 wt%, FeCo 40 wt% and FeCo 100 wt% were found to be approximately 1.50 V vs. RHE. This is a 0.14 V improvement from the onset potential of FeCo 0 wt% at 1.64 V vs. RHE. The difference in the improvements in the charging potential measured by cycling tests and voltammetry can be attributed to the difference in the test current density. Interestingly, all 3 samples performed similarly in OER LSV despite showing stark differences in the cycling performance. Tafel slopes are calculated from the linear fitting of the Tafel plots derived from the OER polarisation curves (Fig. 9b). The Tafel slope indicates the increase in overpotential necessary to raise the current density by a factor of 10. FeCo 40 wt% has a slightly better Tafel slope of 61.1 mV dec−1 compared to FeCo 100 wt% which has a Tafel slope of 70.5 mV dec−1. Just beyond the onset of the OER, FeCo 10 wt%, FeCo 40 wt% and FeCo 100 wt% exhibit similar OER kinetics. As a control, FeCo 0 wt% was found to have a Tafel slope of 235.4 mV dec−1. These results suggest that the OER catalytic activity of FeCo 100 wt% deviates from FeCo 40 wt% at high current densities, again highlighting the importance of catalyst activation and electrical conductivity in designing catalysts for high current densities. Also, the improvements in the cycling results are likely due to the high stability of the catalysts supported on rGO at 40 wt% loading and not due to a significant difference in the OER activities of the 3 tested catalysts.CV and LSV were carried out to characterise the ORR activity of the catalysts. The CV of Pt/C (5% Pt) is provided as a reference (Fig. 10a). The CV of FeCo 0 wt% (Fig. 10b) in saturated argon exhibited a large non-faradaic current, indicating a substantial increase in the electrochemical surface area and electrical conductivity with the application of rGO on the WE.53 In the saturated O2 electrolyte, a peak is present in both the cathodic and anodic scans. The cathodic peak current density can be attributed to the ORR. However, since a peak was also present in the anodic scan, the reversibility of this reaction suggests that not all O2 that was adsorbed underwent reduction, but some O2 would simply desorb from the catalyst surface in the anodic scan.
As FeCo oxides have a much higher density than rGO, an increase in FeCo loading disproportionately decreases the amount of rGO in a 20 μL catalyst ink drop-cast on the WE. This led to a significant decrease in the current in saturated argon, which can be seen in the CV of FeCo 40 wt% (Fig. 10c). The current in saturated argon measured at the peak current potential showed a decreasing trend with increasing FeCo loading (Table 2). The slight increase in the non-faradaic current density in FeCo 100 wt% (Fig. 10d) suggests some increase in the electrochemical surface area. From the TEM observations of FeCo 100 wt% (Fig. 4), the lighter shades could imply some extent of porosity or voids in the FeCo oxide particles. FeCo 40 wt%, which exhibited the best ZAB cycling test performance, had an ORR onset of 0.75 V vs. RHE. With the loading of FeCo oxide, the reversible anodic peak current due to oxygen desorption was no longer observed, indicating that the cathodic peak current in excess of the non-faradaic current in saturated argon can be attributed to the ORR. The CVs of FeCo 10 wt%, 20 wt%, 50 wt% and 60 wt% are provided in Fig. S11.†
| FeCo loading (wt%) | 0 | 10 | 20 | 40 | 50 | 60 | 100 | Pt/C |
|---|---|---|---|---|---|---|---|---|
| Peak current potential (V) | 0.76 | 0.64 | 0.61 | 0.63 | 0.59 | 0.59 | 0.59 | 0.81 |
| Total current density (mA cm−2) | 3.32 | 0.82 | 0.87 | 0.71 | 0.87 | 0.61 | 0.82 | 5.87 |
| Non-faradaic current density (mA cm−2) | 1.17 | 0.51 | 0.51 | 0.20 | 0.15 | 0.10 | 0.15 | 2.19 |
| ORR current density (mA cm−2) | 2.14 | 0.31 | 0.36 | 0.51 | 0.71 | 0.51 | 0.66 | 3.67 |
| Onset ORR potential (V) | 0.82 | 0.79 | 0.73 | 0.75 | 0.71 | 0.71 | 0.71 | 0.87 |
Quantitative results from the CVs of all samples are listed in Table 2. FeCo 100 wt% showed a lower ORR onset potential than the Pt/C reference catalyst. This was raised from 0.71 V to 0.75 V when FeCo loading was reduced from 100 wt% to 40 wt%. The dispersion of FeCo oxides on rGO provided greater accessibility to electrons, increasing the activation of otherwise poorly conductive FeCo oxides.
LSV was carried out with a RDE to characterise ORR catalytic activity. Polarisation curves were measured at RDE rotation speeds of 400, 900, 1225, 1600, 2025 and 2500 rpm (Fig. 11a and Fig. S12†). Linear and parallel Koutecký–Levich (K–L) plots were obtained at 0.45 and 0.50 V, implying that the currents at these potentials were indeed mass transport limited (Fig. 11b). The electron-transfer number as determined from K–L equation calculations (see details in the ESI†) are listed in Table 3.
| FeCo (wt%) | 0 | 10 | 20 | 40 | 50 | 60 | 100 | Pt/C |
|---|---|---|---|---|---|---|---|---|
| E = 0.50 V | 2.47 | 2.78 | 2.41 | 2.81 | 2.87 | 3.33 | 3.78 | 4.02 |
| E = 0.45 V | 2.44 | 2.99 | 2.70 | 2.80 | 3.14 | 3.52 | 3.81 | 3.63 |
The electron-transfer number increased from 2.4 to 3.8 with increasing FeCo loading from 0 wt% to 100 wt%. The increasing electron transfer number implied increasing catalytic activity for the 4-electron ORR and a value of 2.8 would suggest both 2-electron and 4-electron ORR pathways are occurring concurrently. Interestingly, the catalyst with the best battery cycling performance, FeCo 40 wt%, exhibited an electron transfer number of only 2.8, while FeCo 100 wt%, despite having an electron transfer number close to 4.0, exhibited poor battery cyclability. The discharge potentials of each sample in battery tests (Fig. S2–S7†) also did not correlate closely with the ORR electrochemical test results. The discharge potential of FeCo 100 wt% quickly degraded to similar values to FeCo 0 wt% within a few cycles. Similar to the analysis of the OER electrochemical test results, this suggests that electrochemical tests at low current densities may not accurately predict battery performance at high sustained current densities. These results also highlight the synergistic effect of the high electrical conductivity of rGO on the activation of FeCo oxides for high current density cycling performance. Despite having better ORR catalytic activity, the poor cyclability of FeCo 100 wt% is further evidence that carbon corrosion and OER catalytic activity are the main limiting factors in determining cycling performance of ZABs at a high current density of 100 mA cm−2.
4. Conclusions
FeCo oxides of various loading levels dispersed on rGO were synthesized from nitrate precursors by thermal decomposition. At FeCo 10 wt%, amorphous nanoclusters were observed on the surface of rGO. At higher loading levels, rGO induced the formation of CoFe2O4 spinel oxides which would otherwise exist as rhombohedral hematite and cobalt spinel oxides separately. As confirmed by electron microscopy and battery cycling tests at 100 mA cm−2, amorphous FeCo oxides clearly exhibited ORR and OER catalytic activities. The optimal FeCo loading level was found to be 40 wt% at which a thin layer of crystalline FeCo oxides on the electrically conductive substrate of rGO was formed. Cyclability was found to correlate inversely with charging potential, suggesting that carbon corrosion is the main limiting factor in cycling performance. Despite showing similar performances in electrochemical tests, FeCo 40 wt% showed superior cyclability over FeCo 10 wt%, highlighting a divergence of application test performance at high current densities from the electrochemical test performance which are usually conducted at low current densities. Electrochemical tests also confirmed the synergistic effect of dispersing FeCo oxides on an electrically conductive substrate such as rGO. This work also highlighted the importance of corrosion resistant cathode material and catalyst activation for metal–air batteries operating at high current densities.Author contributions
The manuscript was written through contributions of all authors. All authors have given approval to the final version of the manuscript.Conflicts of interest
There are no conflicts to declare.Acknowledgements
This work was partially supported by Hokkaido University. Financial support by Accelerating Social Implementation for SDG Achievement (B) (aXis) from the Japan Science and Technology Agency is gratefully acknowledged. TY thanks the partial financial support from the Grant-in-Aid for Scientific Research in Priority Area. The authors thank the experimental assistance of Mr Masayuki Takahashi (Hokkaido University). MTN thanks for partial financial support from the Young Research Acceleration Project of Hokkaido University, the Grant for Basic Science Research Projects from the Sumitomo foundation, and the Kurata Grant awarded by the Hitachi Global Foundation. SK thanks the Program Unit for Human Resources & Institutional Development, Research and Innovation, and Energy Storage Cluster, Chulalongkorn University. We thank Mr T. Tanioka and Ms. K. Yokohira (Hokkaido University) for their support in TEM observation. We thank Ms. N. Hirai (Hokkaido University) for observing our samples with STEM. We thank Mr H. Tsukamoto (Hokkaido University) for technical support and advice in setting up the battery system and the electrochemical measurement system. We thank Dr Y. Ishida and Dr N. C. Rosero-Navarro (Hokkaido University) for fruitful discussions. SK and CW thank the financial support from Hokkaido University for their stay for collaborations in Sapporo. WJS appreciates the financial support from the Mitsubishi UFJ Trust Scholarship Foundation for his stay in Sapporo.References
- S. Olaru, F. Stoican and S. Kheawhom, 2021 IEEE AFRICON, 2021, pp. 1–6.
- S. Suren and S. Kheawhom, J. Electrochem. Soc., 2016, 163, A846 CrossRef CAS.
- R. Li, Q. Li, L. Xiao, X. Bai, S. Ji, J. Zhang, M. An and P. Yang, Mater. Today Energy, 2021, 22, 100882 CrossRef CAS.
- S. Sui, X. Wang, X. Zhou, Y. Su, S. Riffat and C. Liu, J. Mater. Chem. A, 2017, 5, 1808–1825 RSC.
- C. Wang, L. Jin, H. Shang, H. Xu, Y. Shiraishi and Y. Du, Chin. Chem. Lett., 2021, 32, 2108–2116 CrossRef CAS.
- Z. Zhuang, S. A. Giles, G. R. Jenness, R. Abbasi, X. Chen, B. Wang, D. G. Vlachos and Y. Yan, J. Electrochem. Soc., 2021, 168, 034518 CrossRef CAS.
- N. Radenahmad, R. Khezri, A. A. Mohamad, M. T. Nguyen, T. Yonezawa, A. Somwangthanaroj and S. Kheawhom, J. Alloys Compd., 2021, 883, 160935 CrossRef CAS.
- M. Etesami, A. A. Mohamad, M. T. Nguyen, T. Yonezawa, R. Pornprasertsuk, A. Somwangthanaroj and S. Kheawhom, J. Alloys Compd., 2021, 889, 161738 CrossRef.
- T. Zhou, W. Xu, N. Zhang, Z. Du, C. Zhong, W. Yan, H. Ju, W. Chu, H. Jiang, C. Wu and Y. Xie, Adv. Mater., 2019, 31, 1807468 CrossRef PubMed.
- Y. Sato, S. Kitano, D. Kowalski, Y. Aoki, N. Fujiwara, T. Ioroi and H. Habazaki, J. Electrochem. Soc. Jpn., 2020, 88(6), 566 CAS.
- I. Kone, Z. Ahmad, A. Xie, L. Kong, Y. Tang, Y. Sun, Y. Chen, X. Yang and P. Wan, Energy Technol., 2021, 9(4), 2001117 CrossRef CAS.
- Y. Zhang, Z. Chen, J. Tian, M. Sun, D. Yuan and L. Zhang, J. Colloid Interface Sci., 2022, 608, 1105 CrossRef CAS PubMed.
- T. T. Gebremariam, F. Chen, Q. Wang, J. Wang, Y. Liu, X. Wang and A. Qaseem, ACS Appl. Energy Mater., 2018, 1, 1612–1625 CrossRef CAS.
- D. Deng, Y. Tian, H. Li, L. Xu, J. Qian, J. Pang, B. Wang, Q. Zhang and H. Li, J. Alloys Compd., 2019, 797, 1041–1049 CrossRef CAS.
- Y. Deng, Y. Jiang, R. Liang, S. Zhang, D. Luo, Y. Hu, X. Wang, J. Li, A. Yu and Z. Chen, Nat. Commun., 2020, 11, 1952 CrossRef CAS PubMed.
- Y. Sun, B. Huang, Y. Li, Y. Xing, M. Luo, N. Li, Z. Xia, Y. Qin, D. Su, L. Wang and S. Guo, Chem. Mater., 2019, 31(19), 8136–8144 CrossRef CAS.
- W. Sun, F. Wang, B. Zhang, M. Zhang, V. Küpers, X. Ji, C. Theile, P. Bieker, K. Xu, C. Wang and M. Winter, Science, 2021, 371(6524), 46–51 CrossRef CAS PubMed.
- J. Han, H. Bao, J. Wang, L. Zheng, S. Sun, Z. L. Wang and C. Sun, Appl. Catal., B, 2021, 280, 119411 CrossRef CAS.
- W. Wu, Y. Liu, D. Liu, W. Chen, Z. Song, X. Wang, Y. Zheng, N. Lu, C. Wang, J. Mao and Y. Li, Nano Res., 2021, 14, 998–1003 CrossRef CAS.
- X. Xie, L. Shang, R. Shi, G. I. N. Waterhouse, J. Zhao and T. Zhang, Nanoscale, 2020, 12, 13129–13136 RSC.
- X. Chen, Z. Yan, M. Yu, H. Sun, F. Liu, Q. Zhang, F. Cheng and J. Chen, J. Mater. Chem. A, 2019, 7, 24868–24876 RSC.
- X. Shi, X. Ling, L. Li, C. Zhong, Y. Deng, X. Han and W. Hu, J. Mater. Chem. A, 2019, 7, 23787–23793 RSC.
- S. G. Chandrappa, P. Moni, G. Karkera and A. S. Prakash, Nanoscale Adv., 2019, 1, 2392–2399 RSC.
- L. Zhang, X. Tang, R. Cai, C. Chen, Y. Xia, H. Zhang, D. Yang and X. Yao, Nanoscale, 2019, 11, 826–832 RSC.
- S. Chen, J. Cheng, L. Ma, S. Zhou, X. Xu, C. Zhi, W. Zhang, L. Zhi and J. A. Zapien, Nanoscale, 2018, 10, 10412–10419 RSC.
- B. Li, X. Ge, F. W. T. Goh, T. S. A. Hor, D. Geng, G. Du, Z. Liu, J. Zhang, X. Liu and Y. Zong, Nanoscale, 2015, 7, 1830–1838 RSC.
- M. Prabu, K. Ketpang and S. Shanmugam, Nanoscale, 2014, 6, 3173–3181 RSC.
- P. Suchomel, L. Kvitek, R. Prucek, A. Panacek, A. Halder, S. Vajda and R. Zboril, Sci. Rep., 2018, 8, 4589 CrossRef PubMed.
- Y. Dai, Y. Wang, B. Liu and Y. Yang, Small, 2015, 11(3), 268–289 CrossRef CAS PubMed.
- G. Solomon, M. G. Kohan, A. Landström, A. Vomiero and I. Concina, Appl. Phys., 2020, 128, 180905 CAS.
- P. Feicht and S. Eigler, ChemNanoMat, 2018, 4, 244–252 CrossRef CAS.
- Q. Ma, X. Zhu, D. Zhang and S. F. Liu, J. Mater. Chem. C, 2014, 2, 8956–8961 RSC.
- S. Filho, E. C. Venancio, S. C. Silva, H. Takiishi, L. G. Martinez and R. A. Antunes, SN Appl. Sci., 2020, 2, 1450 CrossRef.
- C. Zhang, W. Lv, W. Zhang, X. Zheng, M. Wu, W. Wei, Y. Tao, Z. Li and Q. Yang, Adv. Energy Mater., 2014, 4, 1301565 CrossRef.
- V. Agarwal and P. B. Zetterlund, Chem. Eng. J., 2021, 405, 127018 CrossRef CAS.
- A. Alazmi, V. Singaravelu, N. M. Batra, J. Smajic, M. Alyami, N. M. Khashab and P. M. F. J. Costa, RSC Adv., 2019, 9, 6299–6309 RSC.
- L. Poolnapol, W. Kao-ian, A. Somwangthanarok, F. Mahlendorf, M. T. Nguyen, T. Yonezawa and S. Kheawhom, Energies, 2020, 13, 462 CrossRef CAS.
- R. Li, R. Zhang, B. Zhang, W. Fang, Y. Qiao, W. Wang, Z. Cui and D. Zhang, J. Appl. Electrochem., 2021, 51, 155–171 CrossRef CAS.
- T. X. Nguyen, Y. Liao, C. Lin, Y. Su and J. Ting, Adv. Funct. Mater., 2021, 31(27), 2101632 CrossRef CAS.
- J. Yi, X. Liu, P. Liang, K. Wu, J. Xu, Y. Liu and J. Zhang, Organometallics, 2019, 38, 1186–1199 CrossRef CAS.
- Z. Guo, X. Wang, F. Yang and Z. Liu, J. Alloys Compd., 2022, 895, 162614 CrossRef CAS.
- Z. Xu, W. Zuo, T. Shi, X. Liu, H. Li, P. Zhao and G. Cheng, Dalton Trans., 2022, 51, 3137 RSC.
- L. Wei, H. E. Karahan, S. Zhai, H. Liu, X. Chen, Z. Zhou, Y. Lei, Z. Liu and Y. Chen, Adv. Mater., 2017, 29, 1701410 CrossRef PubMed.
- Y. Gong, W. Ding, Z. Li, R. Su, X. Zhang, J. Wang, J. Zhou, Z. Wang, Y. Gao, S. Li, P. Guan, Z. Wei and C. Sun, ACS Catal., 2018, 8, 4082–4090 CrossRef CAS.
- I. Kone, Z. Ahmad, A. Xie, L. Long, Y. Tang, Y. Sun, Y. Chen, X. Yang and P. Wan, Energy Technol., 2021, 9, 2001117 CrossRef CAS.
- S. Wakeland, R. Martinez, J. K. Grey and C. C. Luhrs, Carbon, 2010, 48, 3463–3470 CrossRef CAS.
- I. C. Nlebedim, J. E. Snyder, A. J. Moses and D. C. Jiles, IEEE Trans. Magn., 2012, 48, 3084–3087 CAS.
- S. T. Murphy, C. A. Gilbert, R. Smith, T. E. Mitchell and R. W. Grimes, Philos. Mag., 2010, 90, 1297 CrossRef CAS.
- Y. Mordekovitz, Y. Shoval, N. Froumin and S. Hayun, Materials, 2020, 13, 3195 CrossRef CAS PubMed.
- D. A. Andersson and C. R. Stanek, Phys. Chem. Chem. Phys., 2013, 15, 15550 RSC.
- N. Yamada, D. Kowalski, A. Koyama, C. Zhu, Y. Aoki and H. Habazaki, RSC Adv., 2019, 9, 3726 RSC.
- S. Geiger, O. Kasian, M. Ledendecker, E. Pizzutilo, A. M. Mingers, W. T. Fu, O. Diaz-Morales, Z. Li, T. Oellers, L. Fruchter, A. Ludwig, K. J. J. Mayrhofer, M. T. M. Koper and S. Cherevko, Nat. Catal., 2018, 1, 508–515 CrossRef CAS.
- P. T. Nam, N. V. Khanh, N. T. Thom, N. T. Phuong, N. V. Trang, N. T. Xuyen, V. Q. Thai, V. A. Tuan and D. T. M. Thanh, Vietnam J. Chem., 2018, 56, 778 CrossRef.
Footnote |
| † Electronic supplementary information (ESI) available: A TEM micrograph of FeCo oxide sintered with graphite; representative charge/discharge profiles of ZABs using FeCo 0 wt%–100 wt% catalysts; number of discharging/charging cycles for various FeCo loading levels evaluated at 95% and 85% discharge capacities; UV-vis spectra of the electrolyte after 0, 3, 7, 11 and 23 cycles of discharging and charging in a ZAB with FeCo 40 wt%; GDL of a ZAB observed with an optical microscope; CV, LSV, and discharge potentials of FeCo catalysts at different loading levels; the Koutecký–Levich equation and parameters. See DOI: https://doi.org/10.1039/d2nr01258h |
| This journal is © The Royal Society of Chemistry 2022 |

