 Open Access Article
Creative Commons Attribution 3.0 Unported Licence
The energy return on investment of BECCS: is BECCS a threat to energy security?
Mathilde
Fajardy
ab and
Niall
Mac Dowell
 *ab
*ab
aCentre for Environmental Policy, Imperial College London, Exhibition Road, London, SW7 1NA, UK. E-mail: niall@imperial.ac.uk; Tel: +44 (0)20 7594 9298
bCentre for Process Systems Engineering, Imperial College London, Exhibition Road, London, SW7 2AZ, UK
First published on 26th April 2018
Abstract
Compliance with long term climate targets whilst maintaining energy security is understood to rely heavily on the large-scale deployment of negative emissions technologies (NETs). One option, Bioenergy with Carbon Capture and Storage (BECCS), is prominent in Integrated Assessment Models (IAMs), with projected annual contributions of 8–16.5 GtCO2 per year of atmospheric carbon dioxide removal whilst contributing 150–300 EJ per year, or 14 to 20% of global primary energy supply, in 2100. Implicit in these scenarios is the assumption that BECCS is a net producer of energy. However, relatively energy intensive biomass supply chains and low power generation efficiency could challenge this ubiquitous assumption. Deploying an energy negative technology at this scale could thus represent a threat to energy security. In this contribution, we evaluate the energy return on investment (EROI) of an archetypal BECCS facility. In order to highlight the importance of biomass sourcing, two feedstock scenarios are considered: use of domestic biomass pellets (UK) and import of biomass pellets from Louisiana, USA. We use the Modelling and Optimisation of Negative Emissions Technologies (MONET) framework to explicitly account for growing, pre-treating, transporting and converting the feedstock in a 500 MW BECCS facility. As an example, we illustrate how the net electricity balance (NElB) of a UK-based BECCS facility can be either positive or negative, as a function of supply chain decisions. Power plant efficiency, fuel efficiency for transport, transport distance, moisture content, drying method, as well as yield were identified as key factors that need to be carefully managed to maximise BECCS net electricity balance. A key insight of this contribution is that, given an annual carbon removal target, increasing BECCS' power generation efficiency by using a more advanced biomass conversion and CO2 capture technology could improve BECCS net electricity balance, but at the cost of increasing the amount of BECCS capacity required to meet this target. BECCS optimal deployment pathway is thus heavily dependent on which service provided by BECCS is most valued: carbon dioxide removal or power generation.
Broader contextIt has become apparent from the Integrated Assessment Models (IAMs) mitigation pathways that BECCS is indispensable to achieving climate targets. In most models, BECCS deployment reaches a maximum value of 250 EJ per year by 2100, further deployment being constrained by the limited availability of sustainable biomass assumed in the models. However, this deployment rate relies on the assumption that BECCS is, in all cases, a net energy provider, whereas in reality the converse could be true in the case of an energy intense biomass supply chain and low power generation efficiency. In 2015, bioenergy contributed to 7% of the world primary energy production, with approximately 56 EJ of bioenergy produced. Deploying BECCS at the gigatone scale could therefore increase the current primary bioenergy demand five fold by 2100. In this context, the value of BECCS Electricity Return on Investment (ElROI) or Net Electricity Balance (NElB) could have profound implications for the energy system: an EROI below unity would mean that more energy is used to operate BECCS than what is returned to society, which could compromise energy security, as well as increasing the use of higher EROI technologies, such as fossil fuels, to sustain BECCS in the energy mix. Unintended consequences of this could include an increase in CO2 emissions, with a potential offset of the carbon dioxide removal service provided by BECCS. Identifying the factors influencing BECCS net electricity balance, and understanding the implications of a negative electricity balance on the world energy demand, is thus crucial when deploying BECCS at the projected scale. |
1 Introduction
1.1 BECCS and integrated assessment models
The UNEP Emissions Gap report1 recently reasserted the importance of negative emissions technologies (NETs) in maintaining a “well below 2 °C” temperature trajectory, with contributions as high as 20 GtCO2 per year by 2100. By combining bioenergy with capture and storage of the CO2 emitted upon conversion of the biomass, Bioenergy with Carbon Capture and Storage (BECCS) has been identified as a key negative emissions technology.2–4 Because this technology uniquely removes CO2 from the atmosphere while providing power, there is a general consensus that BECCS will likely be indispensable to achieving these negative emissions, with projected contributions a high as 8.5 to 16 GtCO2 per year of carbon removal.5–7 However, there is an ongoing controversy around BECCS ability to deliver these negative emissions, if at all, in a cost-effective and resource efficient8–10 way. This has led some to suggest that relying so heavily on greenhouse gas removal (GGR) techniques in general, and BECCS in particular, could represent a moral hazard, preventing us from taking active steps towards climate mitigation today.11 In addition to contributing to carbon removal, BECCS is also projected to significantly contribute to global energy supply, providing between 100 and 300 EJ per year to the primary energy mix.6,7 If negative emissions are to be achieved via BECCS, in a way that is both sustainable and resource efficient, it is important to understand under which conditions BECCS can be deployed such that it is simultaneously net CO2 negative, resource efficient, and net energy positive.1.2 Is BECCS energy positive?
One of the main assumptions underpinning the use of BECCS is most modelling efforts is that BECCS is a net provider of power. However, the energy intensity of biomass supply chains could represent a challenge to this assumption.10,12 Additionally, the conversion of a lower quality fuel – biomass – combined with CO2 capture and storage, impose an energy penalty on the system, relative to conventional fossil power generation, resulting in a potentially low power generation efficiency.13 In their review, Moriarty et al.14 say that there is uncertainty as to the capability of bioenergy to be a net provider of energy, and further argue that were it to pass the “energy test”, it might not deliver emissions reduction. Vaughan et al.8 identified seven BECCS assumptions with both high uncertainty and great impact on BECCS performance, and highlighted BECCS total contribution to the energy system as one of them. Smith et al.9 presented a high level analysis showing that BECCS had a positive net energy balance on average, with energy production ranges of 3–40 GJ per tCeq for energy crops. However, the analysis also pointed out the possibility of energy negative scenarios with an energy consumption up to 8.7 GJ per tCeq. Nevertheless, BECCS is still consistently represented as a net source of both negative emissions and power in Integrated Assessment Models (IAMs), which explains its prevalence in these models.7 Understanding the circumstances under which BECCS deployment might lead to a negative energy balance, and the implications for the energy system, is thus crucial to the design of BECCS systems that will make a net positive contribution to climate change mitigation.1.3 EROI for technology valuation
Energy systems follow the same rule as organic systems: in order to be viable, they need to produce at least as much useful energy as they consume.15 This is measured by the Energy Return On Investment (EROI), which calculates the ratio of energy output of a system or resource to all the energy inputs required by this system, or to exploit this resource. It is thus a measure of the energy cost of energy: how much energy is required to provide energy in a specific form with a given technology? Deploying a technology with an EROI less than unity, would mean that overall, the technology uses more energy than it returns to society, which would result in the need for this technology to be complemented by other energy sources, preferably with a high EROI, to operate. Hall et al.15 suggest that fossil fuels could typically be used to compensate this energy deficit. From this perspective, if, owing to poor management of the supply chain, BECCS EROI were to be found very low, deploying BECCS at the EJ scale could lead to an increase in fossil fuel use, which could hinder the potential environmental benefits of BECCS deployment, leading to further overshoot of emissions requiring the subsequent additional deployment of NETs, and so on, ad infinitum.Though conceptually simple, there are, however, many caveats associated with the calculation of this metric. The first lies in the definition of the boundaries of the system for which EROI is calculated: what should be considered as the “energy output” of the system, and similarly, what should be considered as “energy inputs”.16 Murphy et al.16 categorised fourteen EROI methodologies, defining three levels of energy output boundaries from extraction (or “mine-mouth”) to end-use or point of use, and five levels of energy inputs from direct energy and material inputs to auxiliary services consumption and environmental impacts. As pointed out by the authors, the diversity in methodologies result in a great divergence in EROI values in the literature, with the EROI of modern coal being found between 20 and 67, between 1.6 and 12 for solar collectors power, and 0.8 and 10 for biofuels. Another consequence of this boundary definition is that the criteria of having an EROI above one at extraction or processing might not be enough, as the EROI at the point of use could therefore be lower than one. For example, Hall et al.15 propose that biofuels must provide a minimum EROI of 3![[thin space (1/6-em)]](https://www.rsc.org/images/entities/char_2009.gif) :
:![[thin space (1/6-em)]](https://www.rsc.org/images/entities/char_2009.gif) 1 at processing in order to be a viable alternative to fossil fuels.
1 at processing in order to be a viable alternative to fossil fuels.
Another challenge lies in differentiating energy inputs and outputs in terms of energy quality. Considering that 1 Joule of diesel has the same value as 1 Joule of solar power overlooks the many attributes of an energy source; among service provided, scarcity, exergy, energy density, cleanliness, etc., which overall define its quality.16 As a first approach, a common but fundamental distinction is made in studies between Primary Energy (PE) sources and Energy Carriers (EC): when calculating EROI based on energy carriers, 1 Joule of electricity is equivalent to 1 Joule of fuel, whereas in a primary energy methodology, all energy carriers vectors are converted back into the primary energy source from which they were generated.17,18 When the output of the system is electrical energy, considering the electrical equivalent energy of primary energy inputs is another method when performing EROI calculations. In calculating the net electricity balance and the ElROI of solar photovoltaic (PV), Dale et al.19 considered the total electrical output, minus, or divided by, the cumulative primary energy use for the technology supply chain, converted into electrical energy equivalent. Methodologies to convert energy inputs to weight them by quality, price-based adjustment or exergy-based adjustments are further examples which highlight the potential complexity of EROI calculation.16
The quality of the energy source is equally important when comparing the EROI of different technologies, and can also be measured by the nature of the service provided by the energy source. Renewables such as wind and solar, which provide ready-to-use electricity, have typically a lower EROI than fossil fuels, which still need to be converted before delivering any form of energy. When comparing energy sources on the basis of similar service provided, the EROI of coal electricity for example, can be found between 12–24,17 which is of the same magnitude of solar electricity, with values between 6 and 12,17 and a median at 10.20
1.4 The EROI of bioenergy
There are many studies presenting energy analysis or EROI calculations of solid and liquid biofuels, as well as ElROI calculations of bioelectricity. Moriarty et al.14 points out the wide range in these evaluations. The EROI of short rotation willow in Europe has been reported to be in the range 14.4–64.8, and that of Miscanthus in Ireland, between 3.6 and 6.5. In terms of biofuels EROI, US corn ethanol was evaluated at 1.5, Brazilian sugar cane ethanol at 5, corn biodiesel at 1.61, and cellulosic ethanol up to 6. These examples highlight the importance of explicitly considering specific region and feedstock when evaluating the EROI of resources, as biomass yield per hectare for example, may vary strongly from one region to another. Model boundaries also matter in the calculations. Table 1 gathers EROI values adapted from the literature,10 and highlights the importance of boundary choice when assessing bioenergy energy balance.| Crop, region | EROIa | Boundaries |
|---|---|---|
| a EROI of biomass pellet or ElROI of bioelectricity. | ||
| Miscanthus, average21 | 34.6 | Raw biomass: production only no irrigation |
| Miscanthus, Poland22 | 23.4 | Raw biomass: production only no irrigation, 4k transport |
| Miscanthus, Germany23 | 14.4 | Bioelectricity: production (bale), 100k transport, chopping and milling for combustion |
| Miscanthus, Ireland24 | 3.6 | Pellet: production (bale) no irrigation, 100k transport, drying and pelleting |
| Switchgrass, USA25 | 9.5–12 | Raw biomass: production (bale or chopped) incl. irrigation |
| Switchgrass, USA26 | 74–84 | Raw biomass: production (bale) no irrigation, storage |
| Switchgrass, USA21 | 16.4 | Raw biomass: production only no irrigation |
| Switchgrass, USA27 | 11–20 | Raw biomass: production only no irrigation (bale, chopped), transport 40k |
| Willow, Sweden28 | 20.9 | Raw biomass: production and 50k transport |
| Willow, average21 | 12 | Raw biomass: production only no irrigation |
| Willow, Belgium29 | 11–54 | Raw biomass: production only no irrigation |
| Wood pellets, Australia and Russia30 | 2.4–15.9 | Pellet: production, drying (50% of the feedstock), pelleting and transport |
| Willow, Poland22 | 15.5 | Raw biomass: production only no irrigation, 4k transport |
| Wheat straw, New Zealand31 | 4.2 | Bioelectricity: collection (bale), 90k transport, grinding, combustion |
| Wheat straw, UK32 | 2.3 | Bioelectricity: collection (bale), 40k transport, conditioning, combustion |
From this brief review of the literature, it can be observed that bioenergy EROI has been reported to have a wide range, with values between 2.3 and 84 as a function of biomass type, origin, and specific supply chain. However, when considering the whole value chain including pre-treatment and transport of the biomass, the range narrows to 3.6 to 15.9 for ready-to-use biomass pellets, and 2.3 and 4.2 for bioelectricity, when including pellet combustion. However, no ranges of EROI values for BECCS are reported in the literature.
The purpose of this study is to deliver an EROI analysis of BECCS, in order to provide insight into the circumstances under which BECCS can be net positive or negative, and to identify the key levers for improving the net energy balance. The remainder of the paper is structured as follows. Section 2 presents the model and assumptions used for this analysis, and Section 3 the details of the supply chain scenarios considered for this study. Section 4 presents the cumulative energy demand, cumulative EROI and cumulative net electricity balance of a UK-based BECCS facility using domestic or imported biomass pellets. In Section 5, an energy flow analysis provides insights as to the key levers of BECCS electricity balance improvement, including BECCS power generation efficiency. In meeting its long-term climate change commitments, the UK has set the target of achieving a net zero CO2 economy by 2050. As the UK economy is not anticipated to be carbon neutral by 2050, meeting this target will rely on the net removal of CO2 from the atmosphere, via the deployment of negative emissions technologies at the rate of 50 MtCO2 per year.33 The impact of BECCS power generation efficiency on the net electricity balance, the BECCS capacity and amount of resources – land and water – required to remove these 50 MtCO2 per year with UK-base BECCS fleets is also evaluated in Section 5. Finally Section 6 discusses the results and their socio-economic implications.
2 Methodology
This study uses the Modelling and Optimisation of Negative Emissions Technologies (MONET) framework, presented previously.10 This model enables the calculation of the energy, water, carbon and land intensities of growing, harvesting, processing, transporting biomass feedstock to the UK, and converting in a 500 MW thermal power plant combined with post-combustion capture technology. We consider four distinct biomass feedstock: miscanthus and switchgrass for perennial grasses, short rotation coppice willow for dedicated woody biomass crop, and wheat straw for agricultural residues. Five different regions of the world are considered as regions of import for the UK: Brazil, Europe, China, India, and the USA. Fig. 1 presents an overview of the model.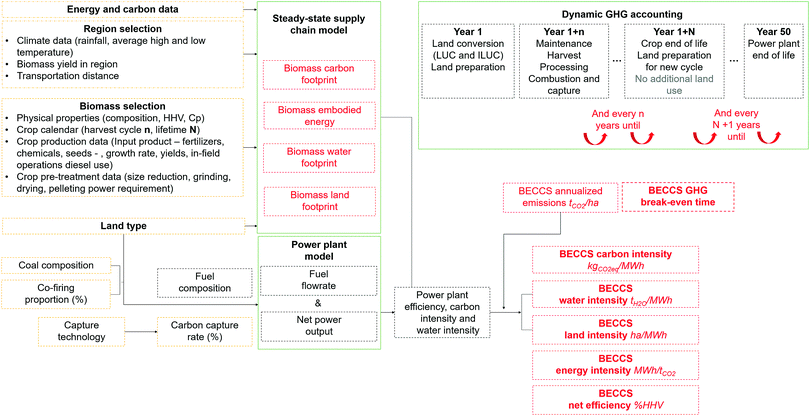 | ||
| Fig. 1 Overview of the MONET model as presented in Fajardy and Mac Dowell.10 The model takes energy, carbon, region, biomass and land data as inputs, and computes the carbon intensity, water intensity, land intensity and net efficiency of a UK-based BECCS system operating with a given biomass type, imported from a given region of the world, and grown on a given land type. The carbon balance was also implemented dynamically to calculate the system carbon breakeven time and annualised carbon removal. | ||
2.1 Energy modelling and extensions
Droad(sr,p) = t(sr) × Rearth × arcos(sin![[thin space (1/6-em)]](https://www.rsc.org/images/entities/char_2009.gif) YP(p)) × sin YP(p)) × sin![[thin space (1/6-em)]](https://www.rsc.org/images/entities/char_2009.gif) YC(sr) + cos YC(sr) + cos![[thin space (1/6-em)]](https://www.rsc.org/images/entities/char_2009.gif) YP(p) × cos YP(p) × cos![[thin space (1/6-em)]](https://www.rsc.org/images/entities/char_2009.gif) YC(sr) × cos(XC(sr) − YP(p)) YC(sr) × cos(XC(sr) − YP(p)) | (1) |
Approximate tortuosity factors were computed for each sub-region sr, by dividing the road distance of the centroid to the nearest port, by the euclidian distance between these two points.
– Energy carrier demand EcD(sr,b,yr), the sum of all specific annual energy inputs EIcD(sr,b,yr,k) in the forms of energy carrier k (electricity, diesel, natural gas, fuel) required along the BECCS value chain, at year yr, per biomass type b, imported from sub-region sr. The cumulative energy carrier demand CEcD(sr,b,yr) is then calculated as the summation of all inputs from year 1 to a given year, yr. It can be expressed per hectare of land or per ton of biomass pellet delivered at the power plant:
 | (2) |
– Cumulative primary energy demand CEpD(sr,b,yr), the cumulative sum of all energy inputs EIpD(sr,b,yr,k) in the forms of primary energy required along BECCS value chain at a given yr through a BECCS project. This metric is calculated by converting the EIcD(sr,b,yr,k) into primary energy equivalent, using an energy carrier to primary energy conversion factor ECToPE(k) of each energy carrier k:
 | (3) |
| EIpD(sr,b,yr,k) = EIcD(sr,b,yr,k) × ECToPE(k) | (4) |
For fuels, i.e. diesel, heavy fuel oil, natural gas, ECToPE(k) can be calculated from:
 | (5) |
 | (6) |
– Cumulative electricity demand CElD(sr,b,yr), the sum of all primary energy inputs converted into electrical energy equivalent:
 | (7) |
For fuels, i.e. diesel, heavy fuel oil, natural gas, ECToPE(k) is to conversion efficiency of the fuel k to electricity:
| PEToEl(sr,k) = ηfuel(sr,k) | (8) |
For electricity, EIlD(sr,b,yr,electricity) is simply equal to EIcD(sr,b,yr,electricity):
| EIlD(sr,b,yr,electricity) = EIcD(sr,b,yr,electricity) | (9) |
– Cumulative primary energy generated, CEpG(sr,b,yr), the cumulative bioenergy in the form of biomass pellets delivered to the power plant at year yr. This metric can be expressed per hectare of land:
| CEpG(sr,b,yr) = HHV(b) × CBio(sr,b,yr) | (10) |
| CEpG(sr,b,yr) = HHV(b) | (11) |
– Cumulative electricity generated CElG(b)(sr,b,yr), the cumulative bioelectricity delivered by a BECCS facility at year yr. This metric can be expressed per hectare of land or per ton of biomass pellet, and is related to the CEpG(sr,b,yr) by the power generation efficiency of the BECCS plant:
| CElG(sr,b,yr) = CEpG(sr,b,yr) × ηplant(b) | (12) |
– Energy return on investment EROI(sr,b,yr), the ratio of the cumulative primary energy generated to the cumulative primary energy demand:
 | (13) |
– Electricity return on investment ElROI(sr,b,yr), the ratio of the cumulative electricity generated to the cumulative electrical energy equivalent demand:
 | (14) |
– Net electricity balance NElB(sr,b,yr), the difference between the electricity generated by the system and the cumulative electricity demand along BECCS value chain:
| NElB(sr,b,yr) = CElG(sr,b,yr) − CElD(sr,b,yr) | (15) |
– Electricity pay-back time ElPBT(sr,b), the time required for the ElROI to be above one:
 | (16) |
Similarly, another definition is the time required for the net electricity balance to be positive:
 | (17) |
Fig. 2 provides an overview of the BECCS energy model and its key indicators.
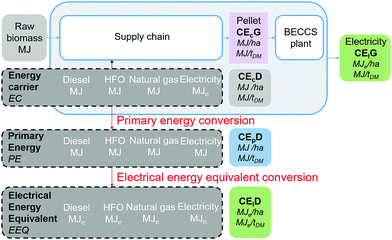 | ||
| Fig. 2 Overview of the BECCS dynamic energy model. Net electricity balance, electricity return on investment and electricity pay-back time are calculated based on these metrics. | ||
In the case of chemical inputs (fertilizers, lime, herbicide and pesticide), MONET explicitly considers them by including the manufacturing energy of these inputs. As these chemicals are usually made from natural gas, this embodied energy is considered both as an energy carrier and primary energy input.18
3 Thought experiment
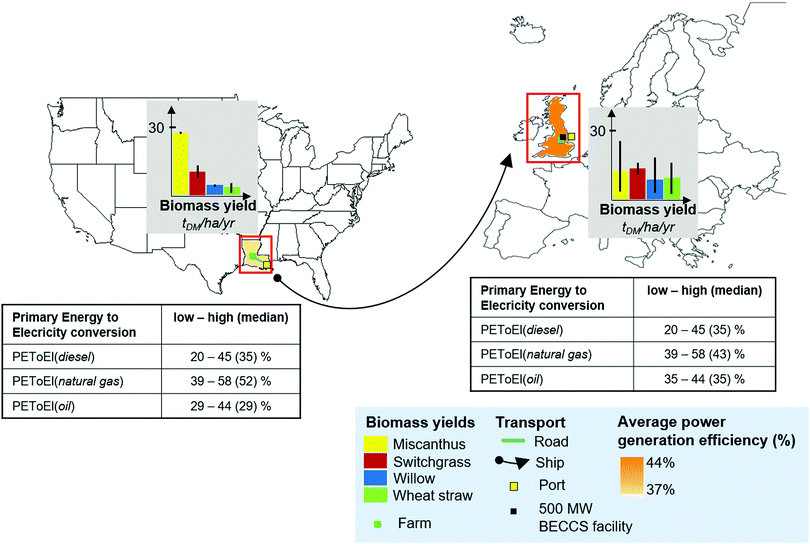
A UK-based 500 MW dedicated biomass pulverized fuel power plant, combined with amine-based post-combustion capture technology was considered as the main BECCS pathway for the UK in this analysis. Two archetypal feedstock supply chains were considered: domestic pellets and imported pellets from overseas. The purpose of these two scenarios is to compare the energy and carbon intensities of using local biomass, hence minimising transport, with importing biomass from a potentially more productive region, close to the coast, which requires oversea shipping. The region of import selected for the purpose of this study was Louisiana, as this is where the pelleting plants and port terminal owned by the UK DRAX power plant, which sources over 50% of its pellet supply from the USA, are located.36Fig. 3 gives a graphical representation of these two thought experiments, including key regional input data such as biomass yield, grid power generation efficiency, and primary energy to electrical energy conversion coefficients for the different fuels involved in BECCS value chain. As observed in Fig. 3, biomass yield is on average higher in the oversea scenario, while the average efficiency of power generation is lower, which has a direct impact on the power to primary energy conversion when computing the EROI of the overall system. Both options were evaluated with the low, median and high values of the input parameters, resulting in a low, median and high scenarios for the results. It is worth noting that as more data was available for the UK than for Louisiana, the uncertainty ranges were usually larger for the UK.Table 2 in Appendix A summarises the low, median and high values of some of the key model input data in both pellet supply chain scenarios, with their references.
4 BECCS net electricity balance
4.1 Cumulative energy demand of BECCS
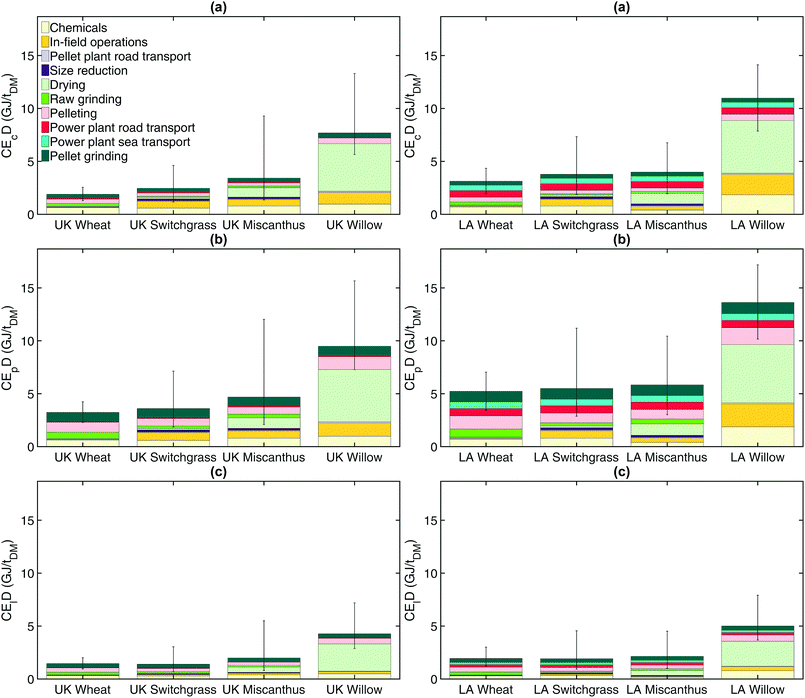
The cumulative energy demand of BECCS was calculated in terms of energy carrier, primary energy and electrical energy equivalent, over the lifetime of a BECCS project which was considered to be fifty years, expressed in GJ per ha, or in GJ per tDM. When expressed in GJ per tDM, the cumulative energy demand is the same as the embodied energy (EE) of the dried pellet delivered at the power plant. These results are presented in Fig. 9 in Appendix B. It was observed that the cumulative energy demand is strongly dependent on the region of origin and biomass type. As expected, the cumulative energy demand expressed in terms of primary energy presents the numerically largest result, between 1.8 and 17.2 GJ per tDM, with large contributions from the electricity inputs such as grinding, pelleting and pellet grinding. The cumulative energy demand in energy carrier results in a numerically smaller value, between 1.2 and 14.1 GJ per tDM, with larger contributions from fossil fuel inputs such as farming, transport and drying. Finally, the energy demand in electrical energy equivalent is the lowest, with values between 0.7 and 7.9 GJ per tDM. EROI methodology therefore impacts the total cumulative energy demand, as well as the main drivers of this energy demand. One must therefore be cautious when choosing one methodology over the other when identifying the key levers of improvement of BECCS net energy balance. Wheat straw has the lowest cumulative energy demand. This can be explained by the fact that, in MONET, wheat straw is considered to be an agricultural residue, and all the energy inputs – fertilizer and in-field operations – associated with the production of wheat grain, are not allocated to the straw. However, straw collecting and additional fertilizer application due to removal of the straw from the field were accounted for. Naturally, importing pellets from Louisiana as compared to using domestic pellet from the UK increases the transport contribution. However, as can be seen in the case of miscanthus, the transport energy contribution increase can be almost compensated by the decrease of other contributions such as chemicals, and in field operations, due to a higher crop yield.4.2 ElROI and net electricity balance
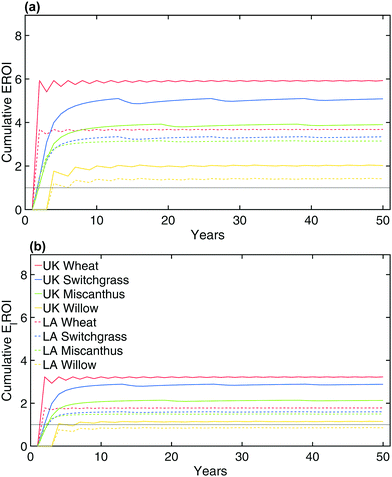
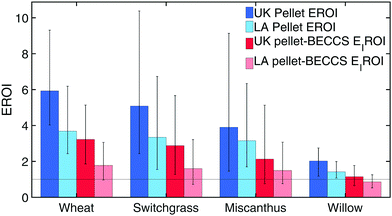
Having first calculated pellets' cumulative energy demand and BECCS cumulative electricity produced over the project lifetime, we calculated BECCS EROI and ElROI as a function of time. Fig. 4 presents the evolution of the values of biomass pellets EROI (a) and BECCS ElROI (b) over time.Two specific insights can be obtained from Fig. 4: the median cumulative EROI and ElROI values over the project lifetime, as well as the electricity pay-back time. It is observed that for electricity positive systems, the ElPBT varies from 1 to 4 years. In the case of willow, upon importing pellets as opposed to using domestic pellets, the system becomes energy negative, as the lifetime ElROI is found to be below one. The range of values obtained for the lifetime cumulative EROI and ElROI are presented in Fig. 5.
As observed in Fig. 5, the median lifetime cumulative EROI varies from 1.1 to 10.3. These values are consistent with the biomass pellet EROI range of 3.6 to 15.9 reported in the literature, considering the variability in the input data and EROI calculation boundaries. In terms of lifetime cumulative ElROI, values drop to 0.5 for willow from Louisiana, with maximal ElROI attained for domestic switchgrass at 5.7.
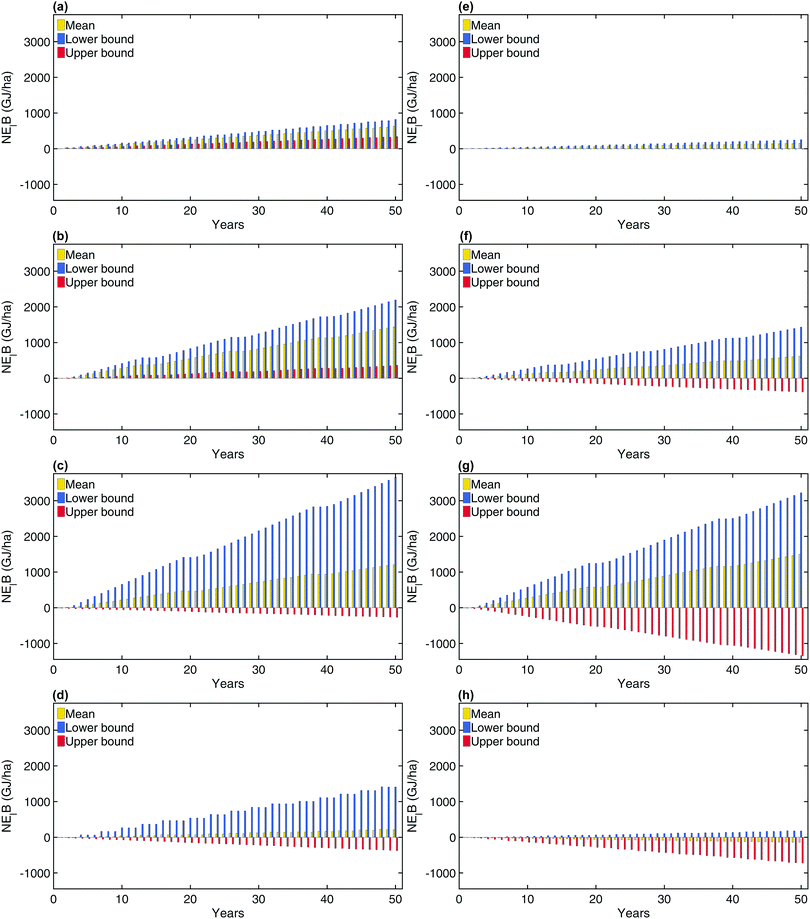
Another way to look at the dynamic energy return is to analyse the net electricity balance of the system, over the course of a project lifetime. These results are presented in Fig. 6.
As presented in Fig. 6, depending on the region and feedstock scenario, but also on the model input data (yield, moisture content, chemical application rate, fuel efficiencies, embodied energy in fuel and chemicals, primary energy to electrical equivalent conversion coefficients, power generation efficiency, etc.), BECCS can lead to both negative and positive energy balances.
Overall, using agricultural residues such as wheat straw could be a promising option, as operating BECCS with this feedstock overall leads to a positive energy balance. However, this statement requires several caveats. First, the lifetime cumulative energy generation per hectare of such a system is low owing to a low straw yield per hectare, resulting in an inefficient use of the land for energy production via BECCS. Moreover, considering straw as a waste from grain production stands a long as wheat grain is not grown as an energy crop, which could be challenged if all wheat straw production was used for BECCS. Finally, BECCS deployment through agricultural residues will also be limited by regional wheat availability. Using energy dedicated crops could be more challenging because of yield variability, as well as higher cumulative energy demand. In the case of willow, a lower yield, longer harvest cycle and higher cumulative energy demand result in a very low cumulative net power production in the mean and high scenarios, with an net energy negative balance in the mean scenario in the case of pellet imports from Louisiana. However, using higher productive grasses such as Miscanthus and Switchgrass could result in high cumulative net energy balance over fifty years, with values as high as 3500 GJ per ha of net electricity produced in the case of Miscanthus from the UK.
5 Improving BECCS net electricity balance
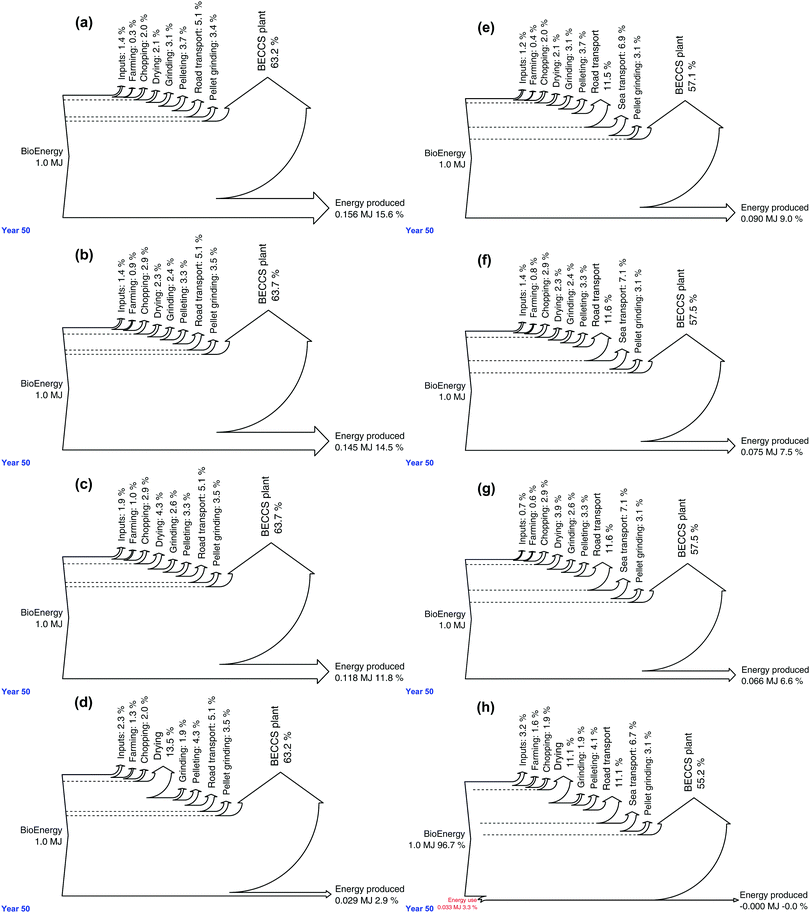
5.1 Identification of main energy losses
A energy flow analysis was performed on the system to identify the main energy losses along BECCS value chain, and their impact on BECCS electricity balance. Fig. 7 presents the energy flow diagram of BECCS systems operating on domestic and imported biomass feedstock.Biomass conversion and CCS in the BECCS facility, followed by road transport, drying, and farming (including inputs) constitute the main energy losses along the chain. Power generation efficiency, transport fuel efficiency, moisture content and yield are therefore key parameters to be optimised when maximising BECCS net electricity balance. In terms of management of these levers, yield, moisture, and transport fuel efficiency are highly dependent on the feedstock and region of import, and can therefore be complex to predict and control. Power generation efficiency, however, as purely linked to the technology of the UK-based facility, constitutes a more tractable level to improve BECCS net electricity balance. In this analysis, the power plant power generation efficiency is calculated in the model based on the fuel quality (HHV, composition, moisture content) and CO2 capture rate, for a state-of-the-art amine based post-combustion capture technology, with a solvent regeneration heat duty of approximately 3.6 GJ per tCO2. With biomass pellets at 5% moisture and a power plant operating at 100% co-firing and 90% capture rate, the efficiency is found to be around 26%HHV for all scenarios. As shown by Bui et al.,13 BECCS efficiency can be increased by using advanced solvents with reduced heat duty, as well as by implementing heat integration options such as heat recovery from the exhaust gas to provide the solvent regeneration heat duty. With such modifications, it was found that BECCS power generation efficiency could be increased to 38%HHV. This option was subsequently evaluated in MONET.
5.2 Power generation efficiency improvement and implications for resource mobilisation
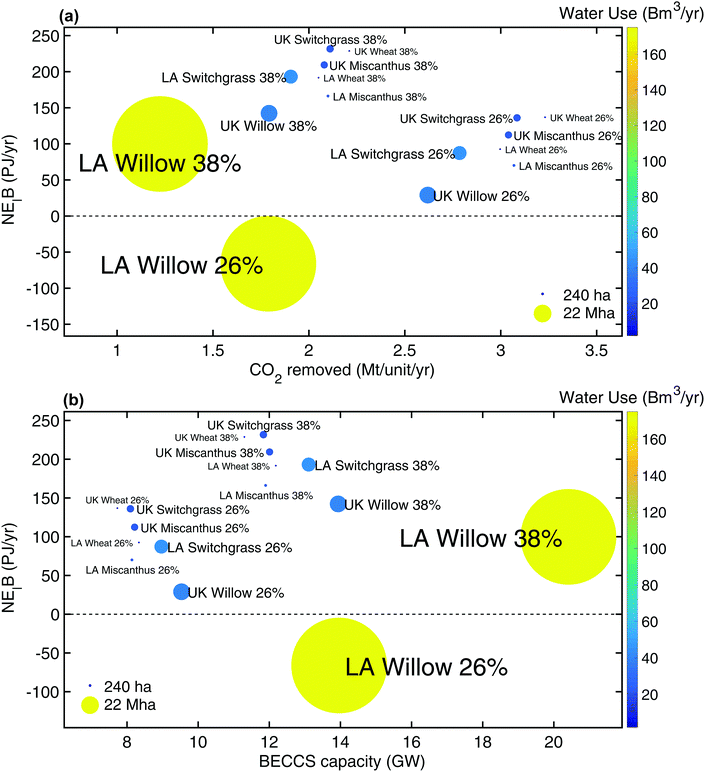
In this section of the analysis, we calculate the annual net electricity production of a UK BECCS fleet operating to remove 50 MtCO2 per year. Using MONET, this target scenario also enables the calculation of the annual land, water and BECCS capacity requirements to meet this carbon removal target.Fig. 8 represents the net energy balance, land use, water use, BECCS capacity and amount of CO2 removed per unit per year for 26% and 38% efficient BECCS fleets, for all pellet supply scenarios. It is worth noting that the amount of CO2 removed per unit per year, and BECCS deployed capacity, are inversely proportional.
As can be observed from Fig. 8, BECCS capacity requirement and resource mobilisation in order to meet a given carbon removal target is entirely case specific. Meeting the UK's 2050 target will require between 8–14 GW of installed capacity, which represents 14 to 25% of the UK annual electricity generation by 2050.37 In terms of resources, between 2–175 Bm3 per year of water and between 232 ha and 22 Mha of land would be required, domestic wheat straw being the best case scenario, and imported willow pellets, the worse. It is important to note that these scenarios were considered to compare two archetypal supply chains, and no constraint on regional land and water availability were considered in their implementation. As a reality check, in the BECCS via domestic wheat straw scenario, 47 Mt of wheat straw, hence about 36 Mt of wheat grain, would be required per year, which is more than double the UK annual wheat production in 2014.38 A combination of wheat straw and energy dedicated crops would therefore be required to meet the UK carbon removal target via BECCS with domestic biomass. Similarly, relying on imported willow pellets to meet the UK carbon removal target would lead to the mobilisation of 22 Mha of land in Louisiana. In this study, we assume that energy dedicated crops are grown on marginal land to avoid direct and indirect land use change.10 As the total area of Louisiana is approximately 13.5 Mha, there would not be enough land, let alone marginal land, to meet the UK removal target via this option. Designing optimal BECCS supply chains to meet a given carbon removal target will therefore need to consider a combination of regions, and specifically account for regional land and residue availability. It is also worth noting that wheat straw very low land use and water use is also due to the fact that straw was considered as a waste from wheat grain production, therefore not accounting for land and water use for wheat farming in wheat straw CO2, water and land balance. This assumption could be challenged if wheat straw use for BECCS started to impact wheat production for food. In terms of net electricity generated, this BECCS fleet can generate up to 137 PJ per year in the case of domestic wheat straw, but also require up to 66 PJ per year in the case of willow pellets imported from Louisiana. To put these values in context, in 2014, electricity generation from bioenergy in the UK amounted to approximately 118 PJ.39 Meeting the UK annual carbon removal target per year could thus potentially result in a 16% increase of bioelectricity supply when using domestic agricultural residues such as wheat straw, but could also consume the equivalent of 50% of the current UK bioelectricity supply when operating on willow pellets imported from southern USA. This could have profound implications as to UK electricity system design, with current forecast relying on BECCS as a net source of electricity, rather than as a net sink of electricity. Increasing BECCS power generation efficiency would improve the system net energy balance, but would also result in a lower CO2 removal per BECCS unit, hence requiring greater BECCS facility, as we have discussed previously,40 and to a smaller extent, a higher amount of land and water required to meet a given carbon removal target.
6 Discussion
In this analysis, we found that BECCS ElROI is highly variable depending on the feedstock and region of import scenarios considered, with values be as low as 0.5 and as high as 5.7. While lower bounds values are therefore energy negative (EROI below unity), upper bounds values were found in the range of solar PV. They remain however lower than the ElROI of coal fired electricity, which was evaluated in the 12–24 range in Raugei et al.17 However, adding CCS to coal electricity could substantially lower the ElROI of coal electricity.20 This would mean that, in some scenarios, BECCS would be competitive with other low-carbon energy technologies, whilst also providing the additional service of atmospheric carbon dioxide removal. Though careful management of BECCS value chain can potentially lead to competitive ElROI values, scenarios with low ElROI could also be a reality. This would have several socio-economic implications. As observed by Hall et al.,15 biofuels with EROI values below 3![[thin space (1/6-em)]](https://www.rsc.org/images/entities/char_2009.gif) :
:![[thin space (1/6-em)]](https://www.rsc.org/images/entities/char_2009.gif) 1 might need to be subsidised by fossil fuels, in the sense that their deployment would rely on the energy viability of fossil fuels, in order to provide value to the energy system. This would mean that BECCS scenarios for which more energy is consumed than electricity is produced, could lead to an increase in fossil fuel use. This could threaten world energy security, as well as BECCS' carbon removal potential, as an increase in fossil fuel CO2 emissions could offset the negative emissions provided by BECCS. However, the implication may be nuanced when considering BECCS might not be solely deployed in the purpose of generating power, but also, and primarily, to remove CO2 from the atmosphere. In a previous contribution,40 it is shown that, providing a negative emissions credit is available to the operator of the BECCS facility, it is more profitable for a BECCS power plant to operate on a base-load fashion, therefore removing CO2 constantly, and dispatching power on the electricity grid on a load following basis. This underlines that BECCS' service of CO2 removal, could be more important than energy generation. It is also important to highlight that there are important trade-offs between carbon removal and power generation. As noted by Mac Dowell and Fajardy40 and Bui et al.13 less efficient power plant remove more CO2 per year or per MW he generated than their more efficient counterparts. This was also observed in this analysis, as increasing BECCS efficiency improved BECCS net electricity balance and ElROI, hence its value to the energy system, but also resulted in a decrease in the amount of CO2 removed per facility per year, hence in a larger BECCS fleet required to meet an annual carbon removal target. To a smaller extent, resource mobilisation – land and water – also increased. Consequently, from an investment perspective, and depending on the source of the investment – negative emissions or energy sector – BECCS ElROI might be less important than for other power generation technologies. To put BECCS net electricity balance in perspective, Direct Air Capture (DAC), another option for carbon dioxide removal, could require between 335 and 1135 PJ per year to remove 50 MtCO2 per year,41–43 which is still 5 to 17 times higher than BECCS energy requirement when deployed with willow from Louisiana.
1 might need to be subsidised by fossil fuels, in the sense that their deployment would rely on the energy viability of fossil fuels, in order to provide value to the energy system. This would mean that BECCS scenarios for which more energy is consumed than electricity is produced, could lead to an increase in fossil fuel use. This could threaten world energy security, as well as BECCS' carbon removal potential, as an increase in fossil fuel CO2 emissions could offset the negative emissions provided by BECCS. However, the implication may be nuanced when considering BECCS might not be solely deployed in the purpose of generating power, but also, and primarily, to remove CO2 from the atmosphere. In a previous contribution,40 it is shown that, providing a negative emissions credit is available to the operator of the BECCS facility, it is more profitable for a BECCS power plant to operate on a base-load fashion, therefore removing CO2 constantly, and dispatching power on the electricity grid on a load following basis. This underlines that BECCS' service of CO2 removal, could be more important than energy generation. It is also important to highlight that there are important trade-offs between carbon removal and power generation. As noted by Mac Dowell and Fajardy40 and Bui et al.13 less efficient power plant remove more CO2 per year or per MW he generated than their more efficient counterparts. This was also observed in this analysis, as increasing BECCS efficiency improved BECCS net electricity balance and ElROI, hence its value to the energy system, but also resulted in a decrease in the amount of CO2 removed per facility per year, hence in a larger BECCS fleet required to meet an annual carbon removal target. To a smaller extent, resource mobilisation – land and water – also increased. Consequently, from an investment perspective, and depending on the source of the investment – negative emissions or energy sector – BECCS ElROI might be less important than for other power generation technologies. To put BECCS net electricity balance in perspective, Direct Air Capture (DAC), another option for carbon dioxide removal, could require between 335 and 1135 PJ per year to remove 50 MtCO2 per year,41–43 which is still 5 to 17 times higher than BECCS energy requirement when deployed with willow from Louisiana.
7 Conclusion
We found that BECCS dynamic ElROI profile is strongly case specific. Depending on the scenario, we found that lifetime ElROI values could be found within the range of 0.5–5.7. This means that BECCS electricity could be equally of “negative value” to the energy system – negative energy balance – as well as competitive with PV and decarbonised thermal power plants (coal or gas with carbon capture and storage). Large-scale deployment of low ElROI scenarios without due consideration of this nuance could represent a risk to both energy security and carbon dioxide removal, with a potential increase of fossil fuel use, and subsequent CO2 emissions, to compensate for BECCS net electricity negativity. Given that we have shown that BECCS can be both carbon positive and negative and both energy positive and negative, the scope for unintended consequences is vast.This contribution also highlighted the main energy losses along BECCS value chain: biomass conversion and CCS, followed by transport (road), drying, and farming (including inputs) represented over 80% of the energy losses for high moisture and low yield biomass such as willow pellets. Power plant efficiency, fuel efficiency for transport, transport distance, moisture content, drying method, as well as yield were thus identified as key parameters that need to be carefully controlled to maximise BECCS net electricity balance. There are also important trade-offs between these levers. In most cases, a greater travel distance from a region naturally resulted in a higher cumulative energy demand of the value chain, therefore decreasing the EROI and ElROI. However, it was found that greater travel distances could almost be compensated for by a reduction in energy requirement for farming, when importing biomass from a region with superior yield. In summary, given the manifold contributions which determine the net energy balance of BECCS, it is important to resist the temptation to draw broad, general conclusions from a potentially narrow range of specific case studies.
Finally, we found that improving BECCS power generation efficiency could drastically reduce BECCS energy losses, but would also increase the amount of BECCS installed capacity required to meet an annual carbon removal target, and thus the financial cost associated with meeting that target. There is therefore a clear trade-off between BECCS annual carbon removal potential and power generation, and consequently between BECCS annual carbon removal potential and ElROI. As BECCS uniquely has the potential to provide both carbon removal and electricity, a lower ElROI could thus be compensated by a higher annual carbon removal, and vice versa. BECCS value to the system, as well as optimal deployment pathway, will therefore strongly depend on the nature of the service for which BECCS is primarily deployed, carbon removal or power generation.
Conflicts of interest
There are no conflicts to declare.Appendices
A. Energy model input data
| Parameter | Unit | Domestic biomass | Imported biomass | Ref. |
|---|---|---|---|---|
| a For complete model data and references, refer to Fajardy and Mac Dowell, 2017.10 | ||||
| Willow yield | tDM per ha per year | 4–17 (9) | 5.1 | 10 |
| Switchgrass yield | tDM per ha per year | 11–15 (13) | 7.4–12.6 (10.8) | 10 |
| Miscanthus yield | tDM per ha per year | 5–24.1 (12.8) | 28.1 | 10 |
| Wheat straw yield | tDM per ha per year | 4.3–15.7 (9.4) | 1.9–6.4 (4.1) | 10 |
| Electricity carbon footprint | kgCO2 per MJ | 135–162 (149) | 149 | 10, 44 and 45 |
| η grid | % | 44 | 37 | 35 |
| ECToPE(electricity) | MJ per MJ | 2.27 | 2.70 | Own calculation |
| PEToEl(diesel) | % | 20–45 (35) | 20–45 (35) | 35 |
| PEToEl(natural gas) | % | 39–58 (52) | 39–58 (43) | 34 and 35 |
| PEToEl(fuel oil) | % | 29–44 (29) | 35–44 (35) | 34 and 35 |
| Road distance (truck) | km | 50 | 300 | Own calculation |
| Ship distance (ship) | km | 0 | 9045 | Own calculation |
| Road tortuosity | — | 1.4 | 1.1 | Own calculation |
B. Cumulative energy demand
Acknowledgements
The authors thank Imperial College London for the funding of a President's PhD Scholarship, as well as the Greenhouse Gas Removal (GGR) grant, funded by the Natural Environment Research Council (NERC), under grant NE/P019900/1.References
- UNEP, The Emissions Gap Report, 2017, available at https://wedocs.unep.org/bitstream/handle/20.500.11822/22070/EGR_2017.pdf.
- J. Kemper, Int. J. Greenhouse Gas Control, 2015, 40, 401–430 CrossRef CAS.
- C. Gough and P. Upham, Biomass energy with carbon capture and storage (BECCS): a review, 2010, available at http://www.tyndall.ac.uk/publications/tyndall-working-paper/2010/biomass-energy-carbon-capture-and-storage-beccs-review.
- F. Kraxner, S. Nilsson and M. Obersteiner, Biomass Bioenergy, 2003, 24, 285–296 CrossRef CAS.
- S. Fuss, J. G. Canadell, G. P. Peters, M. Tavoni, R. M. Andrew, P. Ciais, R. B. Jackson, C. D. Jones, F. Kraxner, N. Nakicenovic, C. Le Quéré, M. R. Raupach, A. Sharifi, P. Smith and Y. Yamagata, Nat. Clim. Change, 2014, 4, 850–853 CrossRef CAS.
- C. Azar, K. Lindgren, M. Obersteiner, K. Riahi, D. P. van Vuuren, K. M. J. den Elzen, K. Möllersten and E. D. Larson, Clim. Change, 2010, 100, 195–202 CrossRef CAS.
- D. P. van Vuuren, S. Deetman, J. van Vliet, M. van den Berg, B. J. van Ruijven and B. Koelbl, Clim. Change, 2013, 118, 15–27 CrossRef.
- N. Vaughan and C. Gough, Environ. Res. Lett., 2016, 11, 095003 CrossRef.
- P. Smith, S. J. Davis, F. Creutzig, S. Fuss, J. Minx, B. Gabrielle, E. Kato, R. B. Jackson, A. Cowie, E. Kriegler, D. P. van Vuuren, J. Rogelj, P. Ciais, J. Milne, J. G. Canadell, D. McCollum, G. Peters, R. Andrew, V. Krey, G. Shrestha, P. Friedlingstein, T. Gasser, A. Grubler, W. K. Heidug, M. Jonas, C. D. Jones, F. Kraxner, E. Littleton, J. Lowe, J. R. Moreira, N. Nakicenovic, M. Obersteiner, A. Patwardhan, M. Rogner, E. Rubin, A. Sharifi, A. Torvanger, Y. Yamagata, J. Edmonds and C. Yongsung, Nat. Clim. Change, 2016, 6, 42–50 CrossRef CAS.
- M. Fajardy and N. Mac Dowell, Energy Environ. Sci., 2017, 10, 1389–1426 CAS.
- K. Anderson and G. Peters, Science, 2016, 354, 182–183 CrossRef CAS PubMed.
- B. E. Dale, J. E. Anderson, R. C. Brown, S. Csonka, V. H. Dale, G. Herwick, R. D. Jackson, N. Jordan, S. Ka, K. L. Kline, L. R. Lynd, C. Malmstrom, R. G. Ong, T. L. Richard, C. Taylor and M. Q. Wang, Environ. Sci. Technol., 2014, 48, 7200–7203 CrossRef CAS PubMed.
- M. Bui, M. Fajardy and N. Mac Dowell, Appl. Energy, 2017, 195, 289–302 CrossRef CAS.
- P. Moriarty and D. Honnery, AIMS Energy, 2016, 5, 20–38 CrossRef.
- C. Hall, S. Balogh and D. Murphy, Energies, 2009, 2, 25–47 CrossRef.
- D. J. Murphy, C. A. S. Hall, M. Dale and C. Cleveland, Sustainability, 2011, 3, 1888–1907 CrossRef.
- M. Raugei, P. Fullana-i Palmer and V. Fthenakis, Energy Policy, 2012, 45, 576–582 CrossRef.
- A. L. Stephenson and D. J. MacKay, Life Cycle Impacts of Biomass Electricity in 2020, Department of Energy and Climate Change technical report, 2014.
- M. Dale and S. M. Benson, Environ. Sci. Technol., 2013, 47, 3482–3489 CrossRef CAS PubMed.
- C. A. S. Hall, J. G. Lambert and S. B. Balogh, Energy Policy, 2014, 64, 141–152 CrossRef.
- G. G. T. Camargo, M. R. Ryan and T. L. Richard, BioScience, 2013, 63, 263–273 CrossRef.
- A. Grzybek, Modelling of biomass utilisation for energy purpose, 2010 Search PubMed.
- I. Lewandowski, A. Kicherer and P. Vonier, Biomass Bioenergy, 1995, 8, 81–90 CrossRef CAS.
- F. Murphy, G. Devlin and K. McDonnell, Renewable Sustainable Energy Rev., 2013, 23, 412–420 CrossRef.
- B. Kalita, PhD thesis, University of Guelph, 2012.
- X. Lu, M. R. Withers, N. Seifkar, R. P. Field, S. R. H. Barrett and H. J. Herzog, Bioresour. Technol., 2015, 183, 1–9 CrossRef CAS PubMed.
- X. Qin, T. Mohan, M. El-Halwagi, G. Cornforth and B. A. McCarl, Clean Technol. Environ. Policy, 2006, 8, 233–249 CrossRef CAS.
- P. Börjesson, Biomass Bioenergy, 1996, 11, 305–318 CrossRef.
- S. Njakou Djomo, O. El Kasmioui, T. De Groote, L. S. Broeckx, M. S. Verlinden, G. Berhongaray, R. Fichot, D. Zona, S. Y. Dillen, J. S. King, I. A. Janssens and R. Ceulemans, Appl. Energy, 2013, 111, 862–870 CrossRef CAS.
- R. Ehrig, PhD thesis, Technical University (TU) Berlin, 2014.
- V. Forgie and R. Andrew, Life Cycle Assessment of Using Straw to Produce Industrial Energy in New Zealand, Landcare research and new zealand centre for ecological economics technical report, 2008.
- M. Elsayed, R. Matthews and N. Mortimer, Carbon and energy balances for a range of biofuels options, Resources Research Unit, Sheffield Hallam University technical report, 2003.
- CCC, UK climate change following the Paris Agreement, Committee on Climate Change technical report, 2016.
- EURELECTRIC, Efficiency in Electricity Generation, 2003, available at http://dx.doi.org/10.1016/j.watres.2009.01.036.
- IEA, Energy Efficiency Indicators for Public Electricity Production from Fossil Fuels, 2008, available at https://www.iea.org/publications/freepublications/publication/En_Efficiency_Indicators.pdf.
- DRAX GROUP plc, Drax annual report and accounts: A reliable, renewable future, today the way in the generation, 2015, available at http://asp-gb.secure-zone.net/v2/index.jsp?id=666/3685/10863&lng=en.
- The UK 2050 Calculator, DECC, http://2050-calculator-tool.decc.gov.uk/#/home, accessed 2017.
- FAOSTAT, http://www.fao.org/faostat/en/#home, accessed 2017.
- Digest of UK Energy Statistics (DUKES), Renewable sources of energy, 2017, available at https://www.gov.uk/government/uploads/system/uploads/attachment_data/file/633782/Chapter_6.pdf.
- N. M. Dowell and M. Fajardy, Environ. Res. Lett., 2017, 12, 045004 CrossRef.
- R. Baciocchi, G. Storti and M. Mazzotti, Chem. Eng. Process., 2006, 45, 1047–1058 CrossRef CAS.
- M. Ranjan and H. J. Herzog, Energy Procedia, 2011, 4, 2869–2876 CrossRef CAS.
- K. S. Lackner, Energy, 2013, 50, 38–46 CrossRef CAS.
- A. Moro and L. Lonza, Transportation Research Part D: Transport and Environment, 2017 Search PubMed.
- Ecometrica, Electricity-specific emission factors for grid electricity, available at https://ecometrica.com/assets/Electricity-specific-emission-factors-for-grid-electricity.pdf.
| This journal is © The Royal Society of Chemistry 2018 |

