 Open Access Article
Creative Commons Attribution 3.0 Unported Licence
Towards the best total consumption infrared-heated sample introduction system for nanoparticle measurement using single particle inductively coupled plasma mass spectrometry†
Zichao Zhoua,
Mirah J. Burgenerb,
John Burgenerc and
Diane Beauchemin *a
*a
aDepartment of Chemistry, Queen's University, Kingston, ON K7L 3N6, Canada. E-mail: diane.beauchemin@queensu.ca; Fax: +1-613-533-6669; Tel: +1-613-533-2619
bBurgener Research Inc., 9710 Second Street, Unit #103, Sidney, BC V8L 3C4, Canada
cBurgener Research Inc., 1680 Lakeshore Road West, Unit #2, Mississauga, ON L5J 1J5, Canada
First published on 4th July 2024
Abstract
Nanoparticles (NPs) are ubiquitous because they find applications in nanomedicine, materials science, and consumer products to name a few, and eventually end up in the environment. The various techniques available to analyze NPs each have strengths and limitations. This study focuses on improving the single particle inductively coupled plasma mass spectrometry (spICPMS) technique to address the limitations of existing methods and improve the size detection limit for Pt and Au NPs. Infrared heating of the spray chamber and connection to the torch is used to pre-evaporate the aerosol and improve the transport efficiency. Eight modified cyclonic spray chambers with a volume ranging from 25 to 125 mL, where an IR emitter is inserted in a modified baffle and the gap between the top of the baffle and the top service of the spray chamber was varied, are tested for the characterization of NPs to see their effect on sensitivity, detection limit, and transport efficiency. The results indicate that the 50 mL modified spray chamber with a 2 mm gap between the top of the baffle and the top service of the spray chamber offers the best detection limit for Pt. It enhances sensitivity and precision and allows accurate characterization of Au and Pt NPs without any measurement of the transport efficiency. Furthermore, this sample introduction system provided similar improvements in sensitivity and detection limit when used with the same nebulizer on two different spICPMS instruments.
Introduction
Nanoparticles (NPs), which measure less than 100 nm in size,1 have become ubiquitous because they possess unique properties that make them important in various industries. For instance, they find applications in nanomedicine, materials science, and consumer products to name a few. Because they eventually end up in the environment,2–5 risk assessment requires knowledge of NPs characteristics, including size, composition, number concentration, and surface properties.To characterize NPs, several techniques can be used, including dynamic light scattering, transmission electron microscopy (TEM) and atomic force microscopy.6–8 However, they are not without limitations.9 Many of them are primarily ensemble methods, averaging the characteristics of a large population of NPs. Some of them have inadequate sensitivity when applied to environmental systems.10,11 Additionally, they often require sample preparation steps that can introduce contamination and potentially alter NPs. For example, ferromagnetic Ni NPs have been noted to spontaneously agglomerate in the vacuum environment of TEM.12 In contrast, inductively coupled plasma mass spectrometry (ICPMS) in single particle mode (called spICPMS) readily allows the sensitive and element-specific measurement of NPs individually in solution.
In fact, spICPMS can measure the mass (and the size if characteristics like density, shape, and composition are known) and quantify the concentration of suspended NPs, in addition to simultaneously determining the concentration of dissolved analytes.13,14 Its application to a variety of samples has been the subject of a comprehensive review.15 The detection of the smallest NPs highly depends on the sensitivity and detection limit (DL) of ICPMS. Consequently, techniques employed to enhance the DL in solution analysis via ICPMS may also be useful for spICPMS.16 Indeed, experimental conditions have a substantial impact on the resulting NPs signals,17 especially the sample introduction system,18 which must be carefully designed and optimized to ensure the reliability, efficiency, and accuracy of the measurements.
However, a NPs suspension is usually introduced with a conventional pneumatic sample introduction system in spICPMS, where only 5–10% of the nebulized aerosol reaches the plasma, the rest draining down to waste.19 Such low transport efficiency limits sensitivity and DL. As a result, the transport efficiency must be measured in addition to the sample uptake rate in spICPMS to enable accurate measurement of NPs mass, size and concentration. However, transport efficiency is difficult to determine in the absence of certified reference NPs matching those in samples. Coupling flow injection12 or monosegmented flow analysis20 to spICPMS eliminates the requirements to determine the transport efficiency and the sample uptake rate for measurement of the mass, and thus size, of NPs. Similarly, integrating the signal instead of averaging it in spICPMS21 eliminates the need to measure the transport efficiency when determining NPs mass and size. However, determination of NPs concentration still requires measurement of the transport efficiency. The requirement to measure the transport efficiency for determination of NPs concentration would vanish with an approach providing 100% transport efficiency.
The heated torch-integrated sample introduction system (hTISIS) has successfully achieved total sample consumption and enhanced sensitivity in ICPMS,22 but the micro-nebulizer used with the hTISIS is susceptible to blockage when dealing with samples containing high salt concentrations. A microdroplet generator, employed in spICPMS also provides 100% transport efficiency,23 but it generates a dry aerosol, which adversely affects plasma ionization by removing water.24 To enhance transport efficiency while mitigating noise attributed to droplet desolvation in the plasma, an alternative approach involves infrared (IR) heating to pre-evaporate the aerosol before its introduction into the plasma.25,26 In spICPMS, a 50 mL cyclonic spray chamber was modified to enable the insertion of an IR emitter within a modified baffle, with a 2 mm gap between the top of the baffle and the top service of the spray chamber; at 50 μL min−1 sample uptake rate and 110 °C IR heating temperature, essentially total consumption was achieved, which translated into 5-fold improvements in sensitivity and solution DL.26 However, difficulty with heating the torch base located within the torch box increased the noise level, resulting in only a 2-fold improvement in size DL.
Building upon prior research, the aim of this study was to perform a comprehensive optimization of an IR-heated sample introduction system. To this end, eight modified cyclonic spray chambers, with varying volumes and dimensions, were compared with the objective to improve the size DL for Pt and Au. The most efficient configuration was subsequently employed for the analysis of certified suspensions of Au and Pt NPs using two different ICPMS instruments, including one where the base of the torch could be directly heated.
Experimental
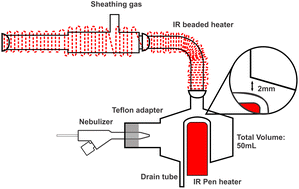 | ||
| Fig. 1 Schematic diagram of the IR-heated sample introduction system with a “50-2 mm” modified cyclonic spray chamber. | ||
To heat each of the 8 chambers, a ceramic rod IR heater with an integrated thermocouple (Elstein-Werk, Northeim, Germany) was inserted into the modified baffle. To prevent condensation between the spray chamber and the base of the torch, a ceramic beaded rope IR heater (Marsh Beaded Heaters, Normangee, TX, USA) was wrapped around the sheathing device and elbow connection. Temperature control was achieved by the thermocouple with pen heater and a thermocouple inserted under the IR rope heater, which were regulated using two identical Digi Toll II temperature controllers (GLAS-COL Apparatus Company, Terre Haute, USA). The entire system was enveloped with glass-fiber heat insulating tape and aluminum foil to ensure consistent heating and minimize heat loss. For reference, a Scott double-pass spray chamber (SCP Science, Baie d'Urfé, QC, Canada) was employed.
To evaluate the performance of the total consumption sample introduction system for spICPMS in time-resolve mode, a NexION 2000 ICPMS instrument (PerkinElmer, Waltham, Massachusetts, United States) was also used. In contrast to the Varian 820MS instrument, the torch base is outside the torch box and can be heated to prevent condensation. The L-shaped elbow was thus directly connected to the base of the torch (without any sheathing device). A custom-made ball joint torch connector was made from an open-end male ball joint and a Teflon sleeve. The operating conditions are summarized in Table 1. The standard sample introduction system used on the NexION 2000 instrument for reference consisted of a PFA 260 nebulizer and a glass cyclonic C3 high sensitivity spray chamber with matrix gas port. The nebulizer gas flow rate in Table 1 resulted from optimization using the standard sample introduction system on each instrument.
| Parameter | Varian 820MS | NexION 2000 |
|---|---|---|
| Ar plasma gas flow rate (L min−1) | 18.0 | 15.0 |
| Ar auxiliary gas flow rate (L min−1) | 1.80 | 1.20 |
| Ar sheath gas flow rate (L min−1) | 0.20 | — |
| Ar nebulizer gas flow rate (L min−1) | 0.90 | 1.00 |
| RF power (kW) | 1.30 | 1.60 |
| Dwell time (ms) | 5 | 0.05 |
| Monitored signal | 195Pt+ or 197Au+ | |
![[thin space (1/6-em)]](https://www.rsc.org/images/entities/char_2009.gif) 000 mg L−1 Pt standard solutions (SCP Science, Baie d'Urfé, QC, Canada), sub-boiled HNO3 and doubly deionized water (DDW) (18.2 MΩ cm). A 5 ng mL−1 multielement tunning solution was prepared from ICPMS stock tunning solution, sub-boiled HNO3 and DDW. A DST-1000 sub-boiling distillation system (Savillex, Minnetonka, MN, USA) was used to purify HNO3 (ACS grade; Fisher Scientific, Ottawa, ON, Canada). For validation, two suspensions of reference NPs were used: Au NPs in water (99.99% purity; diameter of 60.6 ± 5.9 nm) with a concentration of 50 mg mL−1 and bare Pt NPs in water (99.99% purity; diameter of 50 ± 4 nm) purchased from nanoComposix (San Diego, CA, USA). These NPs were stabilized in citrate buffer and have a near spherical geometry. Certified NP suspensions were diluted to 100
000 mg L−1 Pt standard solutions (SCP Science, Baie d'Urfé, QC, Canada), sub-boiled HNO3 and doubly deionized water (DDW) (18.2 MΩ cm). A 5 ng mL−1 multielement tunning solution was prepared from ICPMS stock tunning solution, sub-boiled HNO3 and DDW. A DST-1000 sub-boiling distillation system (Savillex, Minnetonka, MN, USA) was used to purify HNO3 (ACS grade; Fisher Scientific, Ottawa, ON, Canada). For validation, two suspensions of reference NPs were used: Au NPs in water (99.99% purity; diameter of 60.6 ± 5.9 nm) with a concentration of 50 mg mL−1 and bare Pt NPs in water (99.99% purity; diameter of 50 ± 4 nm) purchased from nanoComposix (San Diego, CA, USA). These NPs were stabilized in citrate buffer and have a near spherical geometry. Certified NP suspensions were diluted to 100![[thin space (1/6-em)]](https://www.rsc.org/images/entities/char_2009.gif) 000 particles mL−1 with DDW to ensure that each droplet produced during nebulization would contain at the most one NP. To avoid NP dissolution and aggregation, dilution was performed on the day of the analysis followed by sonication for 10 min prior to analysis.
000 particles mL−1 with DDW to ensure that each droplet produced during nebulization would contain at the most one NP. To avoid NP dissolution and aggregation, dilution was performed on the day of the analysis followed by sonication for 10 min prior to analysis.Measurement of the transport efficiency required a correction for the significant settling time of the Varian 820MS instrument,21 which necessitated approximately 27 ms on average for data transfer following each dwell time, even when monitoring a single mass-to-charge ratio. To account for this time during which no NP could be measured, the calculated transport efficiency was adjusted by multiplying it by the fraction of the total acquisition time during which actual measurements were taken (i.e. by 5/(5 + 27)). The method size DL was determined using a suspension of NPs, based on three times the standard deviation of the background signals left after removing the signals generated by NPs.
Results
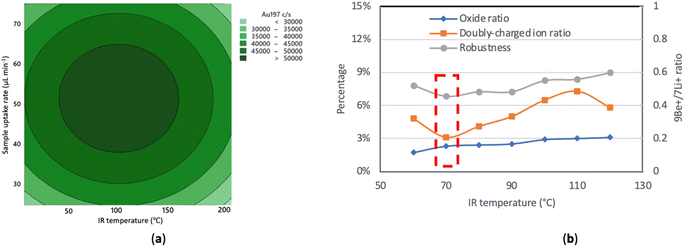 | ||
| Fig. 2 Results of optimizations for 25-2 mm MC (a) Contour plot of blank-subtracted signal intensity for 5 μg L−1 Au vs. sample uptake rate and IR heating temperature; (b) oxide ratio, doubly charged ion ratio and robustness (Be+/Li+ signal ratio)27 at different IR heating temperatures while other parameters were held constant. The optimum temperature is indicated by the dashed red box. | ||
In a second optimization aiming to find the best compromise in terms of plasma robustness, doubly charged ion ratio, oxide ratio, and transport efficiency, the IR heating temperature was increased in 10 °C increments from 60 to 150 °C, with the sample uptake rate held constant at 50 μL min−1 (Fig. 2b). The 9Be+/7Li+ ratio was reported to be comparable to the Mg II 280.270 nm/Mg I 285.213 nm ratio in ICP optical emission spectrometry because Be and Li have similar atomic masses but different first ionization potentials so that the 9Be+/7Li+ ratio is sensitive to plasma conditions while not being strongly affected by space charge effects occurring in the ion optics of the mass spectrometer.27 Robust plasma conditions, with a 9Be+/7Li+ ratio of at least 0.30, were achieved over the range of IR heating temperatures tested with the 25-2 mm MC. In this example, 70 °C maximized sensitivity and robustness while keeping the oxide and doubly-charged ion levels around and under 3%, respectively, but did not quite result in total consumption with the Varian 820MS. The apparent discrepancy stems from sensitivity being measured with solutions whereas the transport efficiency was measured with a suspension of NPs. Given that total consumption was achieved with the 25-2 mm MC IR-heated at 70 °C when it was directly connected to the base of the torch on the NexION instrument (see Table 5), NPs likely deposited through aerosol condensation in the unheated region between the sheathing device and the torch inside the torch box of the Varian 820MS instrument.
| Spray chamber | Double-pass | 25-2 mm MC | 50-2 mm MC | 75-2 mm MC | 125-2 mm MC |
|---|---|---|---|---|---|
| IR temperature (°C) | 20 | 70 | 110 | 120 | 150 |
| Sample uptake rate (μL min−1) | 1000 | 50.0 ± 5.0 | 50.0 ± 5.0 | 50.0 ± 5.0 | 50.0 ± 5.0 |
| Transport efficiency (%) | 8.1 ± 3.4 | 86.3 ± 6.4 | 102.2 ± 5.4 | 98.2 ± 7.4 | 65.2 ± 6.4 |
| 195Pt sensitivity (counts s−1 μg−1) | 2.66 × 10¹⁰ | 2.72 × 10¹¹ | 1.56 × 10¹¹ | 1.16 × 10¹¹ | 1.03 × 10¹¹ |
| 197Au sensitivity (counts s−1 μg−1) | 3.23 × 10¹⁰ | 4.27 × 10¹¹ | 2.27 × 10¹¹ | 1.24 × 10¹¹ | 1.36 × 10¹¹ |
| 195Pt solution DL (ng L−1) | 12 | 3.6 | 1.7 | 8.1 | 18 |
| 197Au solution DL (ng L−1) | 11 | 2.3 | 2.6 | 7.9 | 14 |
| 195Pt method size DL (nm) | 22 | 11 | 5.9 | 14 | 39 |
| 197Au method size DL (nm) | 22 | 7.6 | 8.6 | 16 | 29 |
| 9Be+/7Li+ | 0.28 | 0.46 | 0.33 | 0.22 | 0.24 |
| 140Ce16O+/140Ce+ | 1.5% | 3.1% | 4.8% | 1.4% | 2.5% |
| 138Ba++/138Ba+ | 0.5% | 2.3% | 0.7% | 3.3% | 3.4% |
| Spray chamber | Transport efficiency (%) | Spray chamber | Transport efficiency (%) |
|---|---|---|---|
| Scott double-pass | 14.7 ± 1.7 | 75–2 MC | 10.1 ± 1.9 |
| 25–2 MC | 26.0 ± 5.6 | 75–4 MC | 11.4 ± 2.1 |
| 50–2 MC | 24.9 ± 2.6 | 75–6 MC | 10.0 ± 2.8 |
| 50–4 MC | 20.1 ± 3.5 | 125–2 MC | 4.6 ± 3.1 |
| 50–6 MC | 23.5 ± 3.1 |
Compared to the unheated double-pass spray chamber, the 75-2 mm MC increased sensitivity but did not significantly improve the solution and method DLs, whereas the 125-2 mm MC improved the sensitivity and degraded DLs. As the volume of the spray chamber increased, the optimal IR heating temperature also increased under the otherwise constant operating conditions in Table 1. The size of the IR heater being constant, there might be a temperature gradient between the center of the baffle and the outer shell of the spray chamber without increasing the temperature. This was verified using thermocouples placed in the baffle and on the outer surface of the spray chamber. For example, when the inner baffle of the 50-2 mm MC (with the operating conditions in Table 1 and a sample uptake rate of 50 μL min−1) was heated to 110 °C, the outer surface was 88 °C. Such temperature gradient increased as the spray chamber volume increased.
Another difference between the spray chambers is that the distance between the nebulizer tip and the central baffle increased as the spray chamber volume increased, from 1.3 cm with the 25-2 mm MC to 3.8 cm with the 125-2 mm MC. This likely affected the droplet size distribution of the secondary aerosol that experiences IR heating, in turn affecting the extent of pre-evaporation. A temperature gradient combined to sub-optimal positioning of the nebulizer may thus explain differences in sensitivity and transport efficiency between spray chambers, such as why the 125 mL MC yielded a lower sensitivity and transport efficiency than the 50 mL and 75 mL ones. Future work will investigate the effect of IR heating the top of the spray chamber in addition to having an IR emitter within the baffle. As well, the design of each spray chamber will be modified to allow optimal positioning of the nebulizer.
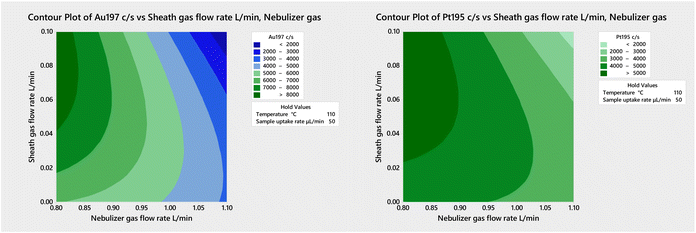
The results in Table 2 were obtained under plasma conditions optimized using the standard sample introduction system with the same nebulizer. However, a preliminary multivariate optimization of the sheath gas flow rate and of the nebulizer gas flow rate with the 50-2 mm MC IR-heated at 110 °C and a sample uptake rate of 50 μL min−1 (Fig. 3) revealed that higher sensitivity would result using a nebulizer gas flow rate of 0.8–0.85 L min−1 (instead of the 0.9 L min−1 used in this work) and a sheath gas flow rate of 0.07–0.08 L min−1 (which is substantially lower than the 0.2 L min−1 used in this work). Further improvements in sensitivity and detection limit are thus likely under thoroughly optimized conditions. Hence, future work will also include multivariate optimization of the nebulizer gas flow rate, sheathing gas flow rate, sampling position and IR temperature with each spray chamber to achieve the best possible balance between sensitivity, detection limits, and plasma robustness.
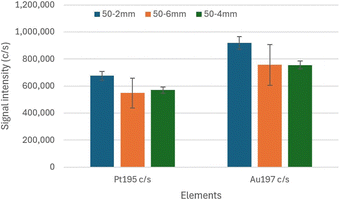
In any case, even under plasma conditions optimized with the standard sample introduction system, the 25-2 mm MC, 50-2 mm MC and 75-2 mm MC improved the solution and method size DLs compared to those obtained with a double-pass spray chamber. With the 50-2 mm MC, the lowest size DL resulted for Pt, with similar size DL as with the 25-2 mm MC for Au. The 50-2 mm MC thus provides total consumption while improving sensitivity and DLs. Compared to the results previously obtained with the 50-2 mm MC also IR-heated to 110 °C and operated at a sample uptake rate of 50 μL min−1,26 a greater improvement in size DLs was achieved in this work because of the insulating tape that was wrapped around the elbow connection under the aluminum foil. (Only aluminum foil was employed in the previous study.) The 50-2 mm MC also leads to robust conditions and low doubly-charged ion level, with a concurrent increase in oxide level however. This is surprising, as robust conditions typically correspond to a hotter plasma, which normally translates into lower oxide level and increased doubly-charged ion level. Investigation of this apparent discrepancy will be the subject of future work. Nonetheless, as the 3–4 fold improvement in size DL does not match the 6–7 fold increase in sensitivity, further improvement is possible. This may be possible with the NexION 2000 because the torch base is outside the torch box and can be heated, which is not the case with the Varian 820MS.
| Instrument | Spray chamber | Mean Au NP measured size (nm) | Particle number concentration (mL−1) | Mean Pt NP measured size (nm) | Particle number concentration (mL−1) |
|---|---|---|---|---|---|
| Varian 820MS | 25-2 mm MC IR-heated at 70 °C | 58 ± 10 | 99![[thin space (1/6-em)]](https://www.rsc.org/images/entities/char_2009.gif) 000 ± 11 000 ± 11![[thin space (1/6-em)]](https://www.rsc.org/images/entities/char_2009.gif) 000 000 |
49 ± 10 | 92![[thin space (1/6-em)]](https://www.rsc.org/images/entities/char_2009.gif) 300 ± 6700 300 ± 6700 |
| 50-2 mm MC IR-heated at 110 °C | 60 ± 11 | 109![[thin space (1/6-em)]](https://www.rsc.org/images/entities/char_2009.gif) 600 ± 7500 600 ± 7500 |
52 ± 11 | 93![[thin space (1/6-em)]](https://www.rsc.org/images/entities/char_2009.gif) 400 ± 6700 400 ± 6700 |
|
| 75-2 mm MC IR-heated at 120 °C | 58 ± 11 | 94![[thin space (1/6-em)]](https://www.rsc.org/images/entities/char_2009.gif) 400 ± 5800 400 ± 5800 |
49 ± 10 | 99![[thin space (1/6-em)]](https://www.rsc.org/images/entities/char_2009.gif) 200 ± 5900 200 ± 5900 |
|
| Scott double-pass | 55 ± 12 | 101![[thin space (1/6-em)]](https://www.rsc.org/images/entities/char_2009.gif) 700 ± 5900 700 ± 5900 |
49 ± 9 | 99![[thin space (1/6-em)]](https://www.rsc.org/images/entities/char_2009.gif) 000 ± 5000 000 ± 5000 |
|
| NexION 2000 | 25-2 mm MC IR-heated at 70 °C | 65 ± 11 | 92![[thin space (1/6-em)]](https://www.rsc.org/images/entities/char_2009.gif) 300 ± 5500 300 ± 5500 |
47 ± 9 | 97![[thin space (1/6-em)]](https://www.rsc.org/images/entities/char_2009.gif) 800 ± 9700 800 ± 9700 |
| 50-2 mm MC IR-heated at 110 °C | 69 ± 10 | 109![[thin space (1/6-em)]](https://www.rsc.org/images/entities/char_2009.gif) 600 ± 7500 600 ± 7500 |
55 ± 7 | 102![[thin space (1/6-em)]](https://www.rsc.org/images/entities/char_2009.gif) 800 ± 5700 800 ± 5700 |
|
| 75-2 mm MC IR-heated at 120 °C | 62 ± 19 | 94![[thin space (1/6-em)]](https://www.rsc.org/images/entities/char_2009.gif) 500 ± 7800 500 ± 7800 |
59 ± 11 | 99![[thin space (1/6-em)]](https://www.rsc.org/images/entities/char_2009.gif) 200 ± 8900 200 ± 8900 |
|
| Cyclonic | 65 ± 8 | 95![[thin space (1/6-em)]](https://www.rsc.org/images/entities/char_2009.gif) 200 ± 6900 200 ± 6900 |
52 ± 5 | 103![[thin space (1/6-em)]](https://www.rsc.org/images/entities/char_2009.gif) 400 ± 5900 400 ± 5900 |
|
| Reference value | 60.6 ± 5.9 | 100![[thin space (1/6-em)]](https://www.rsc.org/images/entities/char_2009.gif) 000 000 |
50 ± 4 | 100![[thin space (1/6-em)]](https://www.rsc.org/images/entities/char_2009.gif) 000 000 |
| Spray chamber | Cyclonic | 25-2 mm MC | 50-2 mm MC | 75-2 mm MC |
|---|---|---|---|---|
| IR temperature (°C) | 20 | 70 | 110 | 120 |
| Sample uptake rate (μL min−1) | 600 ± 23 | 50.0 ± 5.0 | 50.0 ± 5.0 | 50.0 ± 5.0 |
| Transport efficiency (%) | 10.1 ± 1.8 | 103.9 ± 6.4 | 105.2 ± 6.5 | 94 ± 15 |
| 195Pt sensitivity (counts s−1 μg−1) | 4.16 × 10¹⁰ | 9.49 × 10¹⁰ | 1.77 × 10¹¹ | 1.32 × 10¹¹ |
| 197Au sensitivity (counts s−1 μg−1) | 6.4 × 10¹⁰ | 2.01 × 10¹¹ | 3.49 × 10¹¹ | 2.00 × 10¹¹ |
| 195Pt solution DL (ng L−1) | 12 | 6.5 | 4.3 | 7 |
| 197Au solution DL (ng L−1) | 11 | 9.2 | 4.5 | 8 |
| 195Pt method size DL (nm) | 25 | 24 | 11 | 18 |
| 197Au method size DL (nm) | 28 | 14 | 10 | 17 |
Furthermore, Table 6 shows that similar improvements in sensitivity and DLs were achieved as in Table 2, irrespectively of the ICPMS instrument. However, despite removal of the sheathing device and direct heating of the torch base when using the NexION 2000, the improvement in method DL remained lower than in sensitivity. Even the solution DL did not improve as much as sensitivity on the NexION 2000 with an IR-heated MC. This may be due to the handmade torch connector with Teflon sleeve that was used to connect the spray chamber elbow to the torch. A one-body quartz adapter will be fabricated and tested in future work to see if it improves precision. Alternatively, the outlet of the elbow connecting the spray chamber to the torch will be modified so that it connects directly to the torch.
| Figure of merit | 25-2 mm MC IR-heated at 70 °C | 50-2 mm MC IR-heated at 110 °C | 75-2 mm MC IR-heated at 120 °C | |||
|---|---|---|---|---|---|---|
| Varian 820MS | NexION 2000 | Varian 820MS | NexION 2000 | Varian 820MS | NexION 2000 | |
| Pt sensitivity ratio (MC/standard) | 10.2 | 2.3 | 5.9 | 4.3 | 4.4 | 3.2 |
| Au sensitivity ratio (MC/standard) | 13.2 | 3.1 | 7.0 | 5.5 | 3.8 | 3.0 |
| Pt solution DL ratio (standard/MC) | 3.3 | 1.8 | 7.1 | 2.8 | 1.5 | 1.7 |
| Au solution DL ratio (standard/MC) | 4.8 | 1.2 | 4.2 | 2.4 | 1.4 | 1.4 |
| Pt method DL ratio (standard/MC) | 2.0 | 1.1 | 3.7 | 2.2 | 1.6 | 1.4 |
| Au method DL ratio (standard/MC) | 2.9 | 2.0 | 2.6 | 2.8 | 1.4 | 1.7 |
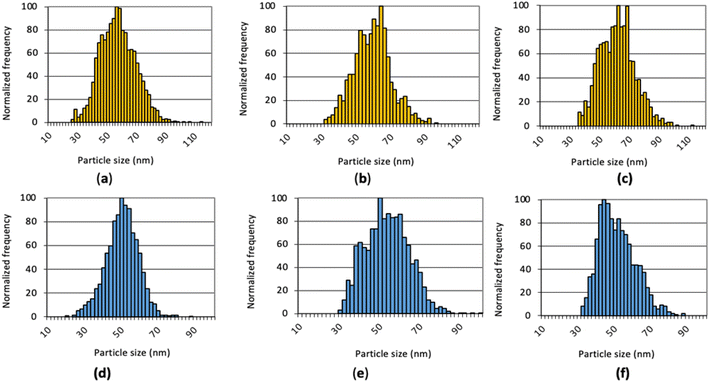
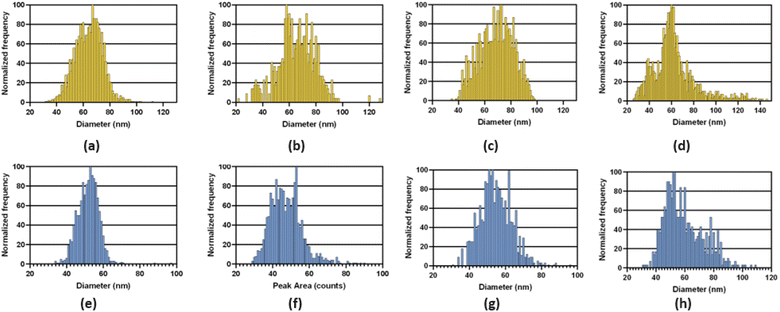
Examples of the size distributions obtained with the three MCs providing total consumption on the NexION 2000 are compared to those with the standard cyclonic spray chamber in Fig. 6. As observed on the Varian 820MS, the size distributions with the MCs are broader than with the standard system because everything is measured. The filtration process with the cyclonic spray chamber preferentially removes large droplets and may concurrently remove larger NPs. On the other hand, large droplets containing more than one NP may result in larger NPs following IR heating, if agglomeration is induced by pre-evaporation of water. Analysis of NPs suspensions with an increasing dilution factor will reveal if larger NPs are present, as the distribution would not be affected, or if small NPs agglomerate upon pre-evaporation, if the size of larger NPs decreases upon an increase in dilution factor. In any case, accurate sizing measurements and NP concentrations were obtained with all systems, as shown in Table 4. As this performance was achieved using the operating conditions optimized with the standard sample introduction system, multivariate optimization of the sampling position, nebulizer gas flow rate, IR-heating temperature, and sample uptake rate will be carried out with each spray chamber to further improve the results and find conditions providing a good balance between sensitivity, detection limit and plasma robustness.
Conclusions
In this research, an IR-heated sample introduction system was optimized for spICPMS to achieve total sample consumption and eliminate the requirement to measure the transport efficiency. All IR-heated MC systems improved sensitivity and transport efficiency compared to those achieved with a conventional Scott double-pass spray chamber on the Varian 820MS or cyclonic spray chamber on the NexION 2000. The 50-2 mm MC spray chamber IR-heated at 110 °C not only provided total consumption but also improved sensitivity and detection limit to a greater extent than in the previous work with the same system on the same instrument.26 Clearly, the use of glass-fiber insulating tape effectively assisted in sustaining a consistent temperature within the connection between the spray chamber and the torch, thereby resulting in improved measurement precision by reducing background noise and enhancing transport efficiency. The system allows accurate size measurement of Au and Pt NPs without measurement of transport efficiency. Thus, IR heating the sample introduction system facilitates spICPMS analysis.Future work will involve a more straightforward connector between the spray chamber and the base of the torch on the NexION 2000 ICPMS instrument and a more detailed optimization of the nebulization conditions with each MC chamber. To verify the increased plasma robustness provided by the fully optimized system, which introduces water in vapor form in the plasma, it will be applied to the analysis of a variety of NPs in various matrices, including environmental ones. This will include mixtures of NPs with dissolved analyte. Depending on the background signal intensity of the measured samples, different statistical approaches may be employed to determine the particle detection threshold. When dealing with low background counts, Poisson statistics are more appropriate than Gaussian statistics, as the latter may not provide a valid representation of the data distribution.28 To ensure accurate and reliable NP detection, a comprehensive comparison between Poisson statistics and Gaussian distribution will be conducted.
Data availability
Data for this article, including multiple optimizations, figures of merit, and nanoparticle suspension characterization are available at Open Science Framework at https://doi.org/10.17605/OSF.IO/RP7EC.Author contributions
Zichao Zhou: conceptualization, investigation, data curation, formal analysis, methodology, writing – original draft and revised draft; Mirah Burgener: investigation, methodology, funding acquisition, validation; John Burgener: investigation, methodology, funding acquisition, validation; Diane Beauchemin: conceptualization, funding acquisition, methodology, resources, project administration, supervision, writing – original draft and revised draft.Conflicts of interest
There are no conflicts to declare.Acknowledgements
The authors gratefully acknowledge the financial support of the Natural Sciences and Engineering Research Council of Canada (grant number 578516-22) and of Mitacs (grant number IT33380). ZZ also thanks Queen's School of Graduate Studies for a graduate award and is grateful to Burgener Research for internship support.References
- International Organization for Standardization, Nanotechnologies Vocabulary Part 1: Core Terms, ISO/TS, 2001 Search PubMed.
- A. Mohajerani, L. Burnett, J. V. Smith, H. Kurmus, J. Milas, A. Arulrajah, S. Horpibulsuk and A. A. Kadir, Materials, 2019, 12, 3052 CrossRef CAS PubMed.
- K. Schmid and M. Riediker, Environ. Sci. Technol., 2008, 42, 2253–2260 CrossRef CAS PubMed.
- B. Naseer, G. Srivastava, O. S. Qadri, S. A. Faridi, R. U. Islam and K. Younis, Nanotechnol. Rev., 2018, 7, 623–641 CrossRef CAS.
- P. Biswas and C.-Y. Wu, J. Air Waste Manage. Assoc., 2005, 55, 708–746 CrossRef CAS PubMed.
- C. M. Hoo, N. Starostin, P. West and M. L. Mecartney, J. Nanopart. Res., 2008, 10, 89–96 CrossRef CAS.
- E. Tomaszewska, K. Soliwoda, K. Kadziola, B. Tkacz-Szczesna, G. Celichowski, M. Cichomski, W. Szmaja and J. Grobelny, J. Nanomater., 2013, 2013, 1–10 CrossRef.
- T. G. F. Souza, V. S. T. Ciminelli and N. D. S. Mohallem, J. Phys.: Conf. Ser., 2016, 733, 012039 CrossRef.
- M. D. Montaño, J. W. Olesik, A. G. Barber, K. Challis and J. F. Ranville, Anal. Bioanal. Chem., 2016, 408, 5053–5074 CrossRef PubMed.
- K. Tiede, A. B. A. Boxall, S. P. Tear, J. Lewis, H. David and M. Hassellov, Food Addit. Contam.: Part A, 2008, 25, 795–821 CrossRef CAS PubMed.
- M. Hassellöv, J. W. Readman, J. F. Ranville and K. Tiede, Ecotoxicology, 2008, 17, 344–361 CrossRef PubMed.
- R. P. Lamsal, M. S. E. Houache, A. Williams, E. Baranova, G. Jerkiewicz and D. Beauchemin, Anal. Chim. Acta, 2020, 1120, 67–74 CrossRef CAS PubMed.
- C. Degueldre and P.-Y. Favarger, Colloids Surf., A, 2003, 217, 137–142 CrossRef CAS.
- F. Laborda, E. Bolea and J. Jiménez-Lamana, Anal. Chem., 2014, 86, 2270–2278 CrossRef CAS PubMed.
- E. Bolea, M. S. Jimenez, J. Perez-Arantegui, J. C. Vidal, M. Bakir, K. Ben-Jeddou, A. C. Giménez, D. Ojeda, C. Trujillo and F. Laborda, Anal. Methods, 2021, 13, 2742–2795 RSC.
- D. Mozhayeva and C. Engelhard, J. Anal. At. Spectrom., 2020, 35, 1740–1783 RSC.
- H. E. Pace, N. J. Rogers, C. Jarolimek, V. A. Coleman, C. P. Higgins and J. F. Ranville, Anal. Chem., 2011, 83, 9361–9369 CrossRef CAS PubMed.
- F.-H. Lin, S.-I. Miyashita, K. Inagaki, Y.-H. Liu and I.-H. Hsu, J. Anal. At. Spectrom., 2019, 34, 401–406 RSC.
- F. Varenne, A. Makky, M. Gaucher-Delmas, F. Violleau and C. Vauthier, Pharm. Res., 2016, 33, 1220–1234 CrossRef CAS PubMed.
- A. Williams and D. Beauchemin, J. Anal. At. Spectrom., 2022, 37, 727–732 RSC.
- A. Williams and D. Beauchemin, Anal. Chem., 2020, 92, 12778–12782 CrossRef CAS PubMed.
- R. Sánchez, Á. Cañabate, C. Bresson, F. Chartier, H. Isnard, S. Maestre, A. Nonell and J.-L. Todolí, Spectrochim. Acta, Part B, 2017, 129, 28–36 CrossRef.
- J. Kocic, D. Günther and B. Hattendorf, J. Anal. At. Spectrom., 2021, 36, 233–242 RSC.
- S. E. Long and R. F. Browner, Spectrochim. Acta, Part B, 1988, 43, 1461–1471 CrossRef.
- R. Sánchez and J.-L. Todolí, Spectrochim. Acta, Part B, 2023, 208, 106779 CrossRef.
- Z. Zhou, A. Al Hejami, M. J. Burgener, J. Burgener and D. Beauchemin, J. Anal. At. Spectrom., 2022, 37, 1450–1454 RSC.
- Y. Makonnen and D. Beauchemin, Spectrochim. Acta, Part B, 2015, 103–104, 57–62 CrossRef CAS.
- F. Laborda, A. C. Gimenez-Ingalaturre, E. Bolea and J. R. Castillo, Spectrochim. Acta, Part B, 2020, 169, 105883 CrossRef CAS.
Footnote |
| † Presented in part at the 2024 Winter Conference on Plasma Spectrochemistry, Tucson, AZ, USA. |
| This journal is © The Royal Society of Chemistry 2024 |

