
 Open Access Article
 This Open Access Article is licensed under a
 Creative Commons Attribution 3.0 Unported Licence
Exploring the impact of select anchor groups for norbornadiene/quadricyclane single-molecule switches†
Shima
Ghasemi
 a,
Luca
Ornago
b,
Zacharias
Liasi
c,
Magnus Bukhave
Johansen
c,
Theo Juncker
von Buchwald
c,
Andreas Erbs
Hillers-Bendtsen
c,
Sebastiaan
van der Poel
b,
Helen
Hölzel
f,
Zhihang
Wang
h,
Francoise M.
Amombo Noa
a,
Lars
Öhrström
a,
Kurt V.
Mikkelsen
c,
Herre S. J.
van der Zant
b,
Samuel
Lara-Avila
g and
Kasper
Moth-Poulsen
*adef
a,
Luca
Ornago
b,
Zacharias
Liasi
c,
Magnus Bukhave
Johansen
c,
Theo Juncker
von Buchwald
c,
Andreas Erbs
Hillers-Bendtsen
c,
Sebastiaan
van der Poel
b,
Helen
Hölzel
f,
Zhihang
Wang
h,
Francoise M.
Amombo Noa
a,
Lars
Öhrström
a,
Kurt V.
Mikkelsen
c,
Herre S. J.
van der Zant
b,
Samuel
Lara-Avila
g and
Kasper
Moth-Poulsen
*adef
aDepartment of Chemistry and Chemical Engineering, Chalmers University of Technology, SE-412 96 Gothenburg, Sweden. E-mail: kasper.moth-poulsen@chalmers.se
bKalvi Institute of Nanoscience, Delft University of Technology, NL-2628 CJ Delft, The Netherlands
cDepartment of Chemistry, University of Copenhagen, DK-2100 Copenhagen Ø, Denmark
dDepartment of Chemical Engineering, Universitat Politècnica de Catalunya, EEBE, ES-08019 Barcelona, Spain
eCatalan Institution for Research and Advanced Studies, ICREA, ES-08010 Barcelona, Spain
fThe Institute of Materials Science of Barcelona, ICMAB-CSIC, ES-08193 Barcelona, Spain
gDepartment of Microtechnology and Nanoscience, Chalmers University of Technology, SE-412 96 Gothenburg, Sweden
hDepartment of Materials Science and Metallurgy, University of Cambridge, 27 Charles Babbage Rd, Cambridge CB3 0FS, UK
First published on 5th October 2023
Abstract
To achieve the ultimate limit of device miniaturization, it is necessary to have a comprehensive understanding of the structure–property relationship in functional molecular systems used in single-molecule electronics. This study reports the synthesis and characterization of a novel series of norbornadiene derivatives capped with thioether and thioester anchor groups. Utilizing the mechanically controllable break junction technique, the impact of these capping groups on conductance across single-molecule junctions is investigated. Among the selection of anchor groups, norbornadiene capped with thioacetate and tert-butyl groups exhibits higher conductance (G ≈ 4 × 10⁻⁴ G0) compared to methyl thioether (G ≈ 2 × 10⁻⁴ G0). Electronic transmission through the considered set of single-molecule junctions has been simulated. The computational results for electron transport across these junctions align closely with the experimental findings, with the thioacetate- and tert-butyl-substituted systems outperforming the methyl thioether-capped derivative. In terms of junction stability, the methyl thioether-capped system is the most resilient, maintaining consistent conductance even after approximately 10![[thin space (1/6-em)]](https://www.rsc.org/images/entities/char_2009.gif) 000 cycles. Meanwhile, the likelihood of observing molecular plateaus in both the thioacetate- and tert-butyl-substituted systems declines over time. These findings substantially advance both the design and understanding of functional molecular systems in the realm of single-molecule electronics, particularly in the context of molecular photoswitches.
000 cycles. Meanwhile, the likelihood of observing molecular plateaus in both the thioacetate- and tert-butyl-substituted systems declines over time. These findings substantially advance both the design and understanding of functional molecular systems in the realm of single-molecule electronics, particularly in the context of molecular photoswitches.
Introduction
The incorporation of organic molecules into single-molecule devices stands as a transformative pathway to decreasing the dimensions of electronic devices.1–4 These pioneering systems have showcased an array of impressive functionalities, ranging from the intricate dynamics of (photo)switching phenomena5–9 to the roles played by single-molecule diodes10,11 and transistors.12,13 Moreover, the study of single-molecule junctions has helped unveil intricate details of electron14,15 and heat transport16,17 at the molecular scale.Central to the construction of a single-molecule junction are three fundamental components: the structure of the core molecule, the chemical anchor groups, and the electrodes themselves. The intricate design of both the molecular structure and the anchor groups wields a profound influence on the conductance observed across metal–molecule–metal junctions, unraveling new possibilities for tailoring and fine-tuning electronic properties.18 Through meticulous modifications of the anchor groups and careful manipulation of molecular lengths, researchers are able to ingeniously engineer the interface between the molecule and the electrodes, thus unraveling fresh avenues of inquiry and unlocking the potential for unprecedented breakthroughs.19–21
The presented investigation combines experimental and computational approaches to study the conductance of three distinct thioether- and thioester-substituted norbornadiene (NBD) derivatives (Fig. 1). NBD is a bicyclic hydrocarbon that undergoes photoisomerization to the metastable quadricyclane (QC) form when exposed to light.22,23 The NBD/QC photoswitch pair has attracted significant attention, demonstrating remarkable versatility in diverse applications including energy storage,24–27 diagnostics,28 and single-molecule devices.22,23 Prior studies employing scanning tunneling microscopy break junction (STM-BJ) techniques have showcased the remarkable memristive behavior of a derivative of the NBD/QC pair, exhibiting distinctive high (G = 1.2 ± 0.1 × 10⁻⁴ G0) and low (G = 1.9 ± 0.8 × 10⁻⁵ G0) conductance states, corresponding to the NBD and QC states of the core molecule, respectively.22,23 Notably, this previously investigated derivative is characterized by thiol anchor groups and an extended phenyl acetylene structure comprising four benzene rings, resulting in a theoretical gas-phase molecule length of roughly 1.8 nm.22
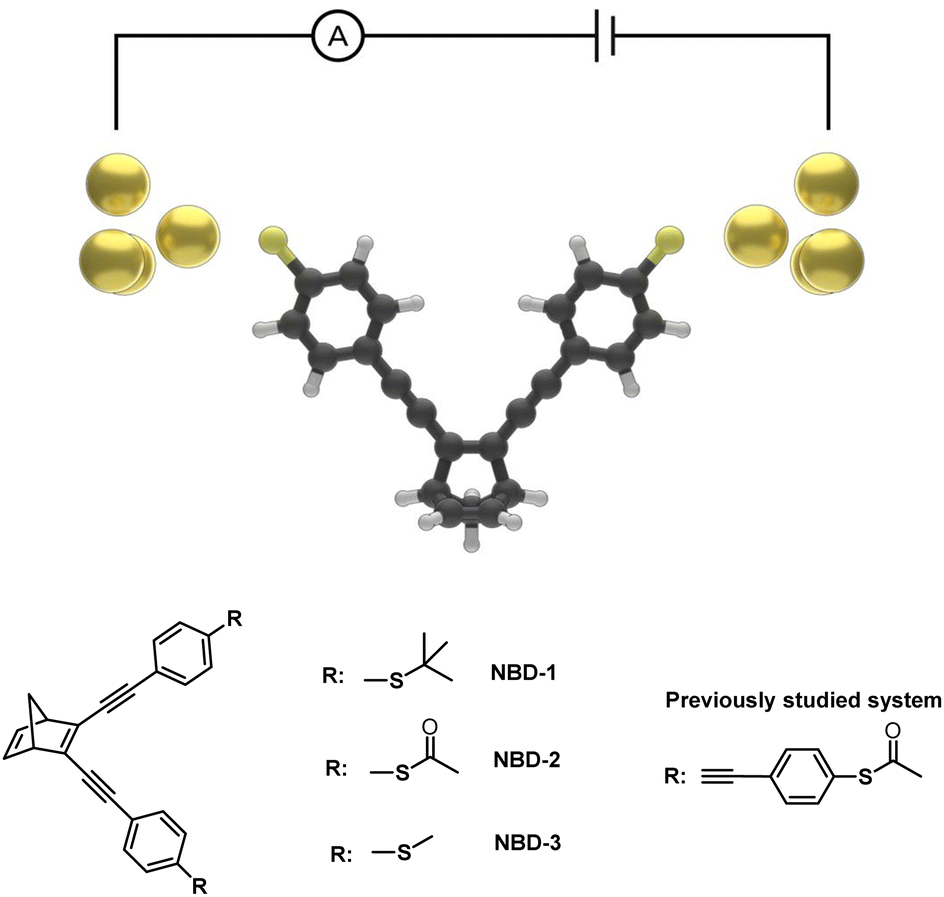 | ||
| Fig. 1 Illustration of an Au-NBD-Au junction and the molecular structure of NBD capped with thioether and thioester anchor groups. | ||
Given the considerable influence that experimental setup, molecular length, and anchor groups can exert on conductance properties,29–33 this study embarks on investigating a novel series of thioether- and thioester-capped NBD molecules, characterized by reduced lengths and encompassing three distinct anchor groups: tert-butyl thioether (NBD-1), thioacetate (NBD-2), and methyl thioether (NBD-3). To achieve this, a modified synthetic strategy was employed, capitalizing on palladium-catalyzed cross-coupling reactions to construct the molecular systems. The effects of the selected anchor groups on conductance are thoroughly examined, providing insights into the complex conduction properties of these NBD derivatives. The analysis employs the mechanically controllable break junction technique (MCBJ), a reliable method for precise measurements and control of electrode spacing, in conjunction with electron transport simulations.
Synthesis and characterization
The three investigated NBD derivatives were synthesized through consecutive Sonogashira cross-coupling reactions,34 as shown in Scheme 1, wherein the different thioether and thioester anchor groups were attached to 2,3-dibromonorbornadiene (4). S-(4-Ethynylphenyl) ethanethioate has been introduced into molecular wires previously through a reaction with 1,4-dibromobenzene.35 Here, different classical conditions were employed to couple S-(4-ethynylphenyl) ethanethioate with 2,3-dibromonorbornadiene. In order to overcome the challenge posed by the potential degradation of the liable thioacetate group in the presence of palladium catalysts, an alternative synthetic strategy was adopted. Specifically, compound (10), an equivalent to S-(4-ethynylphenyl)ethanethioate, was coupled with compound (4), leading to the direct formation of NBD-1 with a yield of 50%. Subsequently, NBD-1 was treated with boron tribromide in the presence of acetyl chloride, resulting in the formation of the thioacetate-substituted NBD derivative (NBD-2) as a final product (20% yield).36 The NBD-3 system was synthesized through Sonogashira coupling of compound (4) with (4-ethynylphenyl)(methyl)sulfane (14) resulting in a yield of 40%. The full details of the synthesis procedures are reported in the ESI,† Section S1. | ||
| Scheme 1 Synthetic route for NBD-1, NBD-2, and NBD-3. (i) PdCl2(PPh3)2, CuI, Et3N, THF. (ii) PdCl2(PPh3)2, CuI, Et3N, THF. (iii) BBr3, acetyl chloride, toluene. | ||
NBD-2 crystals were grown in a mixture of dichloromethane and hexane (2:10), from which a suitable crystal was selected for single-crystal X-ray diffraction (SCXRD) measurements. The crystal was solved in the monoclinic space group P21/c (Z = 4) with one molecule in its asymmetric unit (Fig. 2). The crystal structure is primarily stabilized by three C–H⋯O hydrogen-bond interactions. Additionally, there is a C–H⋯π interaction between C31–H31B in one of the methyl groups and the six-membered ring from the same arm at a distance of 0.278 nm. The presence of π–π stacking is negligible in the crystal structure, primarily attributed to the relatively long C⋯C distances observed, with the shortest separation recorded at 0.502 nm.
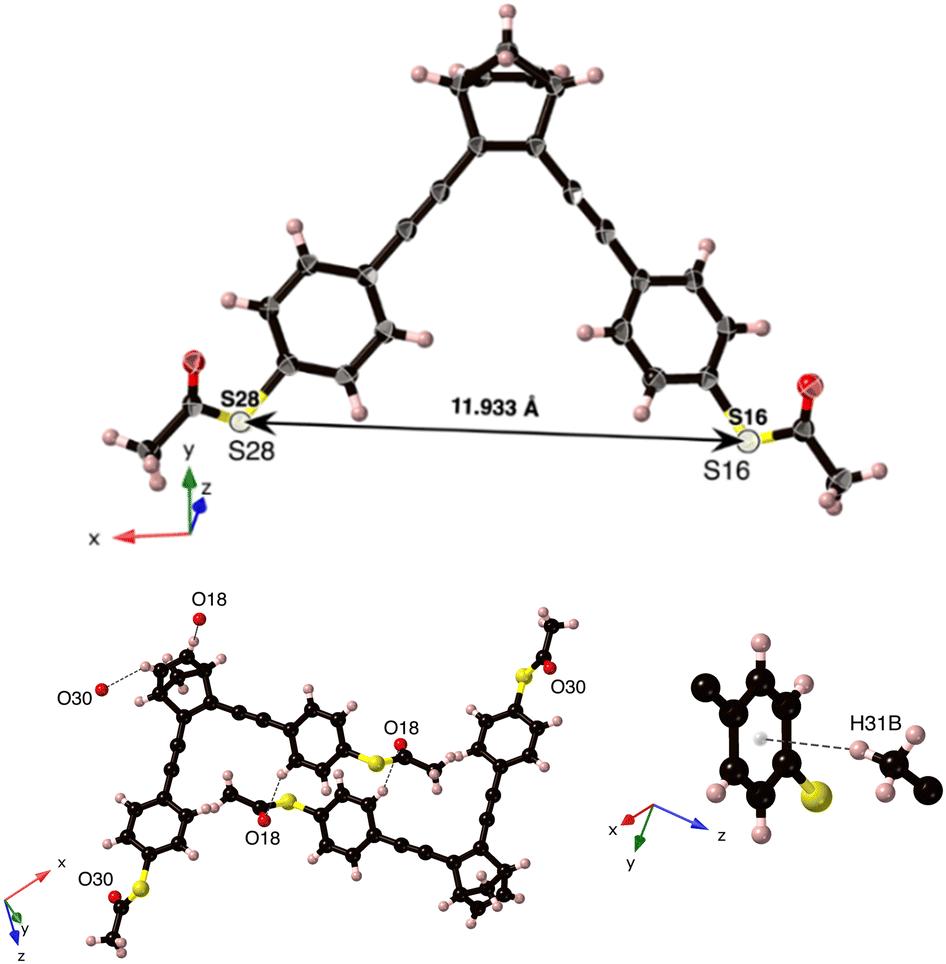 | ||
| Fig. 2 (top) Single-crystal X-ray structure of NBD-2, with displacement ellipsoids drawn at 50% probability level. (bottom) The three C–H⋯O hydrogen-bond interactions and the C–H⋯π interaction. | ||
From the crystal-structure analysis of NBD-2, it can be noted that the two benzene rings in the structure exhibit a slight skewing, with an angle of 28 degrees between their respective normal planes (ESI†), Fig. S11. A key insight gained from the crystal structure analysis is the precise molecular dimensions. In particular, the sulfur–sulfur distance, which represents the molecular length, is relevant for the expected dimensions of the molecular junctions. The presented crystal structure possesses a sulfur-to-sulfur distance of 1.1933 nm. Additional information regarding the crystal structure is reported in the ESI,† Section S2.
The conductance of the Au-NBD-Au junctions was measured using the MCBJ technique, which involved recording the current as a function of displacement. To ensure the cleanliness of the gold device prior to the MCBJ measurements, 1000 traces were recorded on the bare surface. Subsequently, approximately 5 μL of the target molecular solution (dichloromethane) was dropcasted onto the junction, followed by solvent evaporation. The measurements were performed at room temperature, utilizing a voltage bias of 0.1 V and a piezoelectric element actuation speed of 50 V s−1, corresponding to about 1 nm s−1 in electrode displacement speed. A deviation from the typically employed molecular solution concentrations of 100 μM29,37,38 was necessary for stability during the experiment. Specifically, at a 100 μM concentration with NBD-2 as the target molecule, stable measurements were unattainable, yielding only a few consecutive breaking traces. A concentration of 10 μM extended the measurement duration but capped out at around 2000 traces. A 1 μM concentration allowed for the collection of 10000 traces with a reasonable yield of molecular junctions, whereas a 0.1 μM concentration resulted in a low yield of molecular plateaus. The 2D-histograms of the measurements at different concentrations can be found in the ESI,† Fig. S13.
The MCBJ measurements reveal distinct conductance plateaus for each of the three NBD compounds, categorized as Class 1 and Class 2. The classification of these was done using a previously published k-means++-based method39 (see Section S3 in the ESI† for further details). Class 1 exhibits a high-conductance plateau at approximately 10−4 G0, while Class 2 displays a lower conductance plateau at around 10−5 G0. Representative examples of these plateaus are illustrated in Fig. 3.
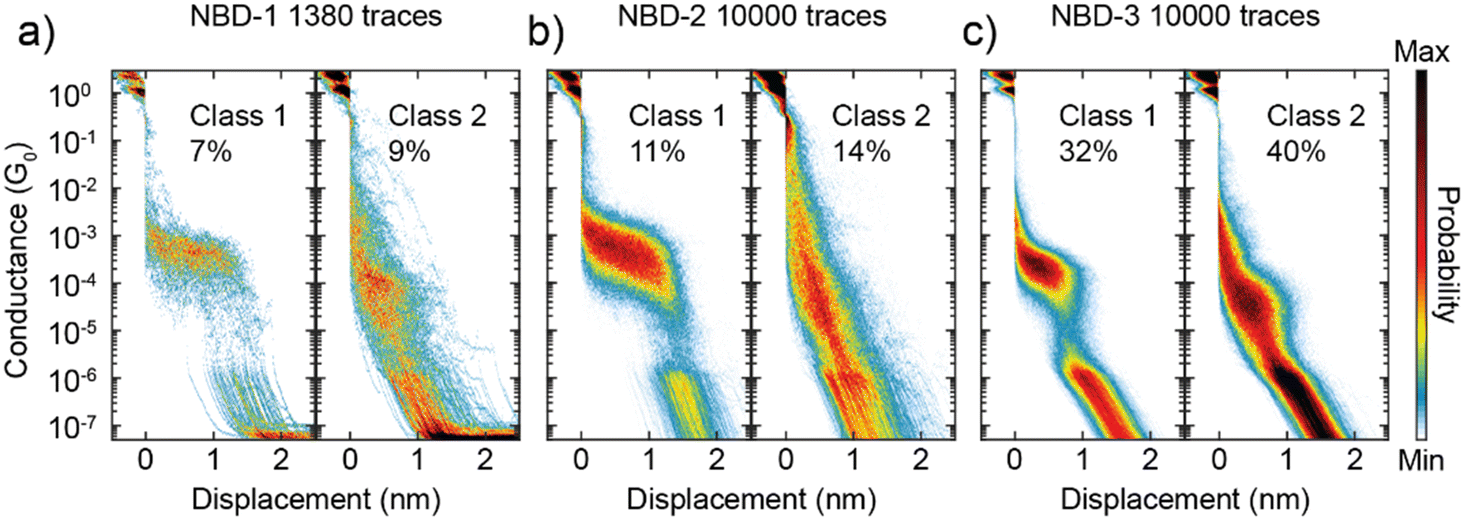 | ||
| Fig. 3 Two-dimensional conductance-displacement histograms of Class 1 (left) and Class 2 (right), derived from the MCBJ measurements of (a) NBD-1, (b) NBD-2, and (c) NBD-3. The number in the inset is the yield of the corresponding class. | ||
For NBD-1 and NBD-2, Class 1 displays a plateau at 4 × 10⁻⁴ G0 with a length of 1.2 nm. Considering an additional approximately 0.5 nm “snapback” of the electrodes, this corresponds to an estimated molecule length of 1.7 nm. Surprisingly, this length is significantly longer than the distance between the two sulfur atoms in NBD-2, as measured by SCXRD. In the case of NBD-3, Class 1 exhibits a conductance of 2 × 10⁻⁴ G0, which is twice as low as the thioacetate counterpart, consistent with observations in the literature for similar systems.29,30,33,40 Notably, the plateau length for NBD-3 is 0.7 nm, corresponding to a molecular length of 1.3 nm, which is consistent with the SCXRD result. The observed difference of 0.5 nm is considerably higher than the expected 0.1–0.2 nm often reported in the literature.29,30,40,41
Another intriguing observation is the time-dependent decrease in the presence of Class 1 for NBD-1 and NBD-2. This trend is illustrated in Fig. 4a: during the initial 2000 traces, Class 1 is predominant and clearly visible in the two-dimensional histogram. In the subsequent 2000 traces (from 2001 to 4000), the high-conductance plateau remains visible but loses its dominance. Between trace 4001 and trace 6000, Class 1 can still be observed, albeit with a considerably lower yield. After trace 6000, Class 1 traces appear to be essentially absent. To gain further insight into this phenomenon, the probability of measuring traces belonging to Class 1 or Class 2 as the measurement progressed was calculated. The probability was computed over intervals of 200 traces (equivalent to approximately 25 minutes of measurement) centered on each trace, excluding the first and last 100 traces due to incomplete intervals. The result of this analysis is presented in Fig. 4b. For NBD-1 and NBD-2, the probability of measuring Class 1 experiences a sharp decay within the first 4000 traces, ultimately vanishing, while the probability of Class 2 remains relatively stable. In contrast, NBD-3 does not exhibit a decay in the probability of either class.
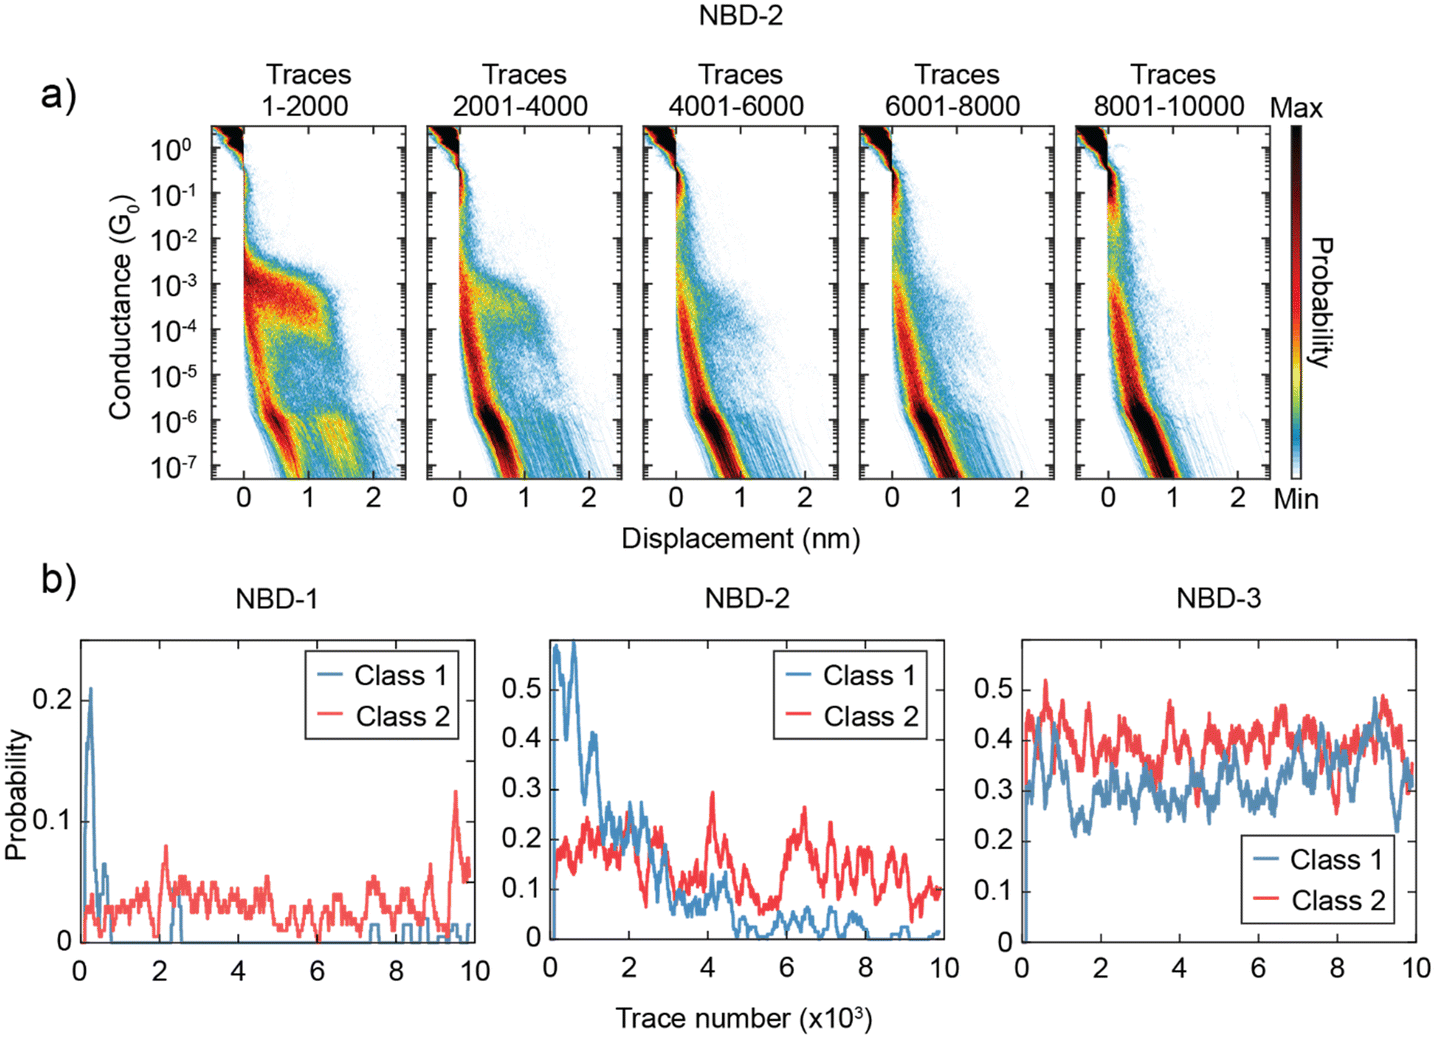 | ||
| Fig. 4 (a) Two-dimensional histograms of the raw data of NBD-2 constructed using subsequent intervals of 2000 traces (corresponding roughly to two hours of measurement). (b) Time evolution of the probability of measuring Class 1 (red) and Class 2 (blue) for NBD-1 (left), NBD-2 (center), and NBD-3 (right). | ||
The interpretation of the origin of the two classes is not straightforward. Although the conductance values align with those reported in the literature,22,23 Class 1 displays a plateau length greatly exceeding what would be anticipated based on the SCXRD structure. Consequently, this elongated plateau cannot be solely attributed to a sulfur-to-sulfur molecular connection. Additional factors, such as sulfur dimerization or molecular strain, could be contributing factors, although these mechanisms remain speculative based on the available data. In contrast, Class 2 exhibits a plateau length of 0.9 nm (1.4 nm electrode-electrode distance), more closely aligning with expectations based on literature on comparable compounds.22,23
Electron transport calculations
To gain further insights into the intricate nature of how the anchor groups affect the electron-transport properties, simulations of the electron transport across the considered molecular junctions have been carried out. Given the similarity between the measured conductance of the NBD-1 and NBD-2 systems, the possibility of both systems undergoing deprotection, resulting in the same thiolate, has to be taken into account. While literature on tert-butyl thioether-functionalized molecular wires is limited,42 the steric bulk of the group, in combination with the similarity in measured conductance to the thioacetate-capped system—which is known to undergo deprotection43–46—suggests that the NBD-1 system may also undergo some degree of deprotection. This might also be part of the explanation for the noted stability of the junctions. Specifically, the likelihood of measuring Class 1 for the NBD-1 and NBD-2 systems diminishes significantly over time. In contrast, the probability for the NBD-3 system remains consistent, suggesting that methyl thioether is the most resilient protection group out of the three. Additionally, this implies that the NBD-1 and NBD-2 systems face comparable challenges regarding stability, possibly due to undergoing some level of in situ deprotection.Here, a complete deprotection of both systems has been assumed for the simulations, resulting in near identical transmission probabilities across the considered 5 eV energy window. The geometries of the two systems were optimized in vacuo, including the tert-butyl thioether and thioacetate groups, prior to the electron transport calculations. The terminal groups were then removed as the systems were placed in the gold junctions. The same was done for NBD-3, albeit without removing the terminal methyl groups. Full details regarding the level of theory and the computational approach are presented in the ESI,† Section S4.
The theoretical structures contain sulfur–sulfur distances ranging from 1.1343 nm to 1.2911 nm (Fig. 5) and are thus qualitatively comparable to the SCXRD-obtained structure of NBD-2 (1.1933 nm). Additionally, the predicted electronic transmission across the three junctions, displayed in Fig. 6, qualitatively reproduces the experimental findings. Mainly, a noticeable decrease in transmission around the Fermi energy level is seen going from NBD-1 and NBD-2 to NBD-3.
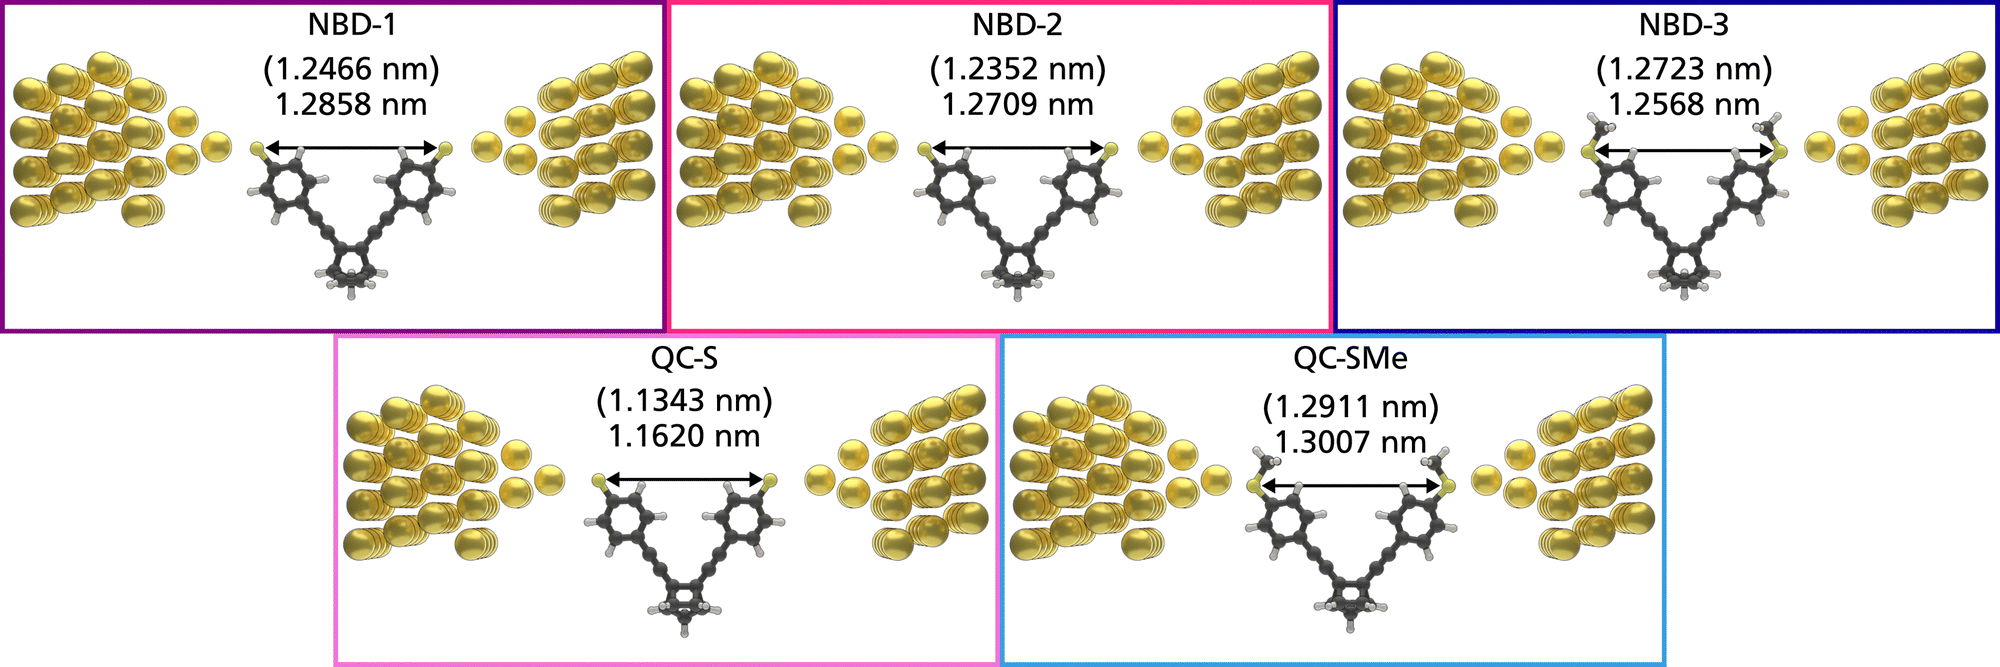 | ||
| Fig. 5 Depictions of the non-optimized single-molecule junctions. The lengths in parentheses are the sulfur–sulfur distances present in the vacuum-optimized structures, while the values below are the sulfur–sulfur distances in the relaxed junction geometries. | ||
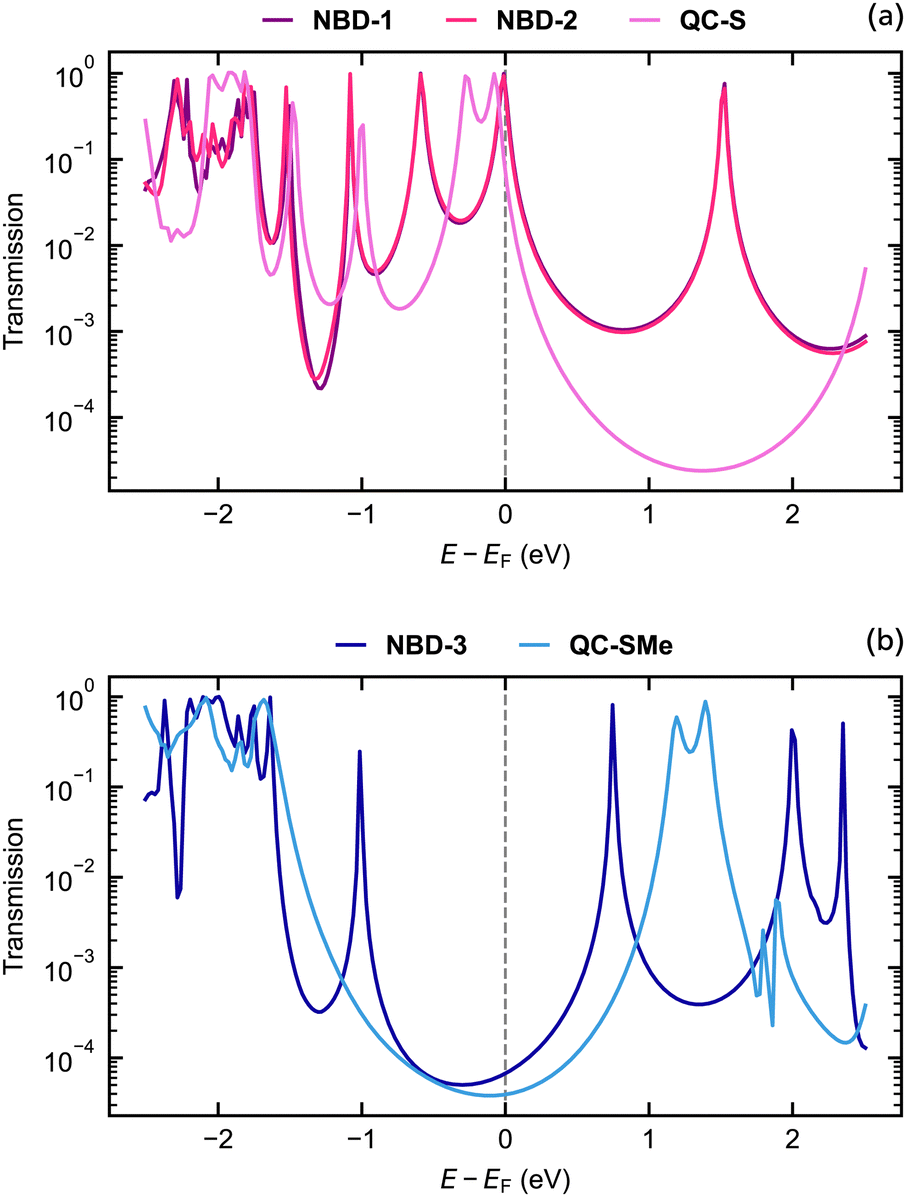 | ||
| Fig. 6 Electronic transmission calculated using density functional theory through the (a) NBD-1, NBD-2, QC-S, (b) NBD-3, and QC-SMe junctions. | ||
It is important to note that in systems with thiol-based anchor groups, the transmission is typically governed by a resonance associated with the highest occupied molecular orbital (HOMO), which typically aligns with the Fermi energy level of the gold electrodes.47,48 The results presented in Fig. 6 demonstrate the same phenomenon, as all three NBD derivatives exhibit a transmission peak near the Fermi energy corresponding to their respective HOMO energies. The tails of these peaks are the main contributors to the predicted transmission at the Fermi energy level, although for the deprotected derivatives, the HOMO-induced transmission peak overlaps with the Fermi energy level. The placement of the Fermi energy level thus plays a crucial role in the determination of qualitative aspects of the junctions and may also affect the predicted transmission gap between different molecular junctions.
While not established in this particular study, previous research on the NBD/QC pair in a metal junction has shown switching behavior from NBD to QC during measurements.24,25 It is important to acknowledge that the NBD derivatives being investigated may undergo varying degrees of switching, which can significantly impact the results as the transition from NBD to QC leads to a decrease in conductance. In the NBD state, there is a conjugated pathway from one substituent to the other through the double π-bond, whereas the transition to QC breaks this conjugated pathway, resulting in lower conductance. Due to the presence of a π-conjugated pathway through the NBD molecule, where the energy gap between occupied and virtual orbitals is smaller, the decay of the HOMO-induced peak occurs at a slower rate compared to the QC systems. Consequently, the NBD derivatives exhibit higher transmission at the Fermi energy than their QC counterparts.
From comparable electron transport calculations for the QC isomer of NBD-1 (denoted QC-S), a transmission ratio of 9.58 at the Fermi energy is predicted. The ratio between the NBD-3 system and its counterpart, QC-SMe, is 1.71. The NBD-3/QC-SMe ratio is thus lower than the theoretical and experimental ratios found for a similar NBD/QC derivative pair, while the NBD-1/QC-S ratio is comparable.22 The switching from the NBD molecule to the QC form could thus be at the origin of the two classes of conductance observed in the measurements. In previous studies on similar NBD/QC derivatives,25 the transition was proven to be possible at low yields even at a small voltage bias. However, the presence of other mechanisms, such as the formation of junctions in which the molecule binds with different coordination to the gold surface,29 cannot be excluded.
Conclusions
A novel family of NBD capped with thioether and thioester anchor groups has been introduced and thoroughly investigated to understand their conductive properties. Through meticulous MCBJ measurements, a consistent observation emerged across the series of NBD compounds, revealing the presence of high-conductance plateaus at approximately 10−4 G0, accompanied by lower plateaus around 10−5 G0. As anticipated based on prior research, NBD-3 demonstrated lower conductance compared to NBD-2 and NBD-1.Notably, for NBD-3, the probability of measuring each conductance class remained stable throughout the measurement, indicating consistent behavior. In contrast, for NBD-1 and NBD-2, the probability of measuring the high-conductance class decreased over time, suggesting a time-dependent change in their conductive properties. This might be a consequence of in situ deprotection, in combination with the conditions under which the measurements were carried out. This observation highlights the dynamic nature of molecular junctions and emphasizes the significance of monitoring behavior during extended measurements. Simulations of the considered single-molecule junctions demonstrated the same conductance pattern across the selection of anchor groups, with the NBD-1 and NBD-2 systems outperforming the methyl thioether NBD-3 system. Additionally, simulations of the corresponding QC systems showed a considerable drop in conductance compared to the respective NBD systems. The ratio between the conductance of the NBD and QC states indicates that a switch from one state to the other might explain—at least partially—the different conductance classes observed in the MCBJ measurements.
Overall, this study contributes to the understanding of molecular junctions and their conductive properties. The synthesis of a new family of NBD molecules, combined with comprehensive experimental measurements and computational simulations, has provided valuable insights into the behavior and potential applications of these molecules in nanoelectronics and molecular-scale devices.
Conflicts of interest
There are no conflicts to declare.Acknowledgements
KMP acknowledges funding from the Catalan Institution for Research and Advanced Studies (ICREA), the European Research Council (ERC) through ERC-CoG PHOTHERM, and the European Union project ESiM 101046364. The Swedish NMR Centre at the University of Gothenburg is acknowledged for its support.References
- M. Ratner, Nat. Nanotechnol., 2013, 8, 378–381 CrossRef CAS PubMed.
- L. Sun, Y. A. Diaz-Fernandez, T. A. Gschneidtner, F. Westerlund, S. Lara-Avila and K. Moth-Poulsen, Chem. Soc. Rev., 2014, 43, 7378–7411 RSC.
- P. Gehring, J. M. Thijssen and H. S. J. van der Zant, Nat. Rev. Phys., 2019, 1, 381–396 CrossRef.
- H. Chen, C. Jia, X. Zhu, C. Yang, X. Guo and J. F. Stoddart, Nat. Rev. Mater., 2023, 8, 165–185 CrossRef.
- I. Franco, C. B. George, G. C. Solomon, G. C. Schatz and M. A. Ratner, J. Am. Chem. Soc., 2011, 133, 2242–2249 CrossRef CAS PubMed.
- J. L. Zhang, J. Q. Zhong, J. D. Lin, W. P. Hu, K. Wu, G. Q. Xu, A. T. S. Wee and W. Chen, Chem. Soc. Rev., 2015, 44, 2998–3022 RSC.
- N. Fuentes, A. Martin-Lasanta, L. Á. de Cienfuegos, M. Ribagorda, A. Parra and J. M. Cuerva, Nanoscale, 2011, 3, 4003–4014 RSC.
- U. Rashid, E. Chatir, L. Medrano Sandonas, P. A. Sreelakshmi, A. Dianat, R. Gutierrez, G. Cuniberti, S. Cobo and V. Kaliginedi, Angew. Chem., 2023, 135, e202218767 CrossRef.
- Y. Kim, T. J. Hellmuth, D. Sysoiev, F. Pauly, T. Pietsch, J. Wolf, A. Erbe, T. Huhn, U. Groth and U. E. Steiner, Nano Lett., 2012, 12, 3736–3742 CrossRef CAS PubMed.
- B. Capozzi, J. Xia, O. Adak, E. J. Dell, Z.-F. Liu, J. C. Taylor, J. B. Neaton, L. M. Campos and L. Venkataraman, Nat. Nanotechnol., 2015, 10, 522–527 CrossRef CAS PubMed.
- A. C. Aragonès, N. Darwish, S. Ciampi, F. Sanz, J. J. Gooding and I. Díez-Pérez, Nat. Commun., 2017, 8, 15056 CrossRef PubMed.
- J. Park, A. N. Pasupathy, J. I. Goldsmith, C. Chang, Y. Yaish, J. R. Petta, M. Rinkoski, J. P. Sethna, H. D. Abruña and P. L. McEuen, Nature, 2002, 417, 722–725 CrossRef CAS PubMed.
- M. L. Perrin, E. Burzurí and H. S. J. van der Zant, Chem. Soc. Rev., 2015, 44, 902–919 RSC.
- J. O. Thomas, B. Limburg, J. K. Sowa, K. Willick, J. Baugh, G. A. D. Briggs, E. M. Gauger, H. L. Anderson and J. A. Mol, Nat. Commun., 2019, 10, 4628 CrossRef PubMed.
- J. E. Greenwald, J. Cameron, N. J. Findlay, T. Fu, S. Gunasekaran, P. J. Skabara and L. Venkataraman, Nat. Nanotechnol., 2021, 16, 313–317 CrossRef CAS PubMed.
- N. Mosso, H. Sadeghi, A. Gemma, S. Sangtarash, U. Drechsler, C. Lambert and B. Gotsmann, Nano Lett., 2019, 19, 7614–7622 CrossRef CAS PubMed.
- L. Cui, S. Hur, Z. A. Akbar, J. C. Klöckner, W. Jeong, F. Pauly, S.-Y. Jang, P. Reddy and E. Meyhofer, Nature, 2019, 572, 628–633 CrossRef CAS PubMed.
- Y. Komoto, S. Fujii, M. Iwane and M. Kiguchi, J. Mater. Chem. C, 2016, 4, 8842–8858 RSC.
- T. A. Su, M. Neupane, M. L. Steigerwald, L. Venkataraman and C. Nuckolls, Nat. Rev. Mater., 2016, 1, 1–15 Search PubMed.
- S. Ghasemi and K. Moth-Poulsen, Nanoscale, 2021, 13, 659–671 RSC.
- W. R. French, C. R. Iacovella, I. Rungger, A. M. Souza, S. Sanvito and P. T. Cummings, J. Phys. Chem. Lett., 2013, 4, 887–891 CrossRef CAS PubMed.
- B. E. Tebikachew, H. B. Li, A. Pirrotta, K. Börjesson, G. C. Solomon, J. Hihath and K. Moth-Poulsen, J. Phys. Chem. C, 2017, 121, 7094–7100 CrossRef CAS PubMed.
- H. B. Li, B. E. Tebikachew, C. Wiberg, K. Moth-Poulsen and J. Hihath, Angew. Chem., 2020, 132, 11738–11743 CrossRef.
- Z. Wang, P. Erhart, T. Li, Z.-Y. Zhang, D. Sampedro, Z. Hu, H. A. Wegner, O. Brummel, J. Libuda and M. B. Nielsen, Joule, 2021, 5, 3116–3136 CrossRef CAS.
- M. Mansø, A. U. Petersen, Z. Wang, P. Erhart, M. B. Nielsen and K. Moth-Poulsen, Nat. Commun., 2018, 9, 1945 CrossRef PubMed.
- Z. Wang, A. Roffey, R. Losantos, A. Lennartson, M. Jevric, A. U. Petersen, M. Quant, A. Dreos, X. Wen and D. Sampedro, Energy Environ. Sci., 2019, 12, 187–193 RSC.
- Z. Wang, H. Hölzel and K. Moth-Poulsen, Chem. Soc. Rev., 2022, 51, 7313–7326 RSC.
- A. Dreos, J. Ge, F. Najera, B. E. Tebikachew, E. Perez-Inestrosa, K. Moth-Poulsen, K. Blennow, H. Zetterberg and J. Hanrieder, ACS Senors, 2023, 8, 1500–1509 CAS.
- L. Ornago, J. Kamer, M. El Abbassi, F. C. Grozema and H. S. J. Van Der Zant, J. Phys. Chem. C, 2022, 126, 19843–19848 CrossRef CAS.
- R. Frisenda, S. Tarkuç, E. Galán, M. L. Perrin, R. Eelkema, F. C. Grozema and H. S. J. van der Zant, Beilstein J. Nanotechnol., 2015, 6, 1558–1567 CrossRef CAS PubMed.
- W. Hong, D. Z. Manrique, P. Moreno-García, M. Gulcur, A. Mishchenko, C. J. Lambert, M. R. Bryce and T. Wandlowski, J. Am. Chem. Soc., 2012, 134, 2292–2304 CrossRef CAS PubMed.
- V. Kaliginedi, A. V. Rudnev, P. Moreno-García, M. Baghernejad, C. Huang, W. Hong and T. Wandlowski, Phys. Chem. Chem. Phys., 2014, 16, 23529–23539 RSC.
- E. Leary, A. La Rosa, M. T. González, G. Rubio-Bollinger, N. Agraït and N. Martín, Chem. Soc. Rev., 2015, 44, 920–942 RSC.
- E. H. Van Dijk, D. J. T. Myles, M. H. Van Der Veen and J. C. Hummelen, Org. Lett., 2006, 8, 2333–2336 CrossRef CAS PubMed.
- J. M. Tour, A. M. Rawlett, M. Kozaki, Y. Yao, R. C. Jagessar, S. M. Dirk, D. W. Price, M. A. Reed, C. Zhou and J. Chen, Chem. – Eur. J., 2001, 7, 5118–5134 CrossRef CAS PubMed.
- N. Stuhr-Hansen, Synth. Commun., 2003, 33, 641–646 CrossRef CAS.
- R. Frisenda, D. Stefani and H. S. J. Van Der Zant, Acc. Chem. Res., 2018, 51, 1359–1367 CrossRef CAS PubMed.
- T. Fu, K. Frommer, C. Nuckolls and L. Venkataraman, J. Phys. Chem. Lett., 2021, 12, 10802–10807 CrossRef CAS PubMed.
- D. Cabosart, M. El Abbassi, D. Stefani, R. Frisenda, M. Calame, H. S. J. Van Der Zant and M. L. Perrin, Appl. Phys. Lett., 2019, 114, 143102 CrossRef.
- A. Daaoub, L. Ornago, D. Vogel, P. Bastante, S. Sangtarash, M. Parmeggiani, J. Kamer, N. Agraït, M. Mayor and H. van der Zant, J. Phys. Chem. Lett., 2022, 13, 9156–9164 CrossRef CAS PubMed.
- E. Leary, C. Roche, H.-W. Jiang, I. Grace, M. T. González, G. Rubio-Bollinger, C. Romero-Muñiz, Y. Xiong, Q. Al-Galiby and M. Noori, J. Am. Chem. Soc., 2018, 140, 710–718 CrossRef CAS PubMed.
- S. Kubatkin, A. Danilov, M. Hjort, J. Cornil, J.-L. Brédas, N. Stuhr-Hansen, P. Hedegård and T. Bjørnholm, Nature, 2003, 425, 698–701 CrossRef CAS PubMed.
- J. M. Tour, L. I. I. Jones, D. L. Pearson, J. J. S. Lamba, T. P. Burgin, G. M. Whitesides, D. L. Allara, A. N. Parikh and S. Atre, J. Am. Chem. Soc., 1995, 117, 9529–9534 CrossRef CAS.
- H. Valkenier, E. H. Huisman, P. A. van Hal, D. M. de Leeuw, R. C. Chiechi and J. C. Hummelen, J. Am. Chem. Soc., 2011, 133, 4930–4939 CrossRef CAS PubMed.
- M. T. González, E. Leary, R. García, P. Verma, M. Á. Herranz, G. Rubio-Bollinger, N. Martín and N. Agraït, J. Phys. Chem. C, 2011, 115, 17973–17978 CrossRef.
- M. S. Inkpen, Z. Liu, H. Li, L. M. Campos, J. B. Neaton and L. Venkataraman, Nat. Chem., 2019, 11, 351–358 CrossRef CAS PubMed.
- J. A. Malen, P. Doak, K. Baheti, T. D. Tilley, R. A. Segalman and A. Majumdar, Nano Lett., 2009, 9, 1164–1169 CrossRef CAS PubMed.
- A. Tan, J. Balachandran, S. Sadat, V. Gavini, B. D. Dunietz, S.-Y. Jang and P. Reddy, J. Am. Chem. Soc., 2011, 133, 8838–8841 CrossRef CAS PubMed.
Footnote |
| † Electronic supplementary information (ESI) available: Full description of the synthesis, simulation, and chemical characterization of the investigated systems, including 1H-NMR, 13C-NMR, HRMS, SCXRD, MCBJ, and computational data. CCDC 2269540. For ESI and crystallographic data in CIF or other electronic format see DOI: https://doi.org/10.1039/d3tc02652c |
| This journal is © The Royal Society of Chemistry 2023 |