 Open Access Article
Creative Commons Attribution 3.0 Unported Licence
A generalized neural network approach for separation of molecular breaking traces†
Frederik
van Veen
*ab,
Luca
Ornago
a,
Herre S.J.
van der Zant
 *a and
Maria
El Abbassi
 a
a
aDepartment of Quantum Nanoscience, Delft University of Technology, Delft 2628CJ, The Netherlands. E-mail: Frederik.vanVeen@empa.ch; h.s.j.vanderzant@tudelft.nl
bTransport at Nanoscale Interfaces Laboratory, Empa, Swiss Federal Laboratories for Materials Science and Technology, Überlandstrasse 129, Dübendorf CH-8600, Switzerland
First published on 11th October 2023
Abstract
Break-junction experiments are used to statistically study the electronic properties of individual molecules. The measurements consist of repeatedly breaking and merging a gold wire while measuring the conductance as a function of displacement. When a molecule is captured, a plateau is observed in the conductance traces otherwise exponentially decaying tunnel traces are measured. Clustering methods are widely used to separate these traces and identify potential sub-populations in the data corresponding to different molecular junction configurations. As these configurations are typically a priori unknown, unsupervised methods are most suitable for the classification. However, most of the unsupervised methods used for the classification perform poorly in the identification of these small sub-populations of molecular traces. Robust removal of tunnelling-only traces before clustering is thus of great interest. Neural networks have been proven to be powerful in the classification of data samples with predictable behaviour, but often show large sensitivity to the underlying training data. In this study we report on a neural network method for the separation of tunnelling-only traces in conductance vs. displacement measurements that achieves excellent classification performance for complete and unseen data sets. This method is particularly useful for data sets in which the yield of molecular traces is low or which comprise of a significant number of traces displaying a jump from tunneling features to a molecular plateau.
1. Introduction
Single-molecule charge transport experiments have enabled the investigation of a broad range of quantum effects at the molecular scale such as quantum interference,1 nanoscale diodes2 and Franck–Condon blockade.3 At room temperature, these phenomenon are studied using break-junction experiments which rely on the stochastic formation of molecular junctions, resulting in a spread of outcomes of consecutive measurements.4,5 The origin of these variations lies in the sensitivity with regard to the atomic details of the molecule, the position in the junction and the metal-molecule chemistry.6–9 Because of this, the junction properties (e.g. junction conductance, current–voltage characteristics, or Seebeck coefficient) are typically investigated through the acquisition of large data sets, comprising thousands of repeated measurements.A common approach to statistically determine the single-molecule conductance value is to construct conductance histograms from a set of conductance vs. displacement (breaking) traces and fit the prominent peaks with a log-normal distribution.10 However, this approach can lead to inaccurate data interpretation as measurement sets may exhibit breaking curves of distinct molecular configurations (e.g. different injection points, participation of additional molecules). In such cases, the most probable conductance value obtained from the raw histograms cannot be attributed to a unique molecular conformation.11 Clustering algorithms can help to separate the traces into categories of distinct molecular configurations, to be analysed individually. Most conventional unsupervised learning algorithms, however, perform poorly in capturing small subpopulations from data sets with highly non-uniform cluster sizes due to the uniform effect.12,13 In particular, in the case of low yield measurements, most of the molecular classes are visible only after several steps of over-clustering.
Convolutional neural networks (CNN) are a class of artificial feed-forward neural networks with initial convolutional layers. These layers contain filters that are optimised to identify features in the input data that are characteristic for distinguishable classes. CNNs have been shown to be particularly powerful for image recognition tasks, and can be applied for the analysis of break-junction experiments, as breaking traces can be considered as 1D and 2D images. While the more commonly used unsupervised methods extract the average features of groups of traces, CNNs treat each breaking trace individually, and are thus useful for the identification of small subpopulations. Here, we describe a supervised deep learning approach, using CNNs, to improve the performance of the unsupervised clustering methods by initially removing tunnelling-only traces from the measurement set.
A convolutional neural network was trained to distinguish between tunnelling and molecular traces on a large dataset of roughly 200![[thin space (1/6-em)]](https://www.rsc.org/images/entities/char_2009.gif) 000 labeled breaking traces obtained for alkanedithiols, displaying very diverse breaking traces. A schematic of the chemical structure of the alkanedithiols is shown in the ESI,† Section S6. Once trained, this network is used to label and remove the tunnelling-only traces in sets of unseen breaking traces. We show that the network fulfills the important requirement of generalization, showing excellent performance for complete and unseen experimental datasets of different molecules with different anchoring groups and breaking traces.
000 labeled breaking traces obtained for alkanedithiols, displaying very diverse breaking traces. A schematic of the chemical structure of the alkanedithiols is shown in the ESI,† Section S6. Once trained, this network is used to label and remove the tunnelling-only traces in sets of unseen breaking traces. We show that the network fulfills the important requirement of generalization, showing excellent performance for complete and unseen experimental datasets of different molecules with different anchoring groups and breaking traces.
A single breaking trace describes the conductance of the junction at increasing electrode displacements. In the absence of bridging molecules, the junction conductance decays exponentially as the gap size between the electrodes increases, typical for direct tunnelling across a barrier of increasing length, as observed for the orange-colored traces in Fig. 1b. Target molecules can bridge the gold electrodes after rupture of the point contact, which is typically identified by the presence of a conductance plateau in the breaking trace, as seen in the green- and blue-colored traces in Fig. 1b. Fig. 1c shows a reduced feature space representation, obtained by applying principle component analysis, for the three-class measurement set recorded for hexanedithiol,14 shown in Fig. 1a. Due to the large amount of tunnelling traces, the measurement set shows a high variance in the dimensions describing tunnelling features, indicated by the large spread of the tunnelling class in Fig. 1c. A zoomed-in view around the origin (Fig. 1d) displays the large overlap of traces from the different configurations, complicating the separation of the different (molecular) configurations. The challenge is now to efficiently separate the molecular traces from the ones displaying tunneling only, after which unsupervised clustering methods can be utilized to capture only the variance in the molecular set.
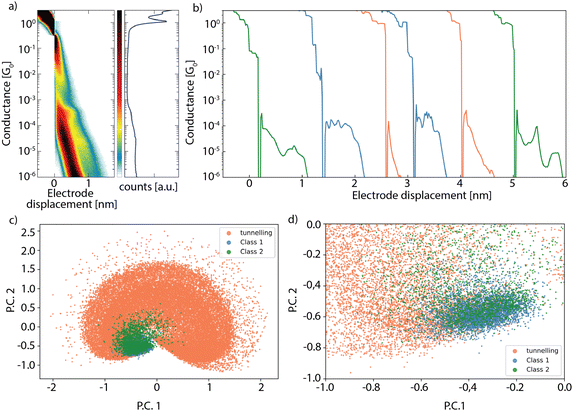 | ||
| Fig. 1 (a) Two-dimensional (left) and one-dimensional (right) conductance histograms built from a set of breaking traces recorded for hexanedithiol. The data is taken from ref. 14. (b) Examples of individual breaking traces showing three different configurations: tunneling (orange), single molecule (blue) and traces with plateau lengths larger than the molecule (green). (c) Reduced feature space of all the breaking traces in the dataset, obtained by applying principle component analysis (PCA). (d) Zoomed-in region in the reduced feature space, containing a mixture of traces from the three different configurations. | ||
2. Experimental: training data and network optimization
The neural network architecture used in this work was obtained from a small gridsearch through a hyperparameter space, considering both fully-connected neural networks and convolutional neural networks (CNN). The final network architecture chosen was a CNN consisting of two convolutional layers and two fully-connected layers. The presence of convolutional layers slightly increased the classification performance; additional convolutional layers were found to have a negligible effect, while increasing both the training and classification time. More rigorous optimization of the hyperparameters of the network (e.g. layer widths) was not performed, after similar performances for several architectures were observed. The convolutional layers were combined with a max-pooling layer to downsample the constructed feature maps and a ReLU activation function. The final output nodes were converted to normalized probabilities via a softmax activation function. Shifted threshold values of 0.60 and 0.40, for tunneling and molecular respectively, were used in the final softmax layer at the end of the network during classification, to decrease the probability of separating any molecular traces, which could jeopardize the ability to extract the complete picture from the subsequent statistical analysis of the molecular set.To train the neural networks, large training data sets (roughly 100![[thin space (1/6-em)]](https://www.rsc.org/images/entities/char_2009.gif) 000 traces per molecule) were used from a previous study of mechanically controlled break-junction (MCBJ) measurements on propanedithiol (ADT3), hexanedithiol (ADT6) and octanedithiol (ADT8), displaying a large variety of molecular traces.14 To label the data, we used an unsupervised learning algorithm to cluster the individual measurements sets into many (i.e. 100) subclasses. The classes displaying very clean tunnelling and molecular features were labeled accordingly. From these labelled sets, we constructed a training set with equal amounts of tunnelling and molecular traces and similar amounts of traces from ADT3, ADT6, and ADT8. Note that one could also collect large amounts of tunnelling traces from measurements of the bare gold samples. However, as the presence of molecules can influence the tunnel barrier between the electrodes,2 the used collection scheme might capture more diverse tunnelling behaviour.
000 traces per molecule) were used from a previous study of mechanically controlled break-junction (MCBJ) measurements on propanedithiol (ADT3), hexanedithiol (ADT6) and octanedithiol (ADT8), displaying a large variety of molecular traces.14 To label the data, we used an unsupervised learning algorithm to cluster the individual measurements sets into many (i.e. 100) subclasses. The classes displaying very clean tunnelling and molecular features were labeled accordingly. From these labelled sets, we constructed a training set with equal amounts of tunnelling and molecular traces and similar amounts of traces from ADT3, ADT6, and ADT8. Note that one could also collect large amounts of tunnelling traces from measurements of the bare gold samples. However, as the presence of molecules can influence the tunnel barrier between the electrodes,2 the used collection scheme might capture more diverse tunnelling behaviour.
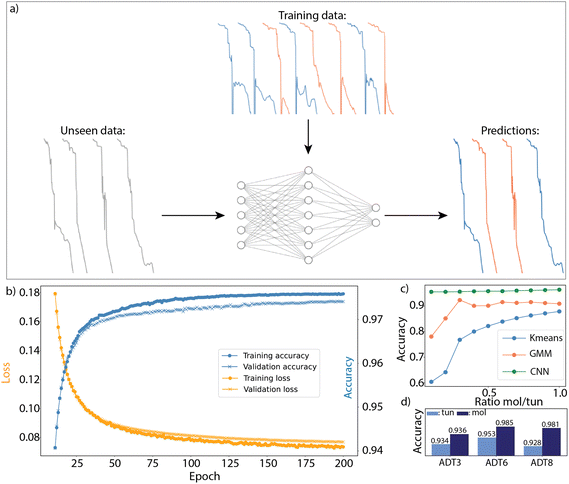
For each breaking trace the region within 0.5–1.0 × 10⁻⁶G0 (G0 = 2e2/h ≈ 77 μS), and within the 0.5–3 nm displacement range was transformed into a discrete feature vector using the histogram method explained in the ESI,† Section S1. These ranges were chosen since good initial results were obtained while the electrode displacement range includes most plateau lengths observed in the experiments. To train the networks, we exposed them to the labeled breaking traces, in batches of 1600 traces per iteration. The cross-entropy function was utilized to calculate the network loss, while the network parameters were optimized via the adaptive moment estimation (Adam) algorithm.15 80 percent of the labeled data was used to train the networks, while the remaining 20 percent was used to determine the generalization of the network. Fig. 2b displays the loss and network accuracy for both the training and validation sets as a function of epochs. A single epoch denotes a complete pass of the labeled data through the neural network, while updating its parameters. In order to visualize the difference between the training and validation curves, we omitted the first 10 epochs (reducing the loss and accuracy range of the plots). The full curves are shown in the ESI,† Section S2. A constant step-size of α = 10−3 was used together with exponential decay rates β1 = 0.9 and β2 = 0.999, and ε = 10−8. All models in this study were developed with the pytorch open source library.16
3. Results and discussion
3.1 Network generalization and benchmarking
The training curves in Fig. 2b show that our network achieves a very high accuracy in distinguishing between tunneling and molecular traces. The total amount of training cycles was set to 200, as the training curves fully converge at this stage. It can be seen that there is a very small difference between the training (dots) and validation (crosses) curves for both the loss and the accuracy during the network optimization, showing that our network generalizes well to unseen data without over-fitting.The breaking traces in the validation set are likely to display very similar features to the ones in the training set, since they are obtained using the same parameters (i.e. same sample and molecules). However, the model should also generalize well to measurement sets of different molecules, containing breaking traces with distinct shapes. To investigate the model's ability, we design the following test: first, we train the model based on only two chain lengths, and second we check the classification accuracy of the remaining compound. The classification performance after this training is summarized in Fig. 2d. The figure shows from left to right the classification accuracy of the network for ADT3 (trained on ADT6 and ADT8), ADT6 (trained on ADT3 and ADT8) and ADT8 (trained on ADT3 and ADT6). The CNN achieves excellent classification for all three molecules, with accuracies exceeding 95% for all of them, indicating that it generalizes the classification task well to unseen data. The network achieves higher accuracies for the molecular traces than for the tunneling traces, with higher accuracies (bars) reached on the molecular traces. This is likely the result of the network being penalized more for false classification of molecular traces than tunneling ones.
Additionally, the network performance was benchmarked against commonly used unsupervised techniques (K-means and Gaussian mixture model). For this benchmarking, the ratio between molecular and tunneling traces was varied, ranging from 1![[thin space (1/6-em)]](https://www.rsc.org/images/entities/char_2009.gif) :
:![[thin space (1/6-em)]](https://www.rsc.org/images/entities/char_2009.gif) 1 to 1
1 to 1![[thin space (1/6-em)]](https://www.rsc.org/images/entities/char_2009.gif) :
:![[thin space (1/6-em)]](https://www.rsc.org/images/entities/char_2009.gif) 10. The two-class clustering results of this benchmark are shown in Fig. 2c, displaying the classification performance, averaged over the three datasets, for the different methods and ratios. The full results, without averaging are shown in the ESI,† Section S4. Firstly, it can be seen that the unsupervised techniques work well when the amount of molecular and tunneling traces are similar. When the ratio between the two drops, the performance reduces drastically. For all molecules, the CNN outperforms the unsupervised methods significantly. The unsupervised methods take into account all the features in the breaking traces, diluting the features that are relevant and molecule-dependant with ones that are not, while the CNN learns to capture only the ones that are relevant for the distinction between tunneling and molecular.
10. The two-class clustering results of this benchmark are shown in Fig. 2c, displaying the classification performance, averaged over the three datasets, for the different methods and ratios. The full results, without averaging are shown in the ESI,† Section S4. Firstly, it can be seen that the unsupervised techniques work well when the amount of molecular and tunneling traces are similar. When the ratio between the two drops, the performance reduces drastically. For all molecules, the CNN outperforms the unsupervised methods significantly. The unsupervised methods take into account all the features in the breaking traces, diluting the features that are relevant and molecule-dependant with ones that are not, while the CNN learns to capture only the ones that are relevant for the distinction between tunneling and molecular.
As expected, the classification performance of the CNN remains also constant when varying the ratio of molecular traces to tunneling traces. In addition to the higher accuracy, the network, once trained, also outperforms the considered unsupervised two-class clustering techniques substantially in terms of time, by more than a factor 10. This becomes especially advantageous for large data sets.
3.2 Classification of complete and unseen data sets
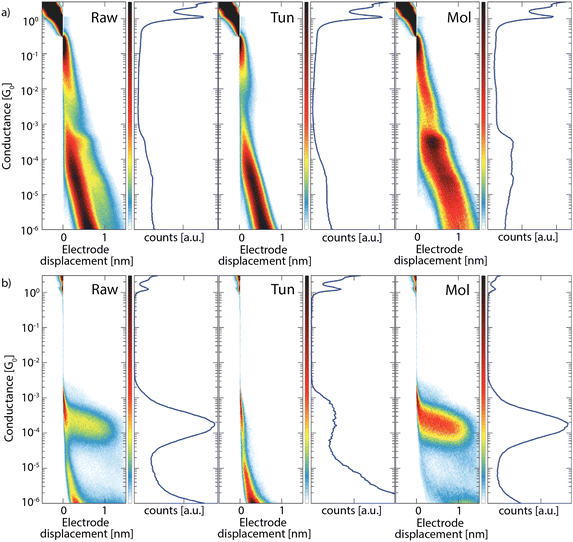
To date, the network has been tested on labeled datasets of selected breaking traces. To be useful in the analysis of breaking traces, the model will need to also achieve excellent classification for full experimental datasets, without any prior selection. To demonstrate the capabilities of our CNN model to do so, we applied it to several unfiltered experimental measurement sets. Fig. 3 displays the classification results obtained for measurements of ADT6 (a) and OPE3-diSAc (b), showing the conductance histograms obtained from the complete (raw) set, and the separated tunnelling (tun) and molecular (mol) sets. For ADT6, the network was trained on ADT3 and ADT8, while for OPE3-diSAc the network was trained on all three alkanedithiols.For both molecules, the tunnelling classes show clean exponentially decaying features, while the remaining set of traces show no clear tunneling features, indicating that the network separates only and most tunneling traces. These observations are also confirmed from a more detailed evaluation (see the ESI,† Section S3.1 and S3.2); subsequent clustering with k-means of the obtained tunnelling and molecular sets into 15 (ADT6) and 10 (OPE3-diSAc) subclasses shows that for ADT6, 97.5 percent of the tunneling traces are removed while zero molecular ones were discarded, and that for OPE3-diSAc, none of the traces have been wrongfully labeled by our network.
3.3 Influence of anchoring groups and switching traces
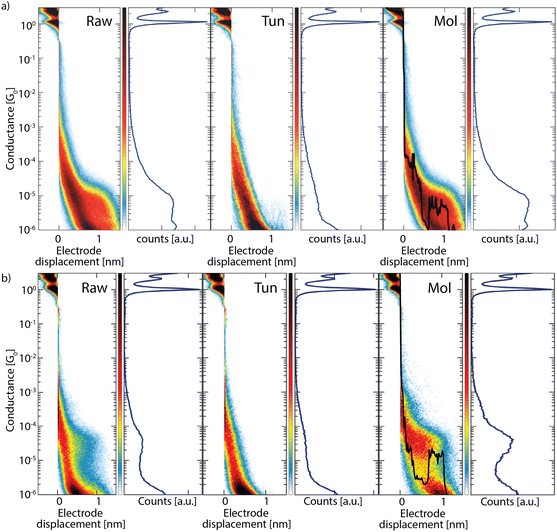
To further test the CNN generalization, we now consider datasets of OPE3 molecules with two different anchoring groups, pyridine (Pyr) and amino (NH2), measured in a recent study.17 A schematic of the chemical structure of the OPE3s is shown in the ESI,† Section S6. These anchoring groups result in a weaker binding of the molecule to the electrodes, which can influence the shape of the breaking traces.17 Additionally, the study showed that these datasets include large amounts of breaking traces for which the signal switches between tunneling and molecular signals. Among these a significant amount displays an initial exponentially decaying tunneling signal and only in the final part switches to an, often short, conductance plateau. Although these traces display tunneling features for a large portion, it is important that these traces are not considered as tunnelling by the CNN, as they provide valuable information on the formation of the molecular junctions.The classification results obtained for measurements on OPE3-Pyr (a) and OPE3-NH2 (b) are shown in Fig. 4. From the two-dimensional histograms it can be seen that the tunneling sets contain very little (OPE3-Pyr) or no (OPE3-NH2) molecular features (see also the ESI,† Section S3.3 and S3.4). The detailed evaluation in the ESI† shows that for OPE3-NH2, no molecular traces are separated, while for OPE-Pyr very few molecular traces were separated, and they only show very short jumps and do not display a significant molecular plateau. For both molecules, the histograms constructed from the remaining traces still display prominent exponentially decaying features. From the clustering evaluation, however, we find merely breaking traces that contain molecular plateaus. A large percentage of these traces display a tunneling part, followed by a jump to a molecular plateau, as reported in ref. 17. Individual example traces of this type have been added to the molecular histograms (Mol) of both molecules as black-lined overlay in Fig. 4. These results indicate the robustness of the model, achieving also excellent classification, without additional training, for breaking traces with different anchoring groups and even molecular traces with initially a tunneling signal.
3.4 Low molecular yield datasets
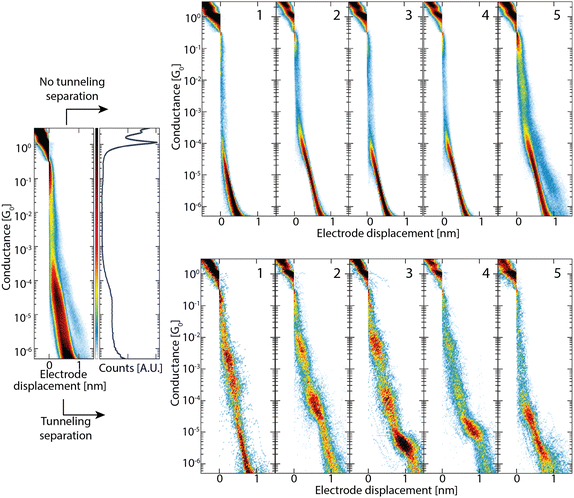
The initial separation of tunneling-only traces becomes particularly useful in the analysis of datasets exhibiting small amounts of molecular traces. To demonstrate this, we constructed a low-molecular yield ADT3 dataset from the clustering analysis performed in ref. 14, by including all the tunneling traces and removing all but 5 percent of the molecular ones. If the raw data are analysed directly, both the shape and position of the molecular conductance peak will be affected by the presence of tunneling traces.11,18,19 Furthermore, identification of the peak in the 1D histogram will become very challenging when the molecular yield is low. This can be seen in the leftmost panel of Fig. 5, displaying the conductance histograms constructed from the full low molecular yield dataset. No conductance peaks can be identified, while the dataset does show a clear set of multiple conductance peaks, as will be discussed shortly. When clustering analysis with k-means is performed on the low molecular-yield dataset, one often needs to use a high number of classes (overclustering) in order to resolve all of the molecular features. Fig. 5 shows the 5 classes obtained from the unsupervised learning algorithm in ref. 11 when initial tunneling traces are separated with the neural network (bottom) or not (top). After initial separation of the tunnelling traces, a five class clustering (K-means) suffices to distinguish the distinct breaking traces, in agreement with the results obtained in ref. 14. When the same procedure is employed on the full set, one only obtains tunnelling classes (classes 1 to 4) and one hybrid class (class 5). Only after clustering the data into roughly 20 classes, one starts obtaining molecular classes. For datasets exhibiting multiple molecular classes, one ends up typically overclustering also molecular classes, which then need to be merged back afterwards. Besides being time consuming, this process is prone to user-bias.4. Conclusion
In conclusion, we have demonstrated that a neural network approach can effectively separate tunnelling-only traces from break-junction measurement sets. By training our network on large and diverse training sets, it generalizes to full and unseen data of different molecules (both conjugated and non-conjugated backbones) and anchoring groups (strong and weak). Importantly, our network does not remove molecular traces and even molecular traces that switch from initial tunneling to a molecular plateau are labeled correctly. Our neural network approach greatly improves the analysis of low-yield measurement sets. The approach thus offers an efficient and accurate method to remove the tunneling-only traces from conductance vs. displacement data sets, leaving a set of molecular traces that can be further analyzed.Conflicts of interest
There are no conflicts to declare.References
- R. Frisenda, V. A. E. C. Janssen, F. C. Grozema, H. S. J. van der Zant and N. Renaud, Mechanically controlled quantum interference in individual-stacked dimers, Nat. Chem., 2016, 8, 1099–1104 CrossRef CAS PubMed.
- B. Capozzi, J. Xia, O. Adak, E. J. Dell, Z.-F. Liu, J. C. Taylor, J. B. Neaton, L. M. Campos and L. Venkataraman, Single-molecule diodes with high rectification ratios through environmental control, Nat. Nanotechnol., 2015, 10(6), 522–527 CrossRef CAS PubMed.
- E. Burzurí, Y. Yamamoto, M. Warnock, X. Zhong, K. Park, A. Cornia and H. S. J. van der Zant, Franck-condon blockade in a single-molecule transistor, Nano Lett., 2014, 14(6), 3191–3196 CrossRef PubMed.
- X. Li, J. He, J. Hihath, B. Xu, S. M. Lindsay and N. Tao, Conductance of single alkanedithiols: conduction mechanism and effect of molecule electrode contacts, J. Am. Chem. Soc., 2006, 128(6), 2135–2141 CrossRef CAS PubMed.
- Z. Li, L. Mejía, J. Marrs, H. Jeong, J. Hihath and I. Franco, Understanding the conductance dispersion of single-molecule junctions, J. Phys. Chem. C, 2020, 125(6), 3406–3414 CrossRef.
- R. Ramachandran, H. B. Li, W.-Y. Lo, A. Neshchadin, L. Yu and J. Hihath, An electromechanical approach to understanding binding configurations in single-molecule devices, Nano Lett., 2018, 18(10), 6638–6644 CrossRef CAS PubMed.
- Y. S. Park, A. C. Whalley, M. Kamenetska, M. L. Steigerwald, M. S. Hybertsen, C. Nuckolls and L. Venkataraman, Contact chemistry and single-molecule conductance:  a comparison of phosphines, methyl sulfides, and amines, J. Am. Chem. Soc., 2007, 129(51), 15768–15769 CrossRef CAS PubMed.
- W. Hong, D. Z. Manrique, P. Moreno-García, M. Gulcur, A. Mishchenko, C. J. Lambert, M. R. Bryce and T. Wandlowski, Single molecular conductance of tolanes: Experimental and theoretical study on the junction evolution dependent on the anchoring group, J. Am. Chem. Soc., 2012, 134(4), 2292–2304 CrossRef CAS PubMed.
- R. Frisenda. OPE3: a model system for single-molecule transport. PhD thesis, Delft University of Technology, 2016 Search PubMed.
- W. Haiss, S. Martín, E. Leary, H. van Zalinge, S. J. Higgins, L. Bouffier and R. J. Nichols, Impact of junction formation method and surface roughness on single molecule conductance, J. Phys. Chem. C, 2009, 113(14), 5823–5833 CrossRef CAS.
- D. Cabosart, M. El Abbassi, D. Stefani, R. Frisenda, M. Calame, H. S. J. van der Zant and M. L. Perrin, A reference-free clustering method for the analysis of molecular break-junction measurements, Appl. Phys. Lett., 2019, 114(14), 143102 CrossRef.
- J. Wu, The uniform effect of k-means clustering, 2012 Search PubMed.
- K. Zhou and S. Yang, Effect of cluster size distribution on clustering: a comparative study of k-means and fuzzy c-means clustering, Pattern Anal. Appl., 2020, 23, 455–466 CrossRef.
- F. H. van Veen, L. Ornago, H. S. J. van der Zant and M. El Abbassi, Benchmark study of alkane molecular chains, J. Phys. Chem. C, 2022, 126(20), 8801–8806 CrossRef CAS.
- D. P. Kingma and J. Ba, Adam: A method for stochastic optimization, 2014 Search PubMed.
- A. Paszke, S. Gross, F. Massa, A. Lerer, J. Bradbury, G. Chanan, T. Killeen, Z. Lin, N. Gimelshein, L. Antiga, A. Desmaison, A. Köpf, E. Yang, Z. DeVito, M. Raison, A. Tejani, S. Chilamkurthy, B. Steiner, L. Fang, J. Bai and S. Chintala, PyTorch: An Imperative Style, High-Performance Deep Learning Library, in Advances in Neural Information Processing Systems 32, ed. H. Wallach, H. Larochelle, A. Beygelzimer, F. d’Alché-Buc, E. Fox and R. Garnett, 2019, Curran Associates, Inc., pp. 8024–8035 Search PubMed.
- L. Ornago, J. Kamer, M. El Abbassi, F. C. Grozema and H. S. J. van der Zant, Switching in nanoscale molecular junctions due to contact reconfiguration, J. Phys. Chem. C, 2022, 126(46), 19843–19848 CrossRef CAS.
- B. Gotsmann, H. Riel and E. Lörtscher, Direct electrode-electrode tunneling in break-junction measurements of molecular conductance, Phys. Rev. B: Condens. Matter Mater. Phys., 2011, 84, 205408 CrossRef.
- P. D. Williams and M. G. Reuter, Level alignments and coupling strengths in conductance histograms: The information content of a single channel peak, J. Phys. Chem. C, 2013, 117(11), 5937–5942 CrossRef CAS.
Footnote |
| † Electronic supplementary information (ESI) available. See DOI: https://doi.org/10.1039/d3tc02346j |
| This journal is © The Royal Society of Chemistry 2023 |

