
Quantitative structural assessments of potential meprin β inhibitors by non-linear QSAR approaches and validation by binding mode of interaction analysis†
Suvankar
Banerjee
 a,
Sandip Kumar
Baidya
a,
Balaram
Ghosh
b,
Suvendu
Nandi
c,
Mahitosh
Mandal
c,
Tarun
Jha
*a and
Nilanjan
Adhikari
*a
a,
Sandip Kumar
Baidya
a,
Balaram
Ghosh
b,
Suvendu
Nandi
c,
Mahitosh
Mandal
c,
Tarun
Jha
*a and
Nilanjan
Adhikari
*a
aNatural Science Laboratory, Division of Medicinal and Pharmaceutical Chemistry, Department of Pharmaceutical Technology, Jadavpur University, Kolkata 700032, India. E-mail: tjupharm@yahoo.com; nilanjan_juphar@rediffmail.com
bEpigenetic Research Laboratory, Department of Pharmacy, Birla Institute of Technology and Science-Pilani, Hyderabad Campus, Shamirpet, Hyderabad, 500078, India
cCancer Biology Laboratory, School of Medical Science & Technology, Indian Institute of Technology Kharagpur, Kharagpur, West Bengal 721302, India
First published on 17th February 2023
Abstract
The Zn2+-dependent endopeptidase meprin β is an astacin family metalloenzyme that belongs to the metzincin superclass of metalloproteases. The presence of a wide variety of meprin β substrates has enabled this metalloenzyme to influence a range of biological pathways and processes that correspondingly correlate meprin β with several diseases and abnormal physiological conditions. The influences of the meprin β proteolytic activity have been observed in cancer, neurodegenerative disorders, hyperkeratosis, and inflammatory conditions, including fibrosis. Therefore, the development of effective inhibitors is an achievable method for therapeutic advancement against meprin β-related pathophysiological conditions. In this context, in this study, a combined quantitative structural assessment of a set of meprin β inhibitors is performed via fragment-based non-linear pattern recognition techniques and the binding mode of interaction analysis at the active site of the enzyme. This study has elucidated various structural attributes such as the presence of a chiral center, the orientation of halogenic groups, hydroxyl and carbonyl functions, and the effect of aryl sulfonamide moieties along with their effect on the binding of these compounds at the active site. Depending on the present outcomes, some new molecules were designed and these were highly effective meprin β inhibitors. The molecular dynamics (MD) simulation study also revealed the stability of both the best active and the designed compound at the meprin β active site. Therefore, the findings of this current study as well as the developed non-linear machine learning (ML) models of these meprin β inhibitors can be a valuable tool to identify and design potent and effective inhibitors for the treatment of meprin β-related pathophysiological conditions.
1. Introduction
The study of the metalloenzymes in normal and pathophysiological conditions has elucidated several crucial involvements of these enzymes in a wide range of disease states, including cancer, neurodegenerative disorders, inflammation, osteoarthritis, cardiovascular diseases, viral and parasitic infections, as well as in epigenetic abnormalities.1–7 Although several attempts were made to develop potential and selective inhibitors of such metalloenzymes, a few novel molecules have been approved to date for targeting such metalloenzyme-related pathophysiology and associated disease conditions.8Among these metalloenzymes, the Zn2+-dependent metalloenzyme meprin β is one of the metzincin superfamily proteases that modulates several substrates such as procollagen I, collagen IV, triggered receptor expressed on myeloid cells 2 (TREM 2), interleukin (IL)-6R, cluster of differentiation (CD) 109, CD99, MUC-2, amyloid precursor protein (APP), E-cadherin, and IL-1β.9,10 Meprin metalloenzyme was first discovered in mouse kidneys and human intestines in 1980.10 Both the meprin family members, i.e., meprin α and meprin β are the Zn2+-dependent multi-domain proteases that belong to the astacin family of the metzincin endo-peptidase superfamily.9–12 The structure of meprin β consists of an N-terminal signal peptide followed by a pro-peptide domain, an astacin-like protease domain consisting of a Zn2+-dependent catalytic active site, a meprin A5 protein tyrosine phosphatase μ (MAM) domain, a tumor necrosis factor receptor-associated factor (TRAF) domain, an epidermal growth factor (EGF)-like domain, and a transmembrane (TM) domain as well as a cytosolic tail at the C-terminal of the enzyme (Fig. 1).9,10 The meprin α, on the other hand, possesses an inserted domain between the TRAF and the EGF domain, which is absent in the meprin β isoform.9,10
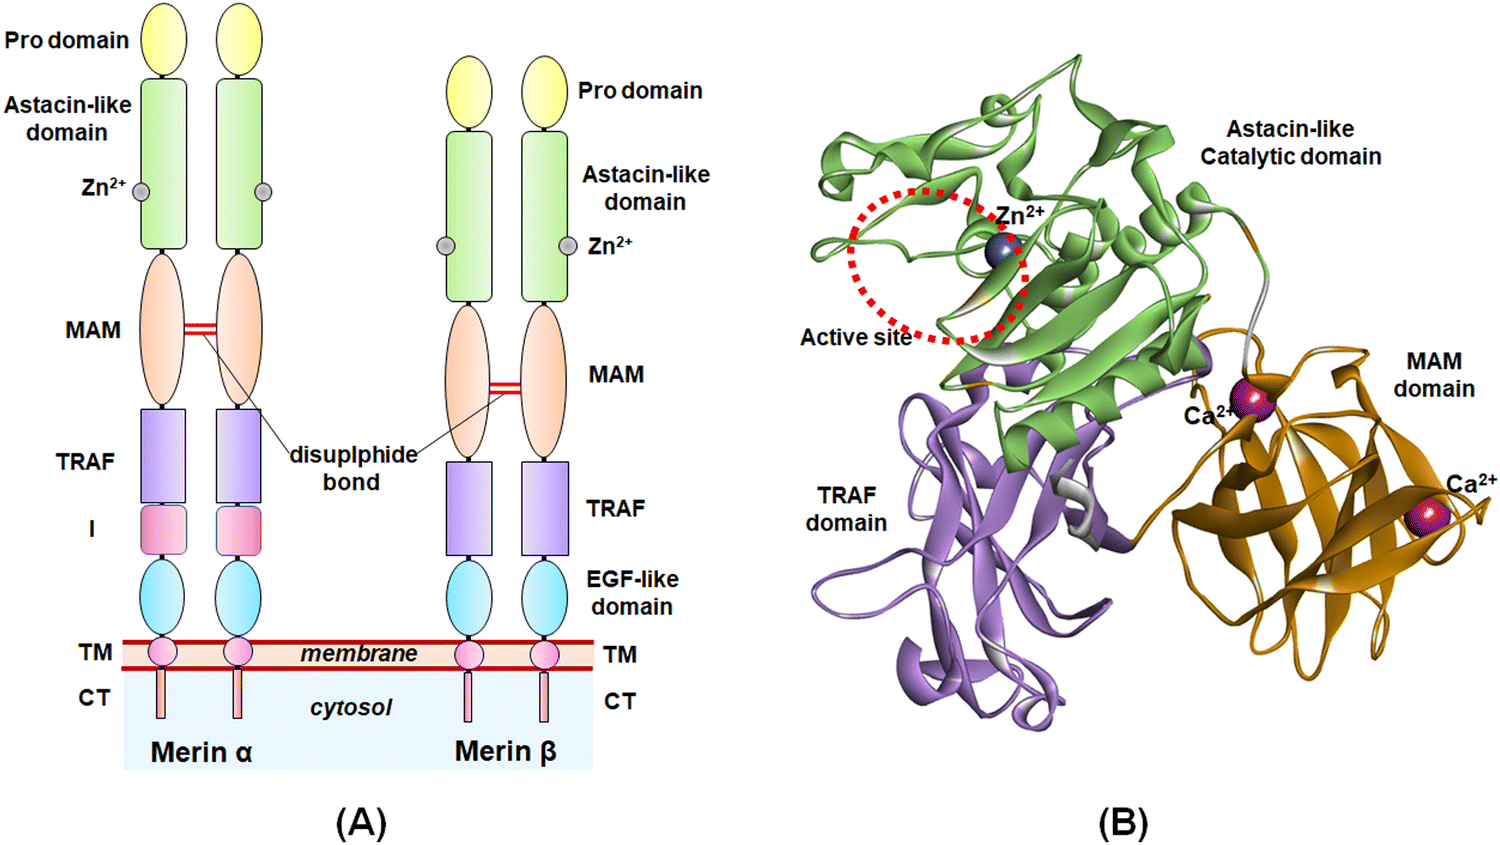 | ||
| Fig. 1 (A) General structure of meprin isoforms based on multidomain structure; (B) 3D-cartoon structure of the catalytic, MAM, and TRAF domains of the meprin β isoform. | ||
Because of targeting a wide variety of substrates, meprin β influences various diverse biological processes9,10 such as maintenance of the human granulocyte IL-6R pathways,13 collagen deposition in the skin,14 lung fibrosis,15 trans-endothelial cellular migration,16 TREM-2-mediated regulation of macrophage phagocytic potential,17 neurotoxic amyloid β (Aβ) levels,18 mucus regulation via MUC-2,19 as well as inflammation mechanisms.20,21 Consequently, meprin β also contributes to several pathological conditions and diseases such as inflammation,9,10,20,21 fibrosis,9,10 neurodegenerative diseases like Alzheimer's disease (AD),9,10,18 hyperkeratosis,22 glomerulonephritis,23 diabetic kidney injury24 as well as inflammatory bowel diseases25 and cancer.9,10 However, surprisingly, no potential inhibitors have been marketed to date despite such a huge role of meprin β in several diseases. Therefore, considering the importance of meprin β in such crucial disease conditions mentioned above, newer potential meprin β inhibitors should be designed and evaluated for further clinical development.
Since the first implication of the quantitative structure-activity relationship (QSAR) study by Hansch and co-workers,26 this method was widely applied in the field of drug discovery and related research. The QSAR approach has been widely employed in the field of drug design and development because of its capability to correlate the quantifiable structural attributes of a given set of bioactive molecules with their respective activity by mathematical equations.27 This is a crucial and frequently used technique to identify the important structural features of molecules that are the key contributors to their biological potency. As time progresses, apart from the earlier conventional methods, machine learning (ML) approaches have been frequently employed for such correlation, pattern recognition, and identification.28–30 The method of ML is a part of artificial intelligence (AI) that focuses on the utilization of computational algorithms and mathematical equations to learn from existing data to perform specific tasks such as prediction of the biological behaviour of a chemical entity or identification of specific substances based on regression, classification, clustering as well as pattern recognition.28 Over the last few years, the application of ML methods has gained attention in pharmaceutical and drug development research.30 From the aforementioned roles and contributions of the meprin β enzyme, developing and designing effective meprin β inhibitors are a highly viable approach for treating diseases related to its mechanisms of proteolytic activity. Nevertheless, the available small molecule inhibitors of meprin β have not yet been fully explored, which can provide a perspective and information regarding the structural requirements for potential meprin β inhibitor development. Therefore, in this study, ML techniques followed by the binding mode of interaction analysis have been conducted to extract the crucial structural attributes of these meprin β inhibitors regulating the biological potency and interactions at the active site of the enzyme.
2. Materials and methods
To conduct this study, a set of 107 hydroxamic acid-based small molecules with a quiet range of in vitro meprin β inhibitory activity (IC50 ranging from 23 nM to 132![[thin space (1/6-em)]](https://www.rsc.org/images/entities/char_2009.gif) 500 nM) were cumulated from the literature (ESI,† Tables S1 and S2).31–33 The 3D structures of the dataset compounds were obtained from the binding database along with their biological activities.34
500 nM) were cumulated from the literature (ESI,† Tables S1 and S2).31–33 The 3D structures of the dataset compounds were obtained from the binding database along with their biological activities.34
Before the calculation of descriptors, the structural refinements of these 107 meprin β inhibitors were performed by utilizing the ‘prepare ligands for QSAR’ module of discovery studio 3.0 software.35 The PaDEL Descriptor software was employed for the calculation of descriptors of these inhibitors.36 A total of 1444 2D descriptors were computed for each molecule with the help of PaDEL Descriptor software.36 Additionally, the employment of fragment-based molecular descriptors has increased over the years, where fragment-based drug designing has successfully led to the development of newer drug entities. Therefore, besides the 1444 2D PaDEL descriptors, the PubChem fingerprint features (881 bits), and the Klekota–Roth fingerprint (4660 bits) features were also calculated.36–38 In this study, three different types of features are used. Three different combinations of feature sets were used for this study such as feature set-A containing only PaDEL descriptors, feature set-B containing the PaDEL descriptors, and the PubChem fingerprint features as well as feature set-C containing the PaDEL and the Klekota–Roth features.
Regarding the dataset pre-processing, to remove the highly correlated features, a correlation cut-off value of 0.90 was used, whereas to eliminate the constant features with no variance, a covariance threshold of 0.001 was set for the dataset pre-treatment process.39,40
Furthermore, dataset division is a crucial process for the construction and validation of any QSAR model. In this study, to make a balanced dataset division, several elemental molecular properties, namely lipophilicity (AlogP), molecular weight (MW), the molecular polar surface area (MPSA), number of hydrogen bond donor groups (nHBD), number of hydrogen bond acceptor groups (nHBA), number of atoms (nAtoms), number of rings (nR), number of aromatic rings (nAr), and number of fragments (nFrag) were used for the development of the training and test sets. A ratio of 75:25 for the training and test set populations was maintained by using the random per cluster (RPC) method from the ‘generate training and test data’ module of Discovery Studio 3.0 software.35 The distribution of meprin β inhibitory activity for the training and the test sets are provided in Fig. 2(A) and (B).
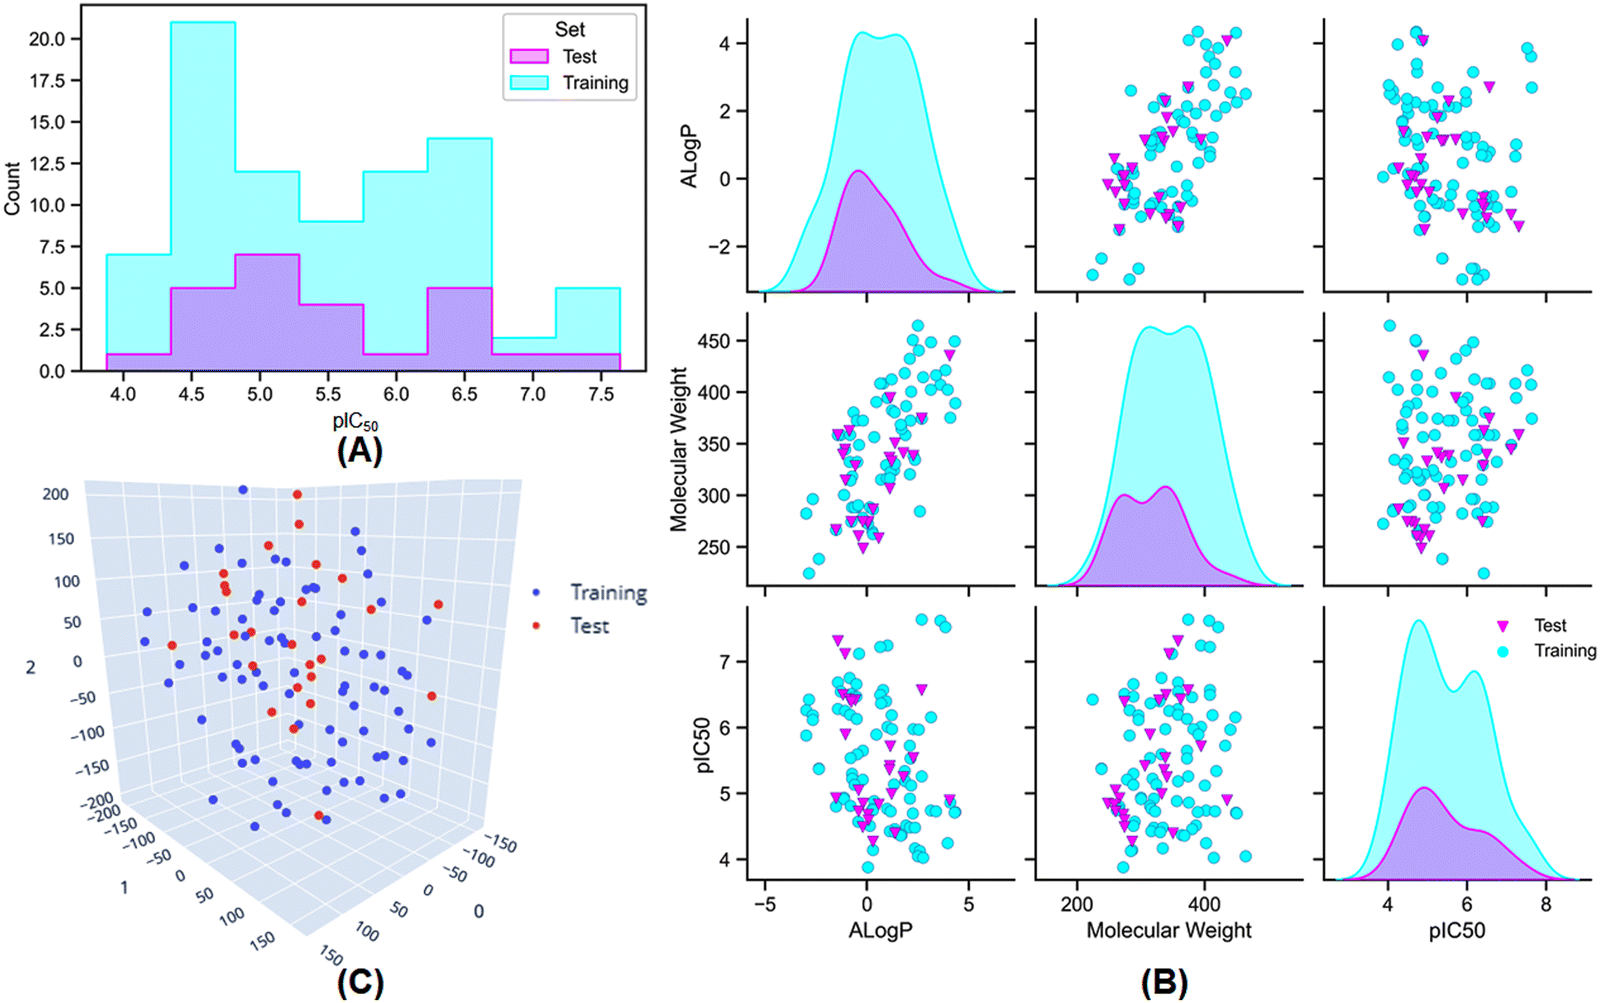 | ||
| Fig. 2 (A) The distribution of meprin β inhibitory activity for the training and the test set; (B) the distribution of the training and the test set molecules based on their lipophilicity (AlogP), molecular weight (MW), and the biological activity (pIC50); (C) the t-Distributed Stochastic Neighbour Embedding (t-SNE) analysis of the training and the test set molecules based on their physicochemical properties used for the dataset division process. | ||
Additionally, AlogP, MW, and activity (pIC50) distribution (Fig. 2(B)) and t-Distributed Stochastic Neighbour Embedding (t-SNE) analysis (Fig. 2(C)) was also performed using the above-mentioned physicochemical properties to verify the distribution of the dataset molecules for the training and the test sets.
2.1. Feature selection and model development
In the feature selection process, for each set of features (i.e., feature set-A, feature set-B, and feature set-C), the stepwise multiple linear regression method41 was used with an F value of 4.00 for inclusion and F value of 3.90 for exclusion to correlate and extract the final set of features for the training set molecules.39,402.2. Development of machine learning models
For this study, four different machine learning methods42,43 such as k-nearest neighbour (k-NN),42–44 random forest (RF),45,46 artificial neural network (ANN),47,48 and support vector machine (SVM)49–51 methods have been used to learn the selected features.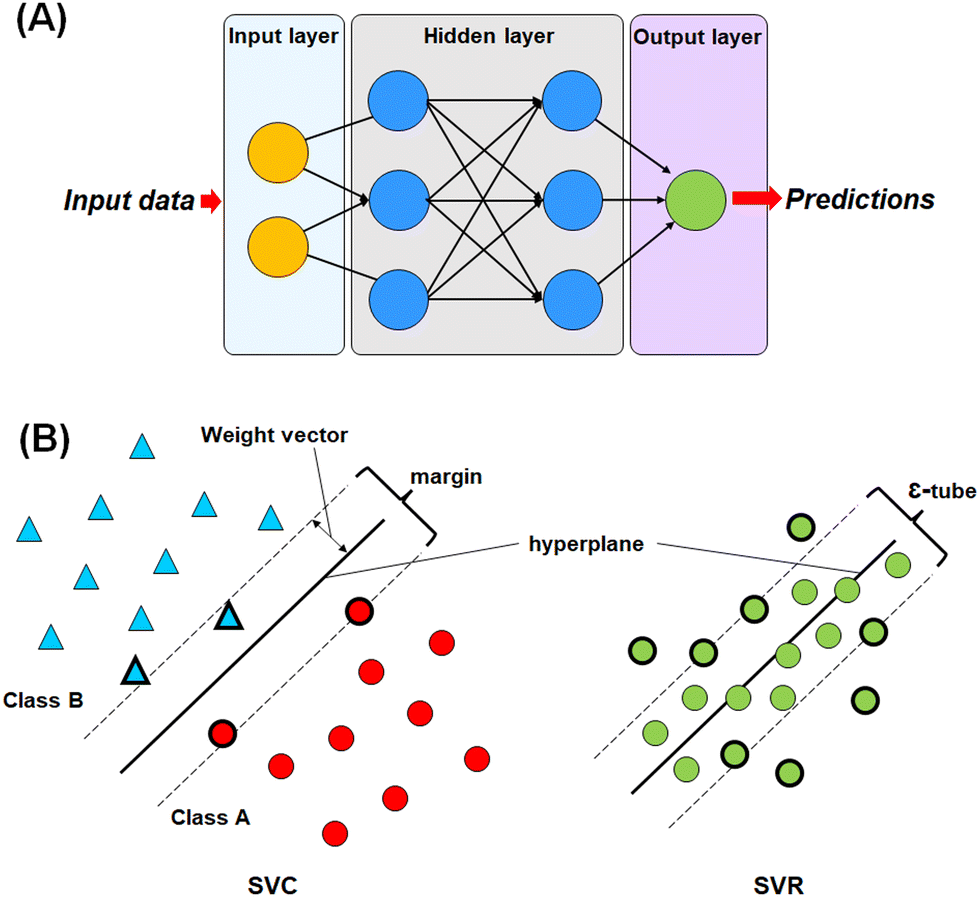 | ||
| Fig. 3 (A) Graphical representation of the artificial neural network (ANN); (B) graphical representation of the different compositions of the support vector classifier (SVC) and support vector regressor (SVR). | ||
The most commonly used ANN method is the back propagation-based neural network (BPNN), which is a feed-forward neural network (FFNN) system with a back-propagation error during the training. This type of neural network is widely applied in the field of QSAR and drug development studies.50,51,55–57
In SVM, a hyperplane can be described as a feature subspace representing the classification boundary. The margin represents the distance between two object classes separated by the SVM in the feature space, whereas the ε-insensitive tube in the support vector regression method represents the tolerance in numerical value prediction where larger deviations greater than the ε are penalized. SVM models use the kernel function to develop nonlinear SVM instead of explicitly mapping the data to the higher dimensional space, which is known as kernel tricks.55 A kernel function k (x, y) can be easily represented as:
| k (x, y) = {Ø(x) × Ø(y)} | (1) |
Here, in this study, WEKA 3.858 software is utilized to construct the machine learning models on the training set that were evaluated externally using the test set population.
2.3. Evaluation of model performance
The performance of the machine learning models and their learning capability were evaluated based on their squared correlation coefficient value and the corresponding root mean square error (RMSE) values and the Leave-one-out (LOO) cross-validation process for the training set.43,59 The predictive capability of these models for the training data was investigated by calculating their LOO-cross-validated R2 (Q2) values, whereas the external predictability was evaluated by the externally cross-validated R2 values for the test set compounds.43,59 The values for the Q2 and RMSE were calculated using the following equations: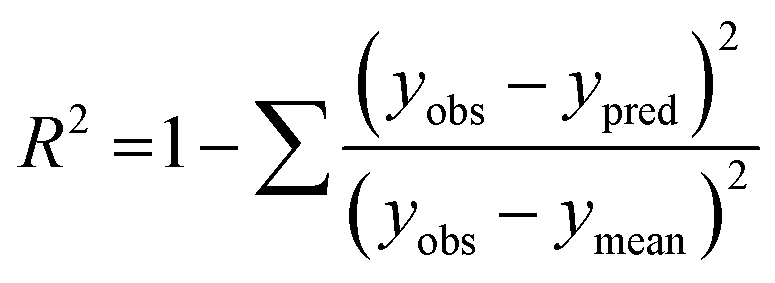 | (2) |
 | (3) |
2.4. Molecular dynamic (MD) simulation study
The optimum docking pose of the most active compound (compound 7) and the designed compound P-1 were subjected to a 100 ns molecular dynamic (MD) simulation analysis at the meprin β active site (PDB ID: 7AQ1) using the GROMACS (Version 2022.1) software.60,61 For the MD simulation of the complexes, the CHARMM36 force field62 with CHARMM-modified TIP3P water model (TIP3P CHARMM) water was taken into consideration. The CGenFF web server that utilizes the CHARMM general force field (CGenFF) algorithm was used to generate the ligand topology.63 The complexes were simulated in an isotonic condition (NaCl solution concentration = 0.15 N) under neutral pH (7.0). The sodium (Na+) and chloride (Cl−) ions were utilized to neutralize the system. A 5000-step energy reduction process using the steepest descent approach was completed, followed by a two-step equilibration process. The Parrinello–Rahman barostat and modified Berendsen thermostat64,65 performed 100 ps NVT and 100 ps NPT equilibrations.66 Additionally, a 300 K temperature was maintained for the system with LINCS during the MD simulation. The Particle-Mesh Ewald (PME) algorithms were used to calculate the long-range electrostatic interactions. A 2 fs integration time step size was used for the MD simulation study. The radius of gyration (Rg), hydrogen bond (H-bond) occupancy, root mean square deviation (RMSD), and root mean square fluctuation (RMSF) from the simulation study were calculated for further analysis as well as the molecular mechanics with generalized Born and surface area solvation (MM/GBSA) analysis67 was also performed for this study.3. Results and discussion
3.1. Feature selection
The primary function of executing the feature selection process is to eliminate redundant features while retaining the most relevant and important ones. Here, the S-MLR-based feature selection method was used41 to identify the important molecular descriptors for the dataset molecules (ESI,† Tables S3–S5). Additionally, the evaluation of the reliability and robustness of the selected features was performed by constructing MLR models (ESI,† Table S6).3.2. Model optimization
The optimization of the ML model learning parameters is a crucial step in optimizing the model performances. In this study, the number of neighbours, along with the number of trees in the random forest, was optimized for the k-NN and the RF models using WEKA 3.8 software.58 Again, the complexity (C) and the width (γ) of the radial basis function (RBF) kernel with an epsilon value of 0.001 for the SVM model. Additionally, the learning rate, momentum, number of nodes in the hidden layer as well as the number of epochs parameters were considered for optimization of the ANN model. Here, AUTOWEKA 1.0 software51 is used to optimize the SVM and the ANN models. Finally, the optimized ML models were selected based on their Q2, LOO-cross-validated RMSE, R2, and RMSE values.593.3. Evaluation of ML model performance
All of the ML models constructed for each of the feature sets (feature set-A, feature set-B, and feature set-C) on the training set population (NTraining = 82) were compared based on their internally cross-validated Q2 and R2Pred values for the test set compounds to evaluate their reliability and performance.43,59 The statistical performance of these constructed ML models is given in Table 1.| Model type | Feature set | R 2 | RMSE | Q 2 | RMSELOO-CV | R 2 Pred | RMSEPred |
|---|---|---|---|---|---|---|---|
| k-NN | Set-A | 0.805 | 0.421 | 0.729 | 0.495 | 0.749 | 0.484 |
| Set-B | 0.995 | 0.064 | 0.772 | 0.468 | 0.767 | 0.527 | |
| Set-C | 0.922 | 0.271 | 0.741 | 0.509 | 0.574 | 0.670 | |
| RF | Set-A | 0.969 | 0.189 | 0.752 | 0.481 | 0.827 | 0.411 |
| Set-B | 0.972 | 0.177 | 0.790 | 0.443 | 0.812 | 0.411 | |
| Set-C | 0.964 | 0.193 | 0.740 | 0.485 | 0.769 | 0.451 | |
| ANN | Set-A | 0.843 | 0.377 | 0.880 | 0.329 | 0.737 | 0.470 |
| Set-B | 0.902 | 0.301 | 0.837 | 0.386 | 0.792 | 0.405 | |
| Set-C | 0.912 | 0.290 | 0.819 | 0.410 | 0.701 | 0.500 | |
| SVM | Set-A | 0.870 | 0.354 | 0.857 | 0.369 | 0.772 | 0.441 |
| Set-B | 0.906 | 0.292 | 0.874 | 0.338 | 0.768 | 0.437 | |
| Set-C | 0.917 | 0.277 | 0.822 | 0.404 | 0.676 | 0.503 | |
From the analysis, it was observed that the feature set-B containing the combination of PaDEL 2D descriptors and the PubchemFP features was capable of describing the variance of the activity for these meprin β inhibitors both internally and for the test set for the k-NN, SVM, and the ANN models. Moreover, in the case of the RF models, feature set-A having the PaDEL 2D descriptors was found to have the highest capability to explain the test set molecules (R2Pred = 0.827).
From the k-NN model development, the k-NN model constructed with feature set-B exhibited R2 and Q2 values of 0.995 and 0.772, respectively, for the training set and internal cross-validation while having an R2Pred value of 0.767 for the test set with an optimum number of neighbour = 1 (Fig. 4).
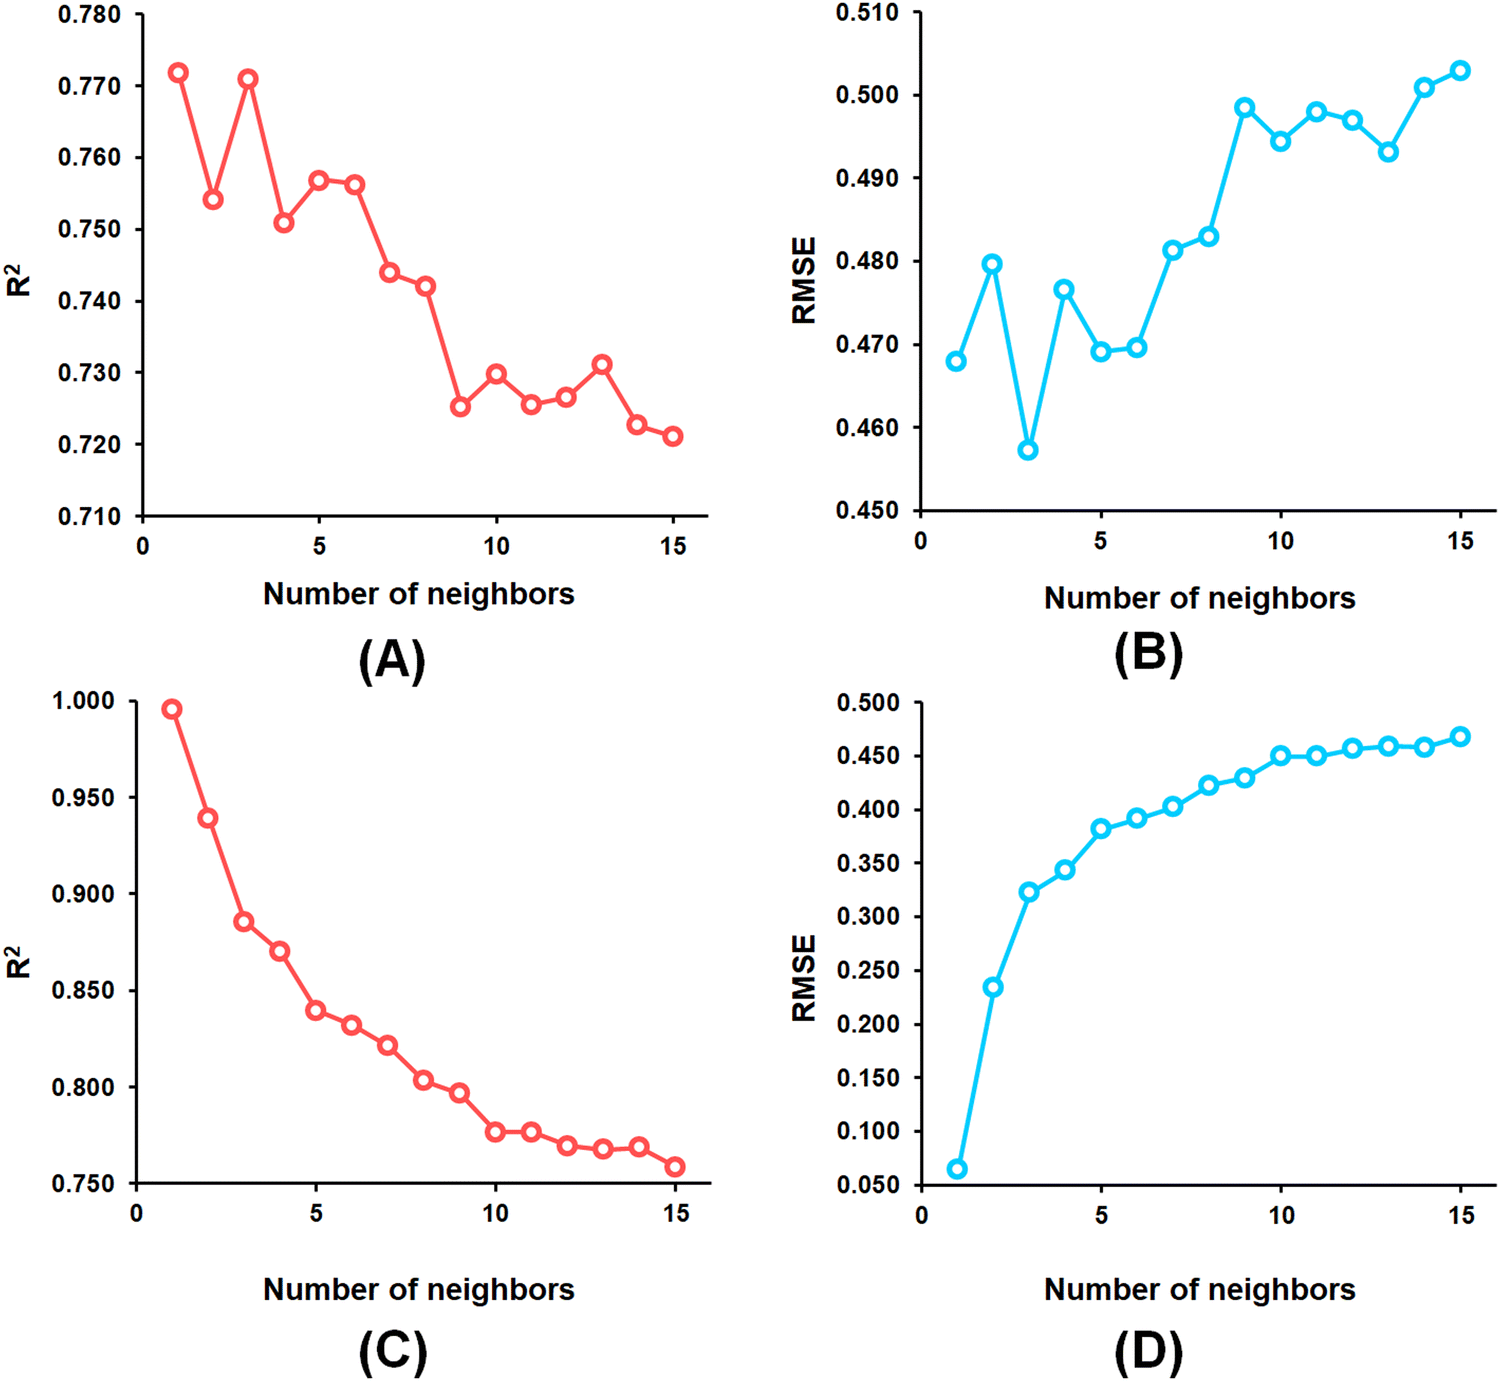 | ||
| Fig. 4 (A) k-NN parameter optimization involving the number of neighbours and LOO-cross-validated R2 (Q2) for the feature set-B; (B) k-NN parameter optimization involving the number of neighbours and LOO-cross-validated RMSE for the feature set-B; (C) k-NN parameter optimization involving the number of neighbours and training set R2 for the feature set-B; (D) k-NN parameter optimization involving the number of neighbours and training set RMSE for the feature set-B. | ||
Among the random forest (RF) models, it was noticed that the optimized RF model constructed having number of trees = 60 (Fig. 5) delivered Q2 and R2Pred values of 0.752 and 0.827, respectively, for the internal cross-validation as well as for predicting the test set compounds while having an R2 value of 0.967 for the training set compounds.
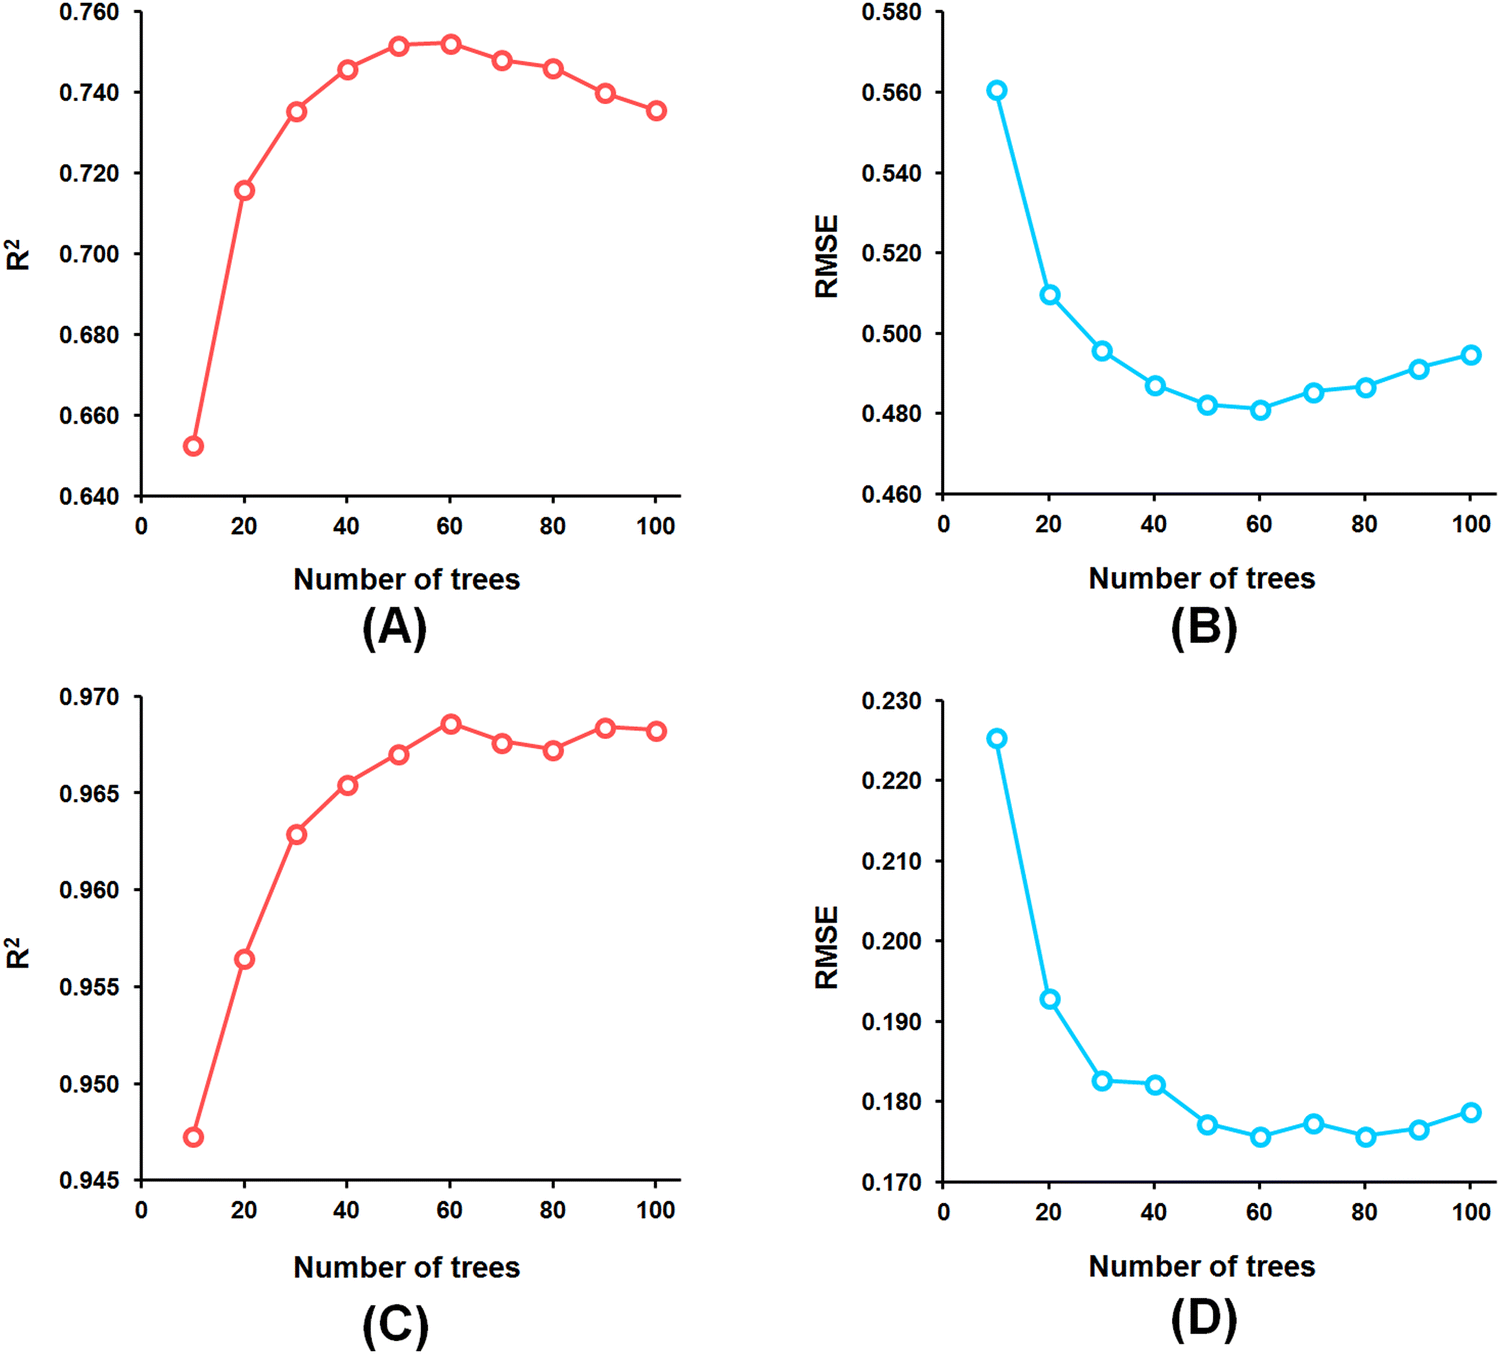 | ||
| Fig. 5 (A) RF model parameter optimization involving the number of trees and LOO-cross-validated R2 (Q2) for the feature set-B; (B) RF model parameter optimization involving the number of trees and LOO-cross-validated RMSE for the feature set-B; (C) RF model parameter optimization involving the number of trees and training set R2 for the feature set-B; (D) RF model parameter optimization involving the number of trees and training set RMSE for the feature set-B. | ||
From the developed ANN models, the optimized ANN model was constructed using the feature set-B with an optimal number of the hidden layer of 1, learning rate of 0.1, momentum of 0.3, and the optimal number of epochs of 30 (Fig. 6(A)–(E)), which showed R2, Q2, and R2Pred values of 0.902, 0.837, and 0.792 for the training set, internal cross-validation, and the test set, respectively. Finally, for the SVM models, the model constructed using the feature set-B and epsilon of 0.001 with an optimal C of 32 and optimal γ value of 0.0078125 delivered an R2 value of 0.906 and Q2 of 0.874 along with an R2Pred of 0.768 for the test set (Fig. 6(F)).
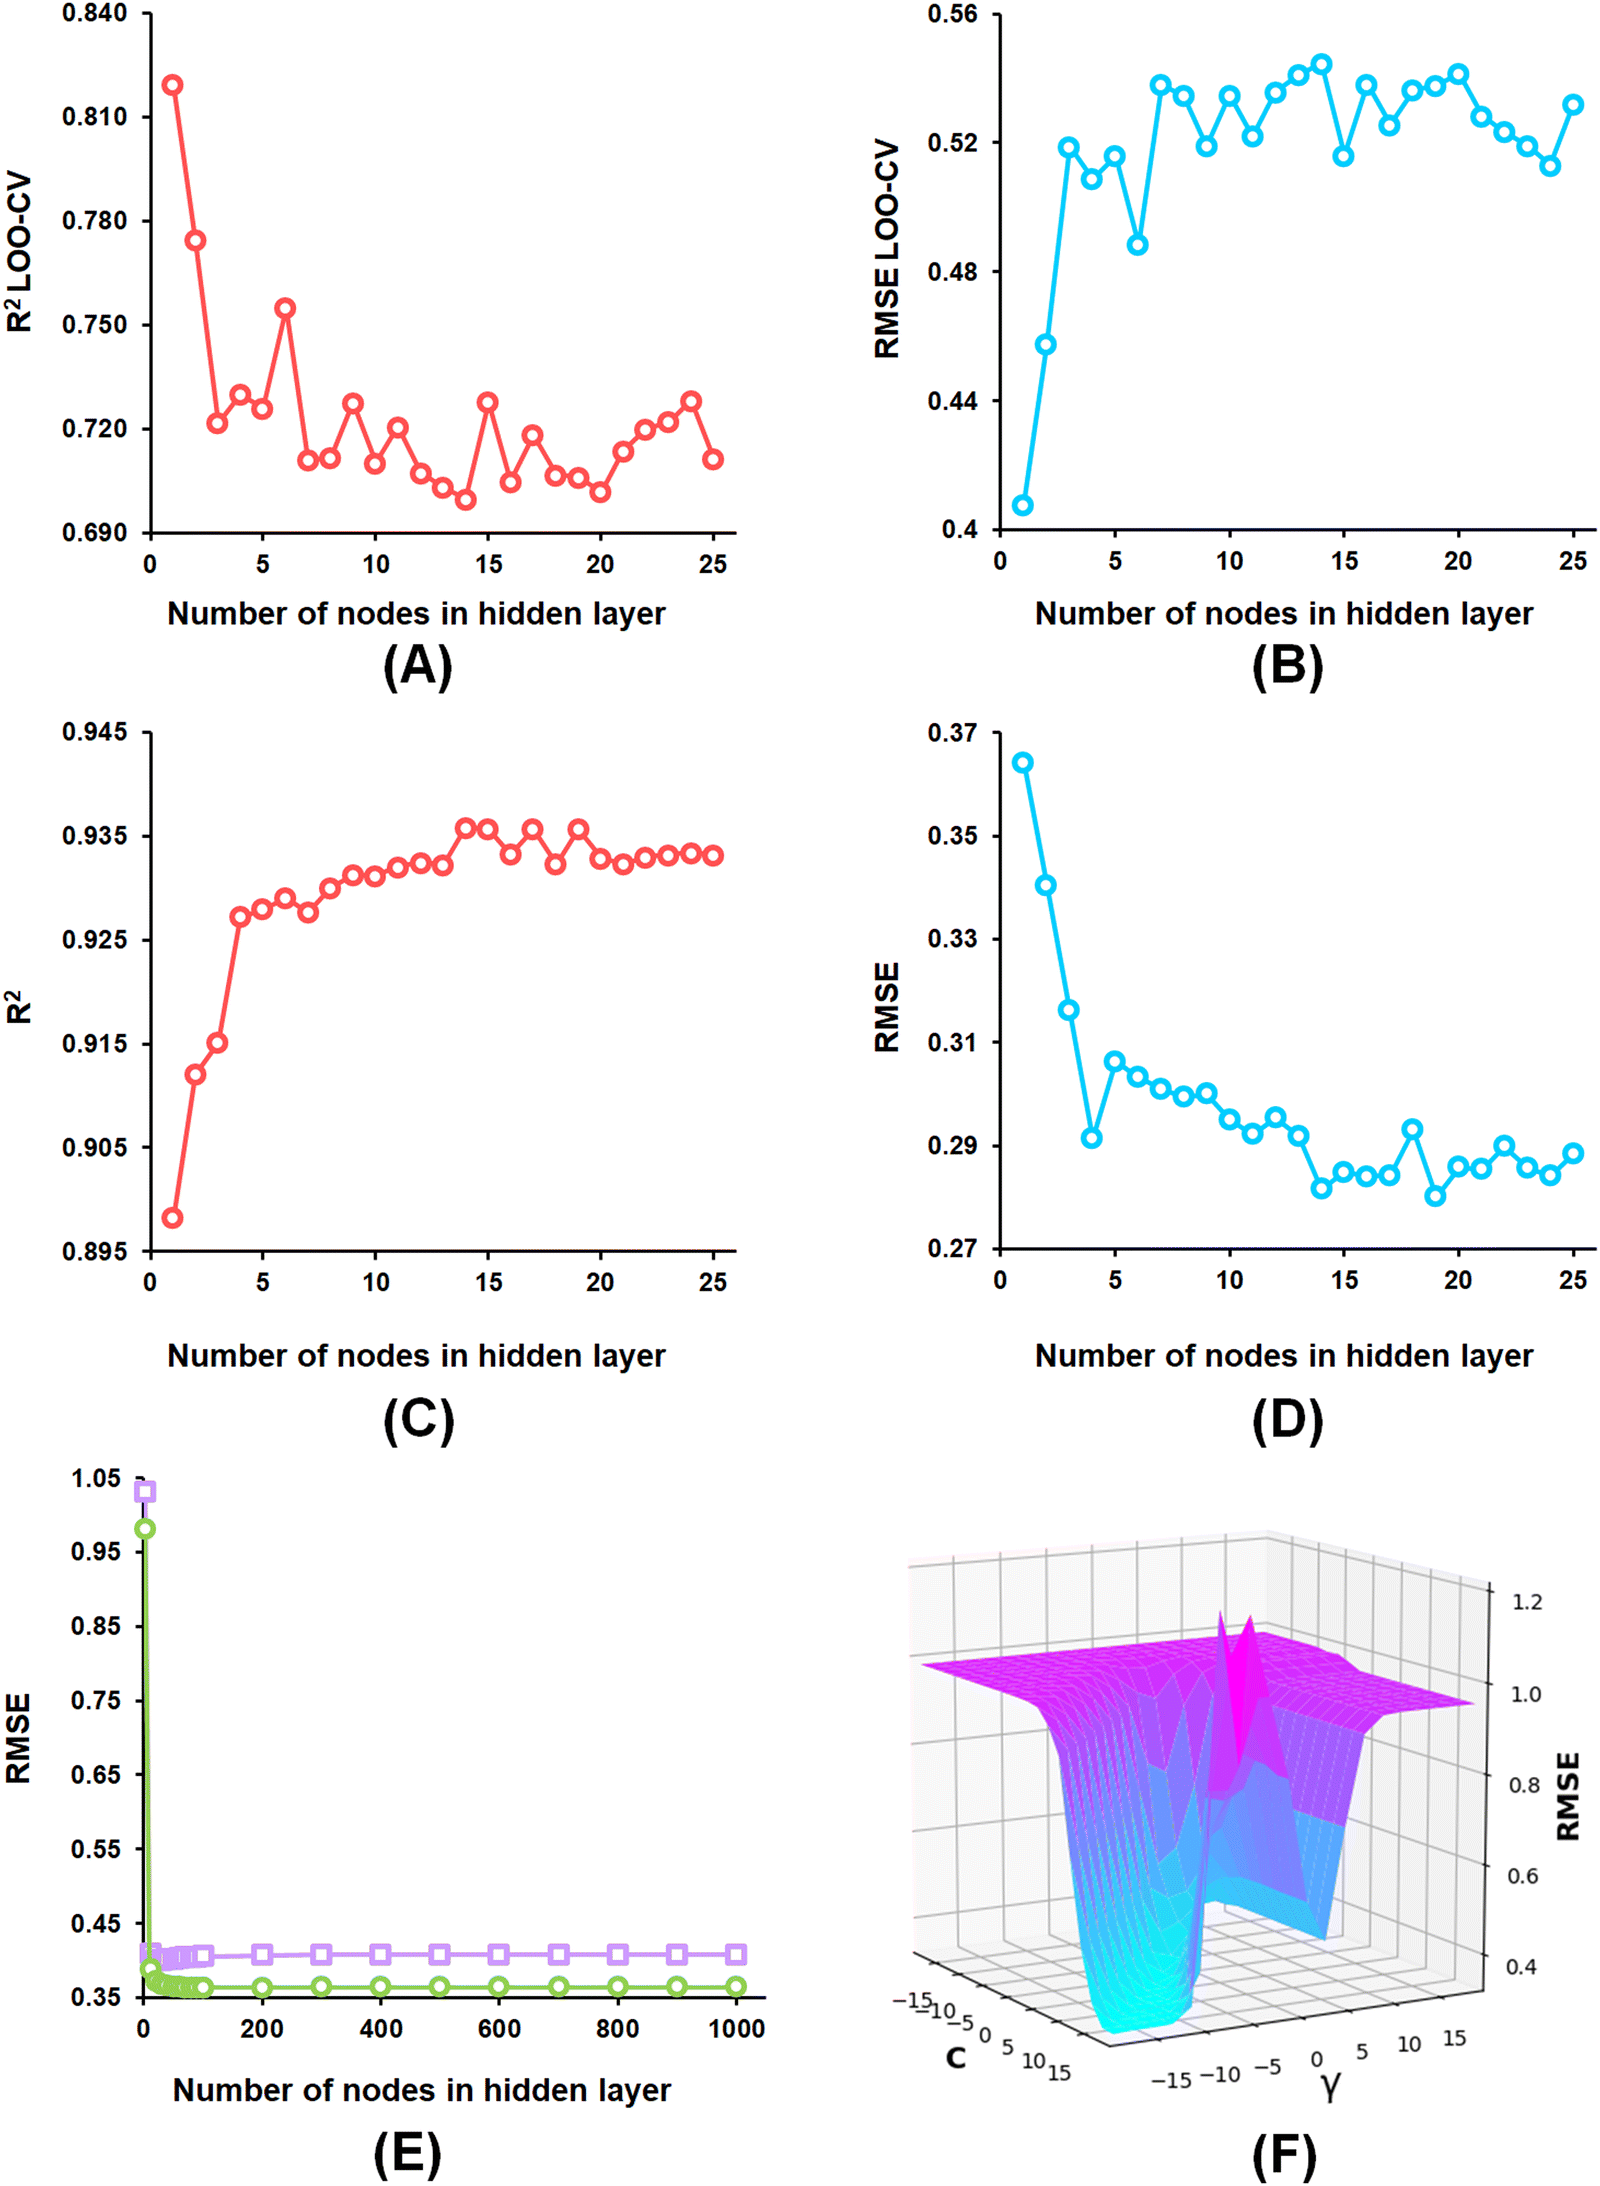 | ||
| Fig. 6 (A) ANN model parameter optimization involving the number of nodes in the hidden layer and LOO-cross-validated R2 (Q2) for the feature set-B; (B) ANN model parameter optimization involving the nodes in the hidden layer and LOO-cross-validated RMSE for the feature set-B; (C) ANN model parameter optimization involving the number of nodes in the hidden layer and training set R2 for the feature set-B; (D) ANN model parameter optimization involving the number of nodes in the hidden layer and training set RMSE for the feature set-B; (E) ANN model parameter optimization involving learning epochs and RMSE (purple squares: LOO-CV, green circles: training data) for the feature set-B; (F) SVM model parameter optimization C and γ values with RMSE. | ||
Furthermore, the observed versus predicted activities for these models are provided in ESI,† Fig. S2, and the observed and predicted activities for all of the constructed ML models for the feature set-A, feature set-B, and feature set-C along with their MLR predicted activities are given in ESI,† Table S7.
3.4. Applicability domain (AD)
The applicability domain (AD) analysis is one of the crucial steps to identify the outlier molecules for any QSAR study.27,39,59 Here, in this study, the leverage and the studentized residual values from the MLR models of these finally selected features for individual feature sets were used for the applicability domain (AD) analysis. The leverage values for a compound (hi) were calculated with the help of the following eqn (4):| hi = xTi(xTx)−1xi (i = 1,2,…,n) | (4) |
 | (5) |
3.5. Interpretation of selected features of subsets
n HsOH is a PaDEL descriptor denoting the count of atom-type H E-State: -OH. It suggested that molecules possessing a higher number of hydroxy groups may be highly active meprin β inhibitors (compounds 1–4, 6, 10, 13, 16). Apart from the hydroxy group of the hydroxamate function (crucial for Zn2+ chelation), the hydroxy group may be found attached to the aryl moiety or may be with the carboxylic acid group. Therefore, it may be assumed that such type of hydroxy groups (either phenolic or carboxylic) may be responsible for producing effective hydrogen bonding interactions at the meprin β active site for exerting good inhibitory effects. The X-ray crystallographic data of compound 4 bound to the meprin β active site (PDB ID: 7AQ1)68,69 also supported this observation (Fig. 7).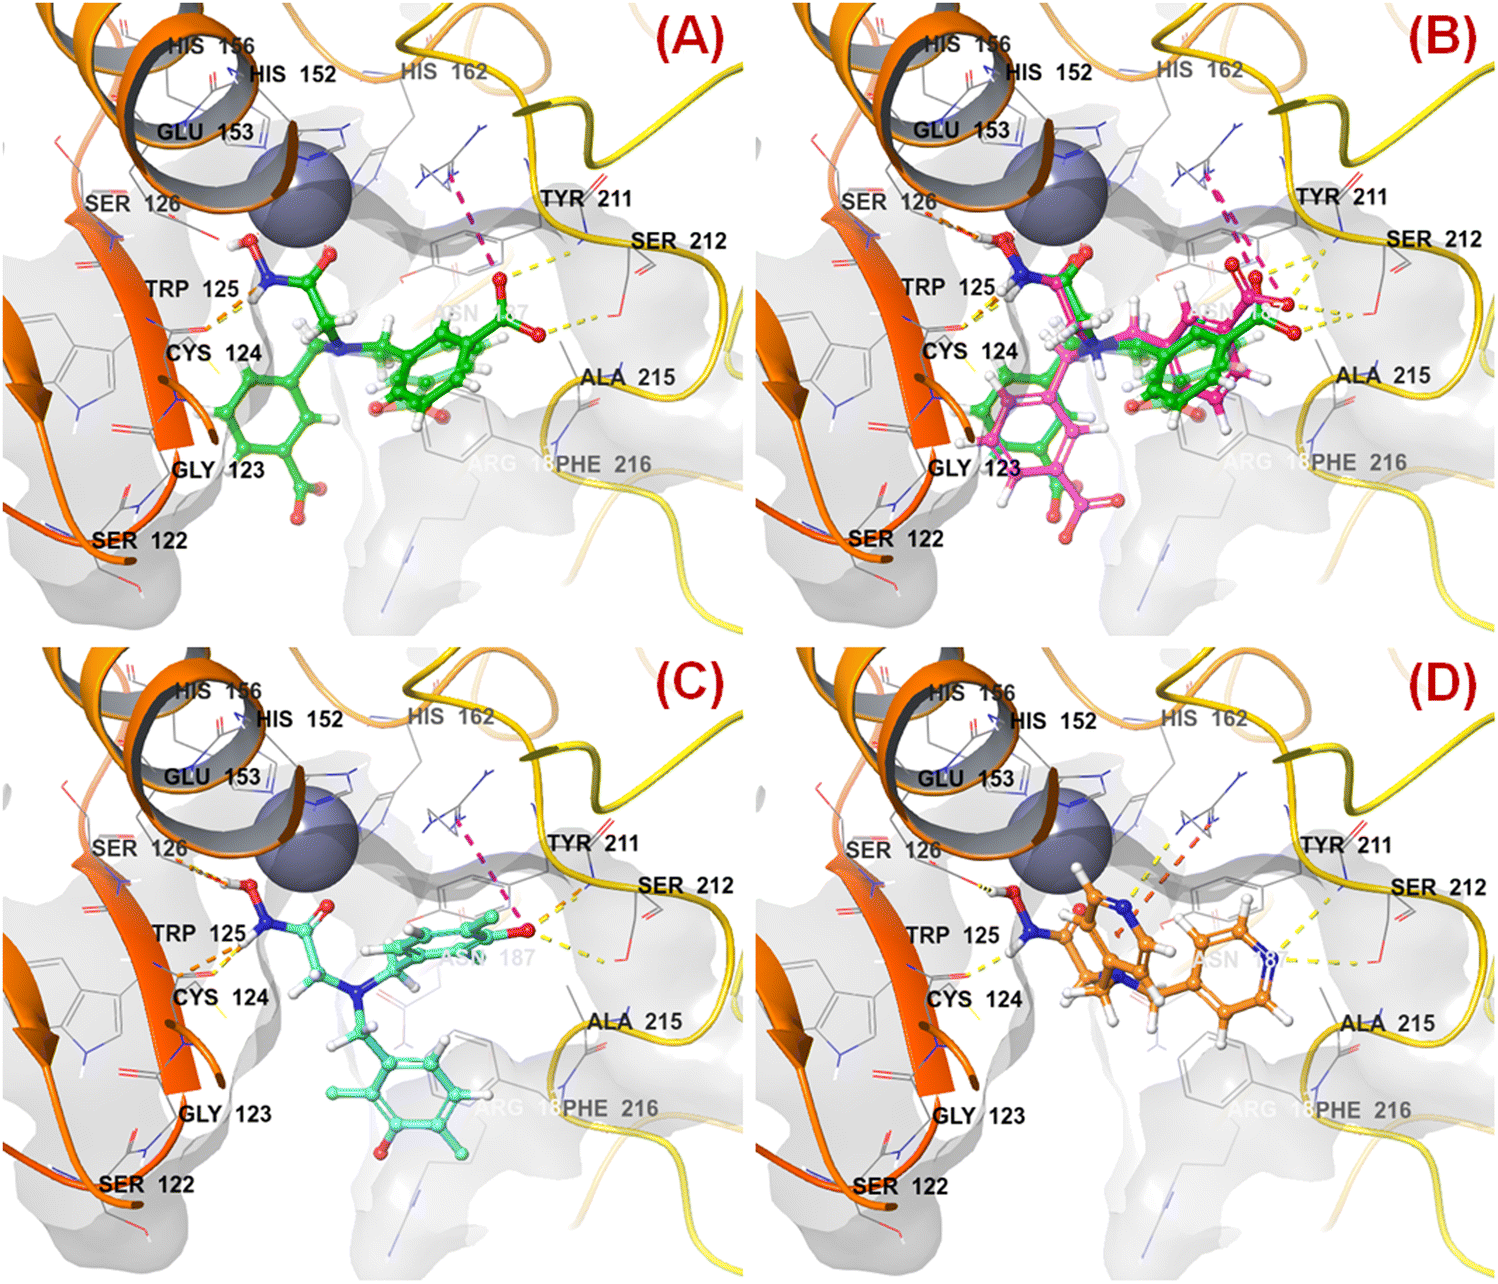 | ||
| Fig. 7 (A) Binding mode of interaction of compound 4 at the meprin β active site (PDB ID: 7AQ1); (B) alignment of the re-docked compound 4 with the inbound conformation; (C) binding mode of interaction of compound 1 at the meprin β active site (PDB ID: 7AQ1); (D) binding mode of interaction of compound 107 at the meprin β active site (PDB ID: 7AQ1) | ||
It was noticed that apart from participation as the Zn2+ chelator, the hydroxy function of the hydroxamate moiety formed a hydrogen bonding interaction with the carboxyl side chain of Glu153. Nevertheless, another hydroxy function of the benzoic acid moiety formed favorable hydrogen bonding interaction with the amide function of Ser212 at the S1′ pocket. Moreover, the binding mode of interaction of the most active compound (compound 1) revealed that the phenolic hydroxy group not only formed a hydrogen bonding interaction with Ser212 but also formed favorable salt bridge interaction with Arg238 at the S1′ pocket. However, in the case of the least active compound (compound 107), without the presence of the hydroxy functions at the aryl moiety, the pyridyl nitrogen atom formed a hydrogen bonding interaction with Ser212 at the S1′ pocket. This may be the possible reason behind the lowest inhibitory efficacy of compound 107 compared to compound 1.
Also, the hydroxy group was found favorable at the para position of the phenyl group, whereas the methoxy group was found unfavourable, as evidenced by the 2D-QSAR, KPLS, and Bayesian classification modeling performed earlier.70 Again, the Bayesian classification, pharmacophore mapping, and hologram QSAR (HQSAR) analysis performed earlier70 also revealed the importance of m-carboxylic acid containing benzyl scaffold at the tertiary amine for higher meprin β inhibition.
Apart from that, MDEO-22 represents the molecular distance edge between all secondary oxygens. Compounds 12 and 14 possessing benzodioxole scaffold were highly effective meprin β inhibitors. It was also important to note that compounds with this benzodioxole scaffold (compounds 12, 14) were better effective compared to the compounds containing dihydrobenzodioxine moiety (compounds 52, 63, 89). MIC2 represents the modified information content index (neighbourhood symmetry of 2nd order). Compounds with higher values of this parameter were better effective inhibitors (compounds 2–3, 5–6, 11–12, 15–16) compared to compounds having lower values of this parameter (compounds 85–86, 100, 103–105, 107). GATS8s denotes the Geary autocorrelation of lag 8 weighted by I state. It was noticed that molecules with higher values of this parameter (compounds 4, 7–9, 21–22) were better meprin β inhibitors compared to compounds containing lower values of this parameter (compounds 32, 54–55, 82, 87, 101). On the other hand, SpMax4_Bhv represents the largest absolute eigenvalue of Burden modified matrix n 4/weighted by relative van der Waals volume. Compounds containing a higher value of this parameter (compounds 5–6, 12, 16) were better inhibitors than compounds having a lower value of this descriptor (compounds 58, 63, 72, 77, 82, 88, 91). Probably, the former compounds may provide favorable steric interactions with the meprin β enzyme than the latter ones. SHCsatu denotes the sum of atom-type H E-State: H on sp3 bound to unsaturated carbon. It was found that compounds possessing lower values of this parameter (compounds 3–4, 7–9, 11, 14, 17–18, 21–22) were better meprin β inhibitors than compounds containing higher values of this parameter (compounds 41, 43, 45, 54–55, 57, 64–65, 68, 79, 94, 97).
VC-5 denotes the valency cluster order 5. Compounds with lower values of this parameter (compounds 7–9, 17, 20–22) were comparatively better potent than compounds comprising higher values of this parameter (compounds 43, 57, 64, 91, 99).
The PubchemFP667 represents the allyl alcohol function (Fig. 8). It was noticed that compounds bearing such type of allyl alcohol fragments in their molecular structure (compound 1–20) produced highly potent meprin β inhibitors. Such a type of fragment was present in the phenolic group. Therefore, it may be assumed that compounds containing phenolic groups may produce favorable hydrogen bonding interaction at the enzyme active site.
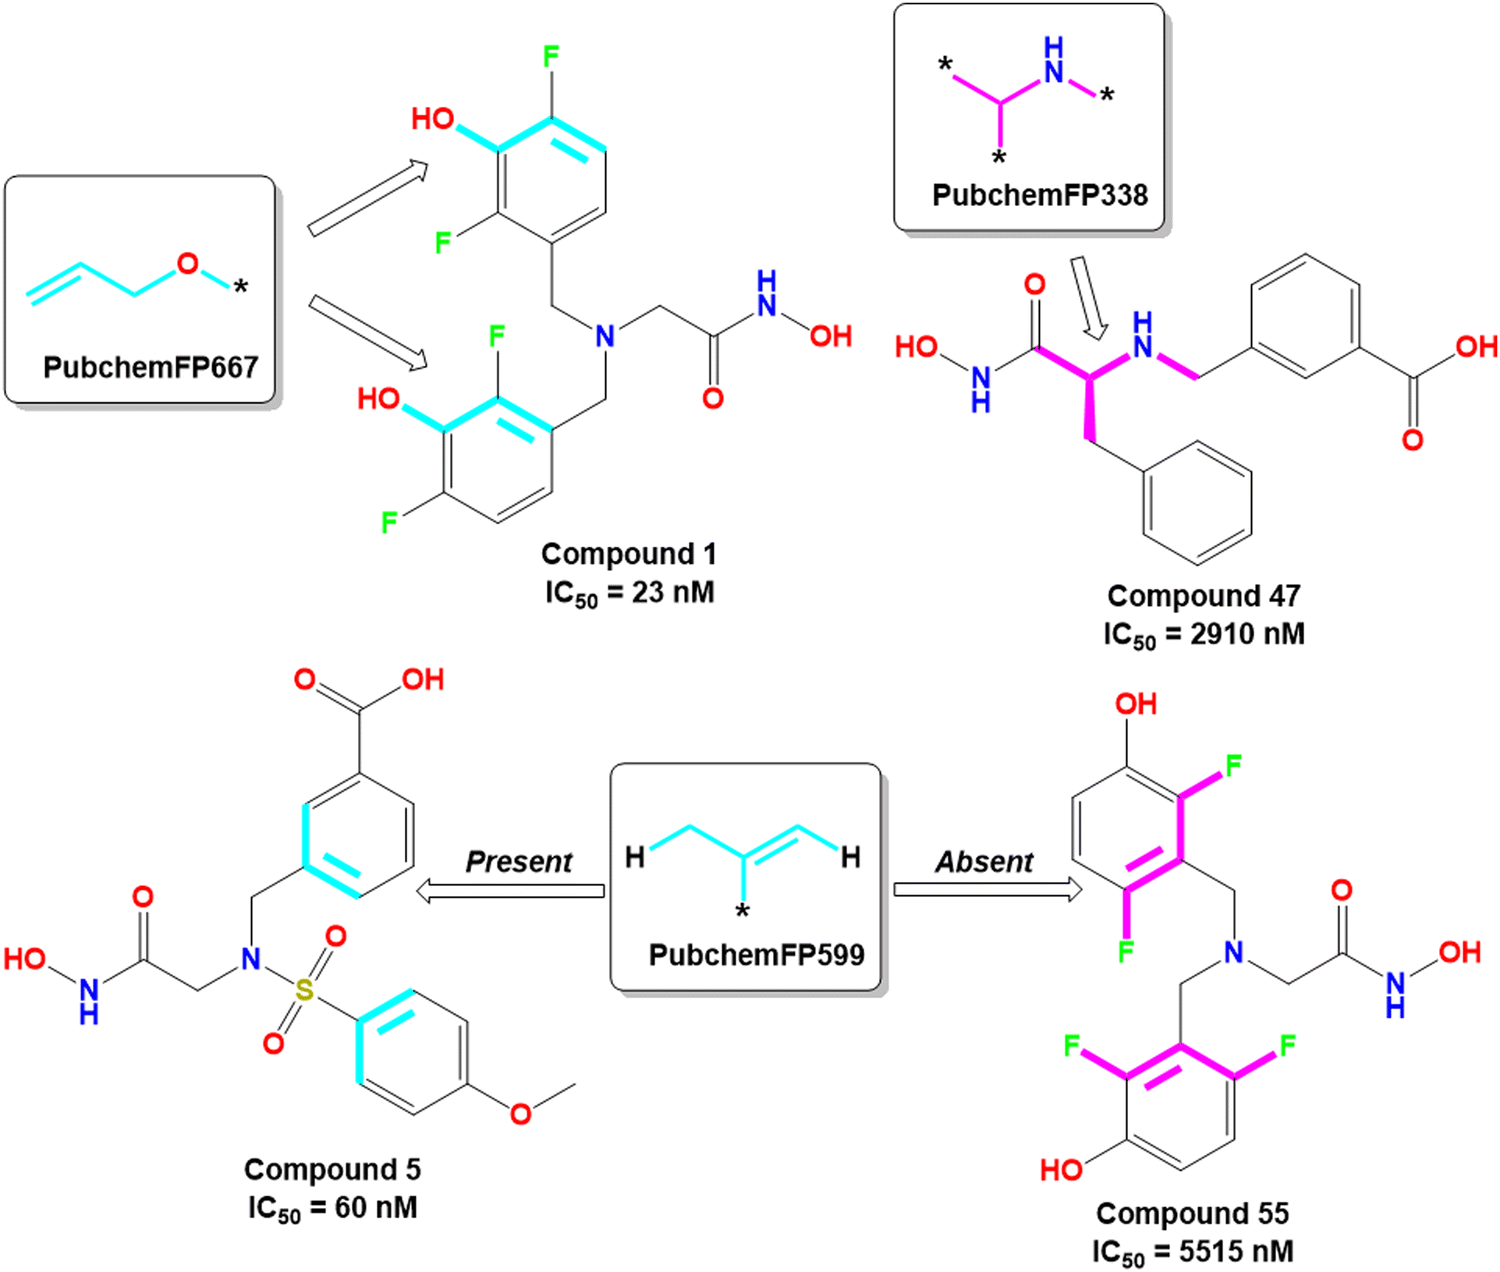 | ||
| Fig. 8 PubChem fingerprint features from the ML models with their representative dataset compounds (good fragments are represented in cyan, and the bad fragments are represented in magenta). | ||
On the other hand, PubchemFP338 represents the feature of isopropyl amine moiety (Fig. 8). It was noticed that several molecules (compounds 47, 50–51, 65–66, 68, 74–75) bearing such a scaffold were less effective meprin β inhibitors. Compounds containing the chiral carbon atom adjacent to the amide group independent of any conformation (i.e., R or S conformation) were less effective inhibitors, suggesting that compounds should not bear any chiral center for exerting higher meprin β inhibition (Fig. 8).
The binding mode of interaction analysis explored that compound 47 bearing an isopropylamine scaffold, i.e., a chiral center with an amide function associated with a benzyl moiety, moved to the opposite direction probably due to higher flexibility though it produced favorable hydrogen bonding interaction with Ser212 at the S1′ pocket. Therefore, such a type of chiral carbon atom associated with substituted amide function is not conducive to biological activity (Fig. 9(A)).
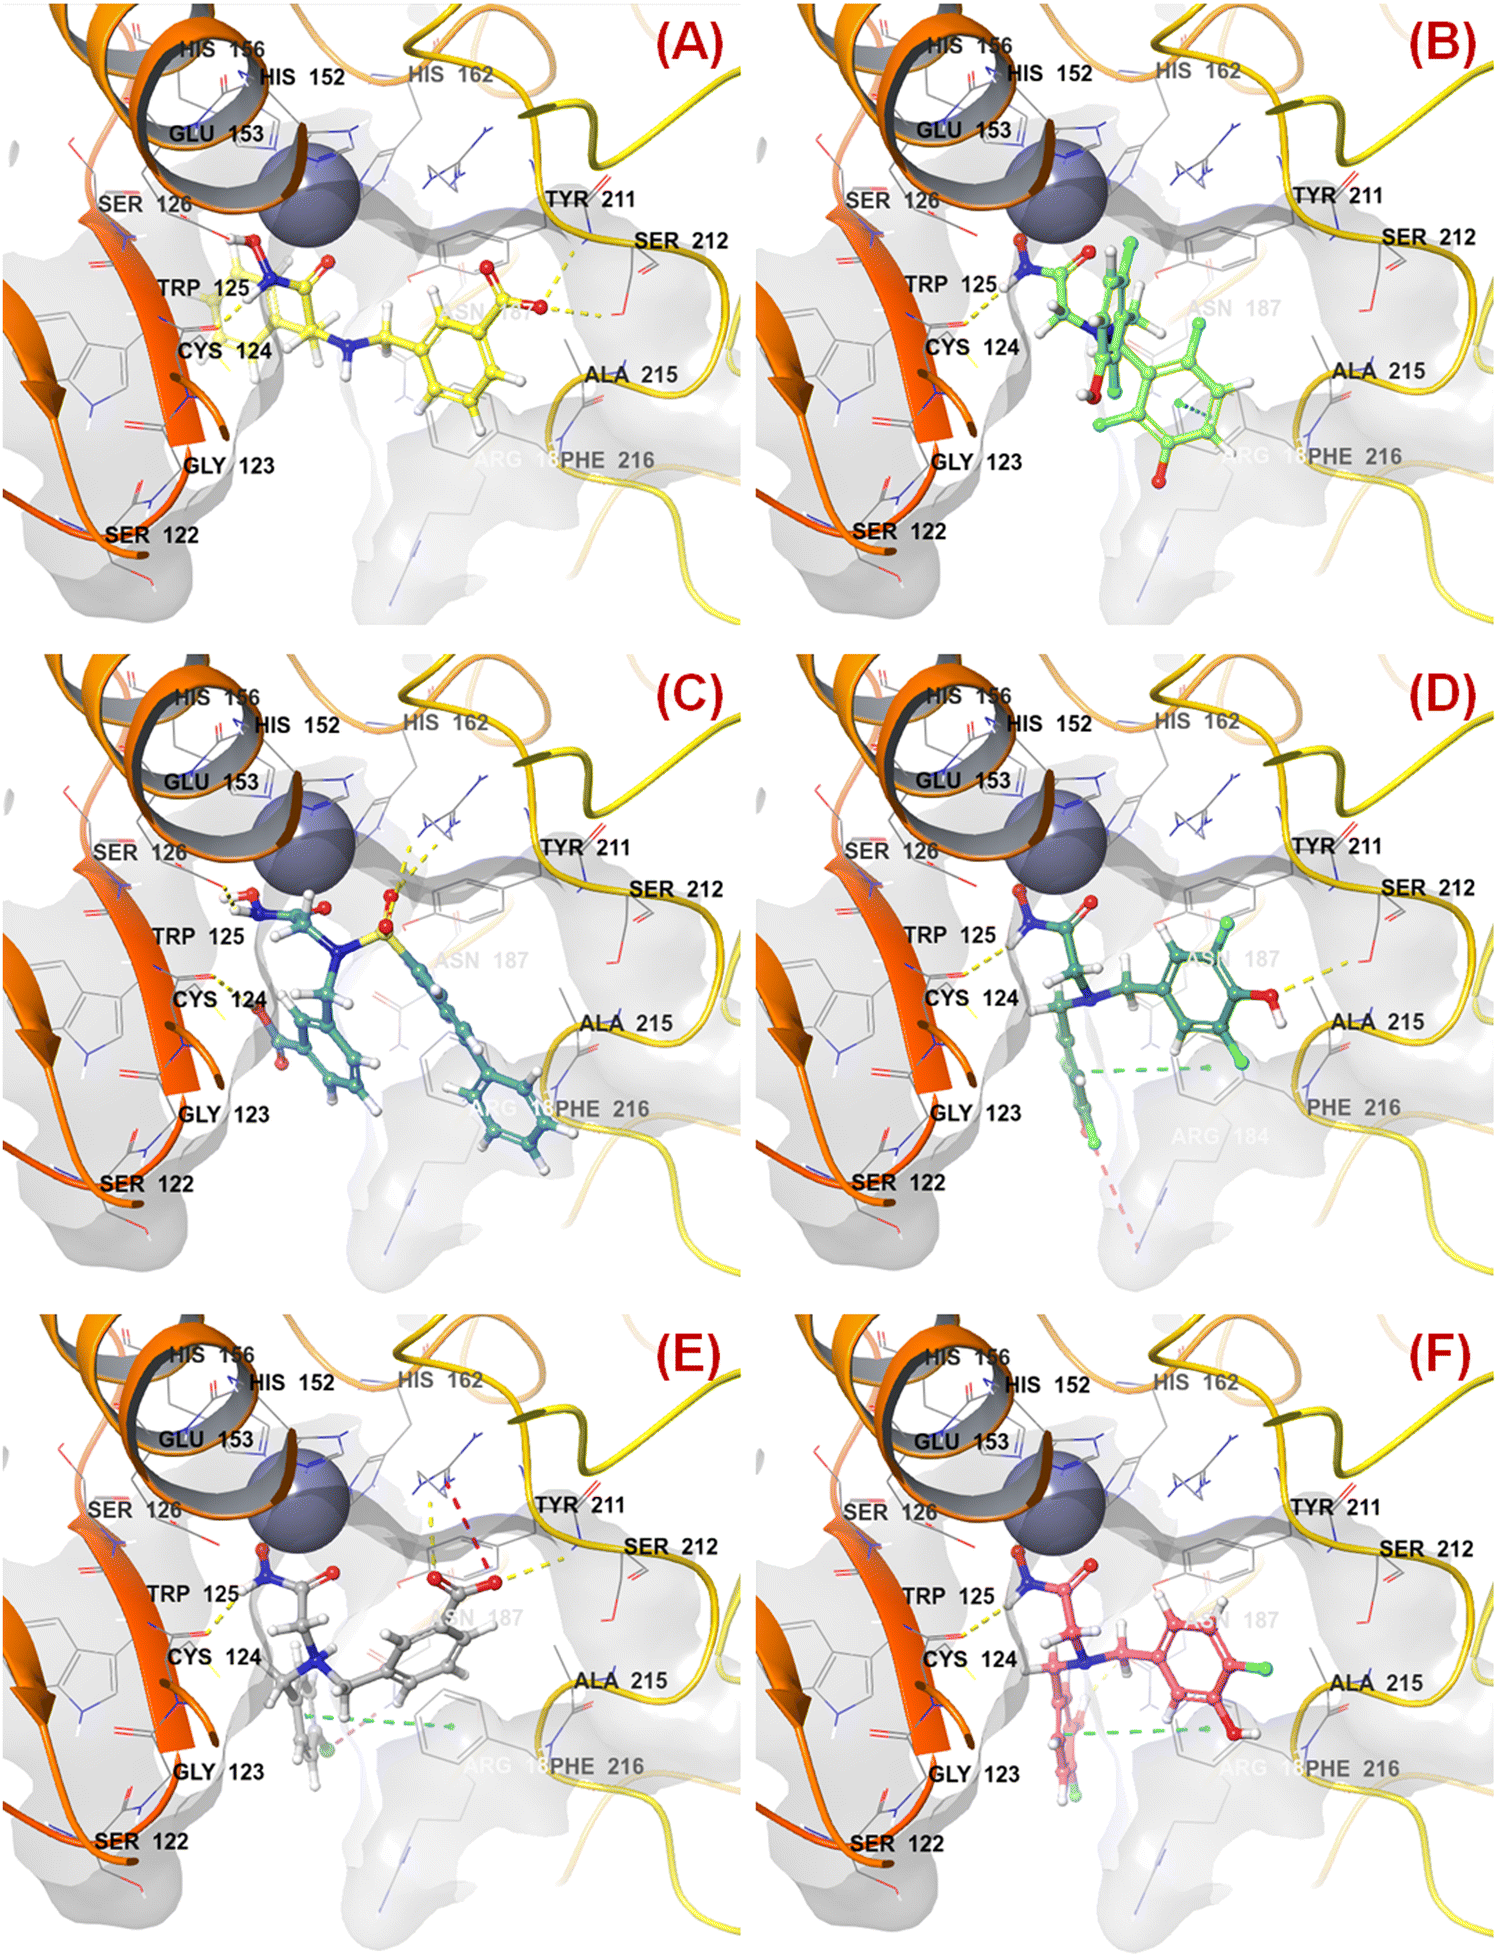 | ||
| Fig. 9 (A) Binding mode of interaction of compound 47 at the meprin β active site (PDB ID: 7AQ1); (B) Binding mode of interaction of compound 55 at the meprin β active site (PDB ID: 7AQ1); (C) Binding mode of interaction of compound 38 at the meprin β active site (PDB ID: 7AQ1); (D) Binding mode of interaction of compound 13 at the meprin β active site (PDB ID: 7AQ1); (E) Binding mode of interaction of compound 7 at the meprin β active site (PDB ID: 7AQ1); (F) Binding mode of interaction of compound 37 at the meprin β active site (PDB ID: 7AQ1). | ||
PubchemFP599 represents the structural features related to propylene function. Here, this function is found to be located inside the aryl moiety (Fig. 8). It was noticed that all compounds in the dataset except compound 55 possess such a type of feature. In the case of compound 55, both the R1 and R5 positions were substituted with fluorine atoms (Fig. 8). It may be assumed that the benzyl group in all these molecules may provide some flexibility, and the presence of such types of groups may execute some favorable hydrophobic interactions at the active site that may help in enhancing meprin β inhibition. However, disubstitution at the R1 and R5 positions at the benzyl moiety is not favorable for activity. The binding mode of interaction of compound 55 displayed that the benzyl group, probably due to such type of halogen substitutions at both R1 and R5 positions, oriented completely in a different way compared to the most active compound 1 (Fig. 7(C) and 9(B)).
The lipoaffinity index is another parameter affecting the meprin β inhibitory efficacy. It was noticed that molecules possessing higher lipophilicity (due to the presence of biphenyl moiety in compounds 38–39; the presence of methoxyphenyl group in compounds 69, 79–80, 84–85, 105; O-n-propyl group in compound 44) may possess a negative impact on meprin β inhibitory activity. Therefore, for designing highly potent meprin β inhibitors, compounds should be hydrophobic, and the hydrophobic characters should be optimized. Our earlier observation70 on meprin β inhibitors was also in agreement with the outcomes of the current study. Both studies suggested the detrimental effect of the biphenyl scaffold. Moreover, the previously performed 2D-QSAR, Bayesian classification, and CoMSIA studies indicated the negative influence of the methoxy group due to its higher hydrophobic character.70
SHBint3 denotes the sum of E-state descriptors of strength for potential hydrogen bonds of path length 3. Compounds 1, 2, 3, and 13 contain both hydrogen and hydroxy substitutions at the phenyl ring within path length 3 that is capable of forming effective hydrogen bonding interactions at the enzyme active site. Therefore, it may be presumed that such type of structural features is required for higher meprin β inhibitory efficacy. The binding mode of interaction analysis suggested that compound 13, having such type of structural features, formed potential hydrogen bonding and salt bridge interactions with Ser212 and Arg184, respectively (Fig. 9(D)).
ATSC1e represents the Centred Broto–Moreau autocorrelation of lag 1 weighted by Sanderson electronegativity. It was noticed that compounds bearing negative values of this parameter were favorable for higher inhibitory activity (compounds 1, 2, 3, 13). It may be assumed that the presence of higher electronegative functions (namely halogenic functions like fluorine and chlorine substitutions at the phenyl rings) may favor meprin β inhibition.
ATSC8m denotes the Centred Broto–Moreau autocorrelation of lag 8 weighted by mass. It was noticed that compounds possessing a higher negative value of this parameter were potent meprin β inhibitors (compounds 2, 3, 5, 7, 9, 19, 22).
Similarly, ATSC4m represents the Centred Broto–Moreau autocorrelation of lag 4 weighted by mass. Here, in this case, it was also noticed that compounds containing a higher negative value of this descriptor were promising meprin β inhibitors (compounds 1, 5, 11, 16, 18).
On the other hand, AATS7i denotes the average Broto–Moreau autocorrelation lag 7/weighted by the first ionization potential. Compounds containing a lower positive value of such a feature were promising meprin β inhibitors (compounds 4–8, 12, 16–17).
KRFP4734 is a Klekota–Roth fingerprint substructure indicating the presence or absence of 4-fluorophenyl function in a molecule. It was noticed that due to the presence of such a scaffold, compound 55 yielded lower meprin β inhibitory efficacy (IC50 = 5515 nM) (Fig. 10).
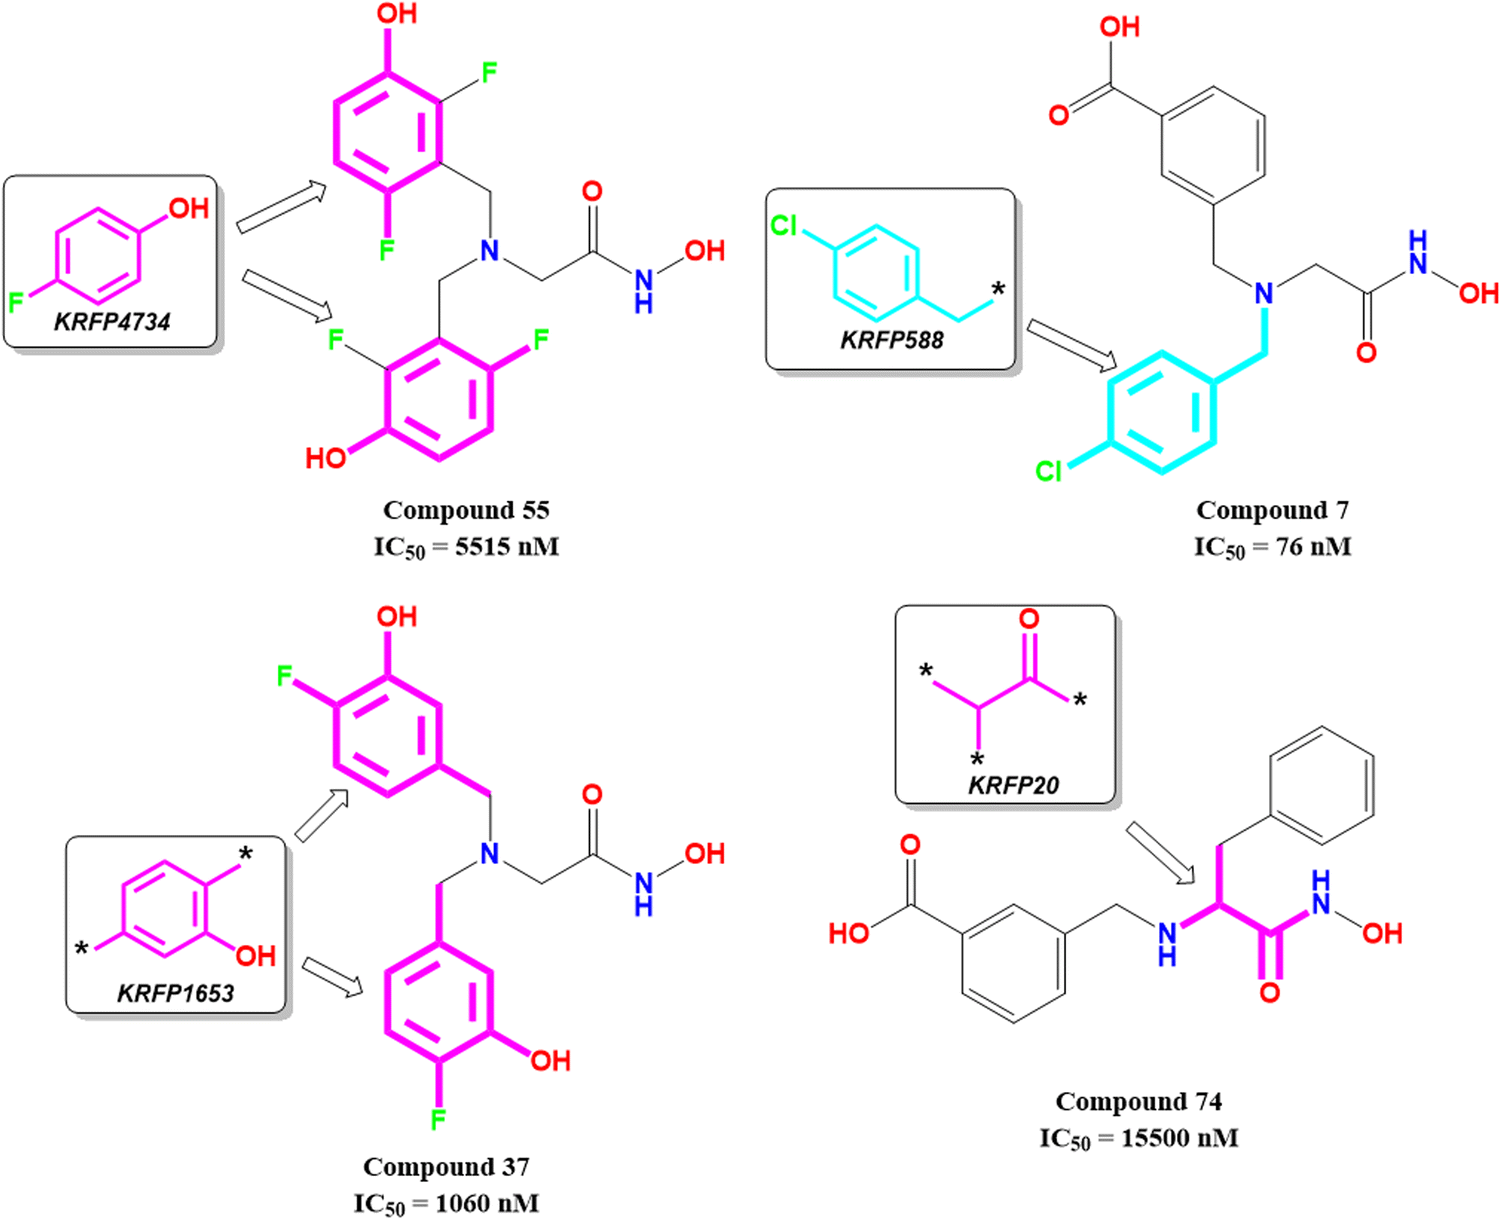 | ||
| Fig. 10 Klekota–Roth fingerprint features obtained from the ML models with their representative dataset compounds (good fragments are represented in cyan, and the bad fragments are represented in magenta). | ||
Comparing other compounds like compounds 1 and 2, it may be assumed that fluorine substitution at the R5 position may be detrimental to meprin β inhibition. Similarly, the hydroxy group at the R2 position was found more favorable than methoxy substitution at the same position (compound 1vs. compound 79; compound 2vs. compound 69). Again, apart from fluoro substitution at the R1 position and hydroxy substitution at the R2 position, fluoro substitution may be tolerable at the R3 position (compound 37: IC50 = 1060 nM) (Fig. 10). Moreover, it was better than no substitution at this position (compound 46: IC50 = 2905 nM).
KRFP588 is another Klekota–Roth fingerprint feature denoting the presence or absence of p-chlorobenzyl function in a molecule. Compound 7 containing such function resulted in potent meprin β inhibitory activity (IC50 = 76 nM). It was also important to note that other substitutions at the R3 position, such as fluoro (compound 9), cyano (compound 17), methyl (compound 22), phenyl (compound 39), carboxylic acid (compound 10), or no substitution (compound 40) produced less efficacy compared to the chloro substitution (compound 7). The binding mode of interaction analysis revealed that compound 7, comprising a p-chlorobenzyl moiety, formed a favorable halogenic interaction with Ser212 at the S1′ pocket of the meprin β active site through the chloro function (Fig. 9(E)).
Again, KRFP1653 represents the presence or absence of disubstituted phenolic moiety where the hydroxy group is located at the meta position. Compound 37, containing such a feature (Fig. 10), was a comparatively less active meprin β inhibitor than compounds 1 and 2. The binding mode of interaction analysis suggested that one of the phenolic hydroxyl groups of compound 37 formed hydrogen bonding with Asn187, which may have unfavorable effects. On the other hand, the other phenolic hydroxy group moved in the opposite direction of the S1′ pocket without forming any hydrogen bonding with Ser212 (Fig. 9(F)). However, compounds 1 and 2 with slight variation in the aryl substitutions formed interaction with Ser212 at the S1′ pocket through the phenolic hydroxy group (Fig. 7(C)). Therefore, the disubstituted phenolic moiety is unfavorable, compared to the trisubstituted phenolic scaffold.
On the other hand, KRFP20 denotes the fragment comprising a substituted carbonyl function attached to the carbon atom with a hydrogen function that was substituted with other groups (Fig. 10). It was noticed that compounds having chiral carbon atoms with hydrogen atoms adjacent to the carbonyl function resulted in lesser meprin β inhibitory efficacy (compounds 47, 50–51, 65–66, 68, 74–75) (Fig. 10). Therefore, it may be assumed that such types of fragments may be detrimental to meprin β inhibitory activity.
naasC is a PaDEL descriptor denoting the count of atom type E-State::C:-. It was noticed that the most potent compounds of this series (compounds 1–3) exhibited a higher value of this parameter (naasC = 8), whereas the least effective compounds (compounds 95–96, 99–100, 103–104, 107) displayed comparatively a lower value of this parameter (naasC = 2). This suggests that the electronic state of such type of carbon atoms present in the most potent molecules is crucial for modulating higher meprin β inhibitory efficacy.
Similar to the model constructed with only PaDEL descriptors, here also, the importance of the parameter nHsOH has been explored. It suggested that compounds with a higher number of hydroxy functions (either phenolic or carboxylic) may favor the meprin β inhibitory efficacy probably by forming favorable hydrogen bonding interactions.
SIC3 is another descriptor representing structural information content index (neighbourhood symmetry of 3rd order). It was observed that compounds with higher values of this parameter (compounds 5–6, 11–12, 14–15) contributed positively towards effective meprin β inhibition, whereas compounds with lower values of this parameter (compounds 85, 89, 92, 102–105, 107) contributed negatively towards the biological potential.
Again, ATSC5s denotes the Broto–Moreau autocorrelation of lag 5 weighted by I-state. It was noticed that compounds having higher values of this parameter contributed negatively towards the biological activity (compounds 57, 85, 94, 105), whereas lower values of this parameter have a positive effect on meprin β inhibition (compounds 7, 11, 18, 21).
SpMax2_Bhs represents the largest absolute eigenvalue of the Burden matrix n 2/weighted by a relative I state. It was observed that compounds having lower values of this parameter were potential meprin β inhibitors (compounds 4, 6, 10, 16, 26, 27, 31, 34).
3.6. Designing of new compounds
Based on the molecular modeling approaches conducted in this study, some potent compounds were designed (Fig. 11). These compounds were subsequently predicted by the machine learning models performed in this study (Table 2).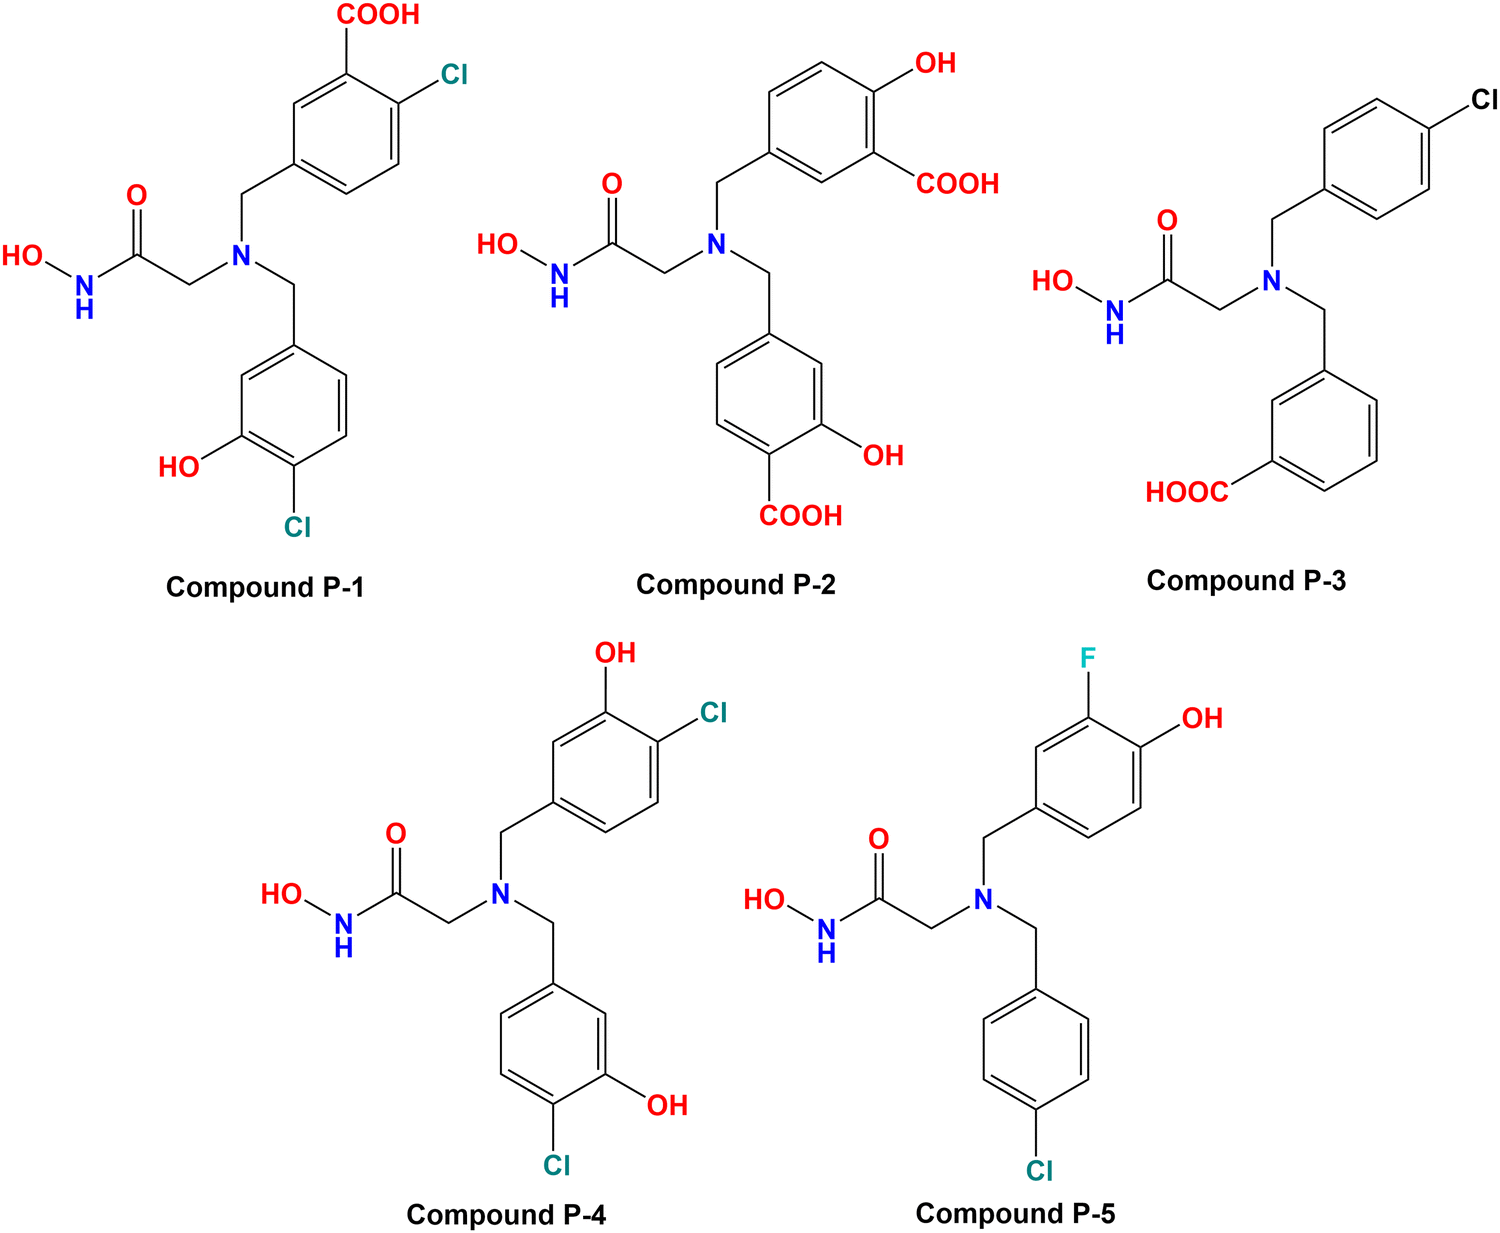 | ||
| Fig. 11 Designed meprin β inhibitors depending on the fragment-based machine learning (ML) models. | ||
| Cpd | Predicted Meprin β IC50 (nM) | Docking scores | ||||||
|---|---|---|---|---|---|---|---|---|
| k-NN (feature set-B) | RF (feature set-A) | ANN (feature set-B) | SVM (feature set-B) | Consensus average | GLIDE docking score | XP Gscore | GLIDE score | |
| P-1 | 76.0 | 103.0 | 60.3 | 65.6 | 76.2 | −0.448 | −8.696 | −8.696 |
| P-2 | 207.0 | 346.7 | 57.0 | 38.1 | 162.2 | −7.601 | −7.621 | −7.621 |
| P-3 | 76.0 | 130.6 | 230.7 | 345.1 | 195.6 | −5.772 | −5.791 | −5.791 |
| P-4 | 650.1 | 244.9 | 112.5 | 129.4 | 284.2 | −5.719 | −5.802 | −5.802 |
| P-5 | 346.7 | 517.6 | 253.5 | 338.8 | 364.2 | −0.861 | −5.448 | −5.448 |
It was noticed that compound P-1 was predicted as the best one by all these four models (k-NN: IC50 = 76 nM; RF: IC50 = 103 nM; ANN: IC50 = 60.30 nM; SVM: IC50 = 65.60 nM). On the other hand, compound P-2 was predicted better by the SVM model (IC50 = 38.10 nM), and a closer prediction compared to compound P-1 was noticed while predicted by the ANN model (IC50 = 57 nM). However, compound P-3 has a close prediction compared to compound P-1, while predicted by the k-NN model (IC50 = 76 nM) and RF model (IC50 = 130 nM). On the other hand, compounds P-4 and P-5 were also predicted well by all these models but these predictions were quite lower compared to the earlier three models.
All these predicted designed molecules (compounds P-1 to P-5) were further subjected to molecular docking analysis (Fig. 12) to explore the binding mode of interactions at the active site of meprin β (PDB: 7AQ1).
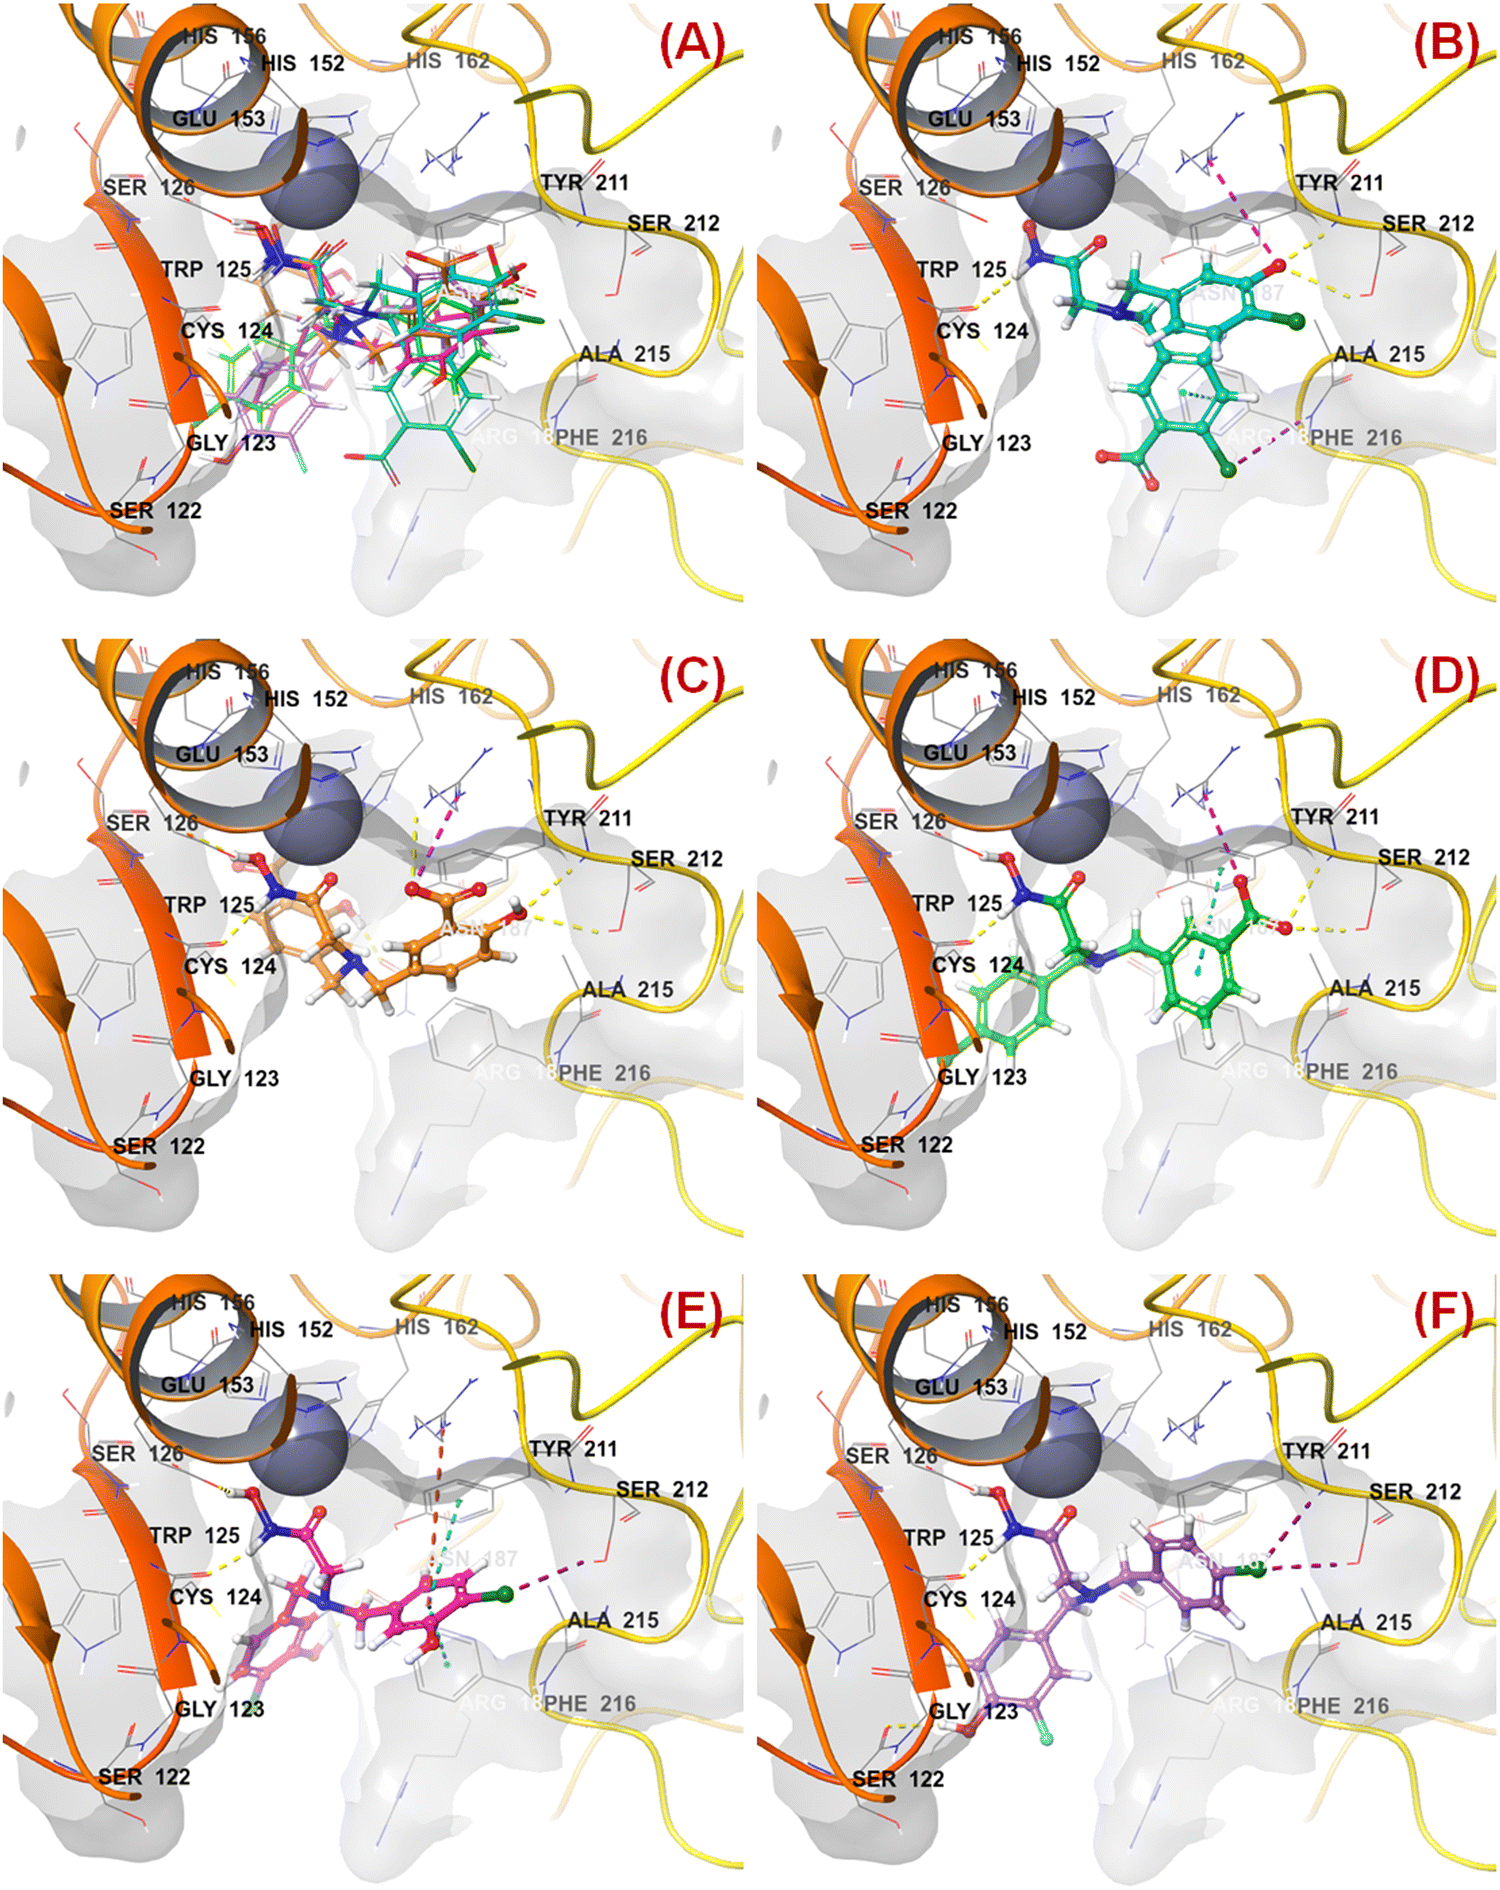 | ||
| Fig. 12 (A) Molecular docking alignment geometry of the designed compounds at the meprin β active site (PDB: 7AQ1) (B) binding mode of interactions of compound P-1 at the meprin β active site (PDB: 7AQ1) (C) binding mode of interactions of compound P-2 at the meprin β active site (PDB: 7AQ1) (D) binding mode of interactions of compound P-3 at the meprin β active site (PDB: 7AQ1) (E) binding mode of interactions of compound P-4 at the meprin β active site (PDB: 7AQ1) (F) binding mode of interactions of compound P-5 at the meprin β active site (PDB: 7AQ1). | ||
The molecular docking study revealed that all these molecules accommodated nicely into the meprin β active site where the hydroxamate moiety was found close to the catalytic Zn2+ ion, suggesting that the strong zinc-binding characters of these molecules may be a probable reason for higher meprin β inhibition (Fig. 12(A)).
As far as the ligand-binding interaction was concerned, it was observed that apart from strong Zn2+ chelation, the amide group of compound P-1 formed a hydrogen bonding with Cys124 (Fig. 12(B)). On the other hand, one chloro and the carboxylic acid groups were solvent-exposed but another chloro group formed halogen interaction with Phe216. Phe216 also formed π–π stacking interaction with the benzyl group. Again, the hydroxy group substituted at another benzyl moiety formed hydrogen bonding with Ser212 and the salt–bridge interaction with Arg238.
In the case of compound P-2, it was noticed that apart from strong Zn2+ chelation, the amide and hydroxy group of hydroxamate moiety formed hydrogen bonding with Cys124 and Glu153, respectively (Fig. 12(C)). Due to greater flexibility, one of the salicylic acid scaffolds became closer to the Zn2+ ion to make π–cationic interaction. On the other hand, both the hydroxyl groups of the salicylic scaffold formed hydrogen bonding with Asn187 and Ser212. Nevertheless, one of the carboxylic acid groups formed a salt–bridge interaction with Arg238 at the active site.
Again, a similar binding mode of interactions was observed for compound P-3 (Fig. 12(D)). However, the p-chloro benzyl group moved into the solvent-exposed area. Apart from that, the other benzyl group formed a π–π stacking interaction with Tyr211. The carboxylic acid moiety also formed hydrogen bonding and salt–bridge interactions with amino acid residues Ser212 and Arg238, respectively.
A higher number of interactions were noticed for compound P-4 (Fig. 12(E)). The p-chloro-m-hydroxy group for both the aryl functions entered into the solvent-exposed area. One of the benzyl groups formed π–π stacking interactions with both hydrophobic amino acid residues Phe216 and Tyr211. Nevertheless, the chloro and hydroxy functions formed halogenic interaction and hydrogen bonding with Ser212 and Asn187, respectively. Interestingly, less number of interactions were noticed in the case of compound P-5 (Fig. 12(F)). Here also, the halogenic and electronegative groups were in the solvent-exposed area. However, both the Ser212 and Ser122 amino acid residues were found to form halogenic and hydrogen bonding interactions, respectively.
Finally, all these compounds were subjected to the ADME property calculations by using SWISS-ADME71 (Table 3).
| Cpd | Consensus log P | ESOL class | GI absorption | BBB permeant | Pgp substrate | Inhibitor | Bioavailability score | ||||
|---|---|---|---|---|---|---|---|---|---|---|---|
| CYP1A2 | CYP2C19 | CYP2C9 | CYP2D6 | CYP3A4 | |||||||
| P-1 | 1.88 | Soluble | High | No | No | No | No | No | No | No | 0.55 |
| P-2 | 0.18 | Very soluble | Low | No | No | Yes | No | No | No | No | 0.11 |
| P-3 | 1.83 | Very soluble | High | No | No | No | No | No | No | No | 0.55 |
| P-4 | 2.38 | Soluble | High | No | No | No | No | Yes | Yes | No | 0.55 |
| P-5 | 2.47 | Soluble | High | Yes | No | No | No | No | Yes | No | 0.55 |
Interestingly, it was noticed that all of them were highly soluble with lower lipophilicity. Except for compound P-2, all of them yielded high gastrointestinal absorption properties. Again, among these compounds, only compound P-5 displayed BBB permeability. However, none of them displayed Pgp substrate binding characters. With a slight variation, all of them did not display any cytochrome (CYP) inhibitory properties. Nevertheless, all of these designed molecules except compound P-2 resulted in a good bioavailability score. Considering all these ADME features along with the suitable binding mode of interactions, it may be assumed that these newly designed compounds based on the machine learning (ML) models will be potent and effective meprin β inhibitors.
3.7. Molecular dynamics (MD) simulation study
The 100 ns MD simulation for the most active compound 1 and the designed compound P-1 was performed to understand the binding pattern and stability of binding of these compounds at the active site of meprin β. The RMSD, RMSF, and the radius of gyration for the protein, inhibitors, and complex were calculated (Fig. 13).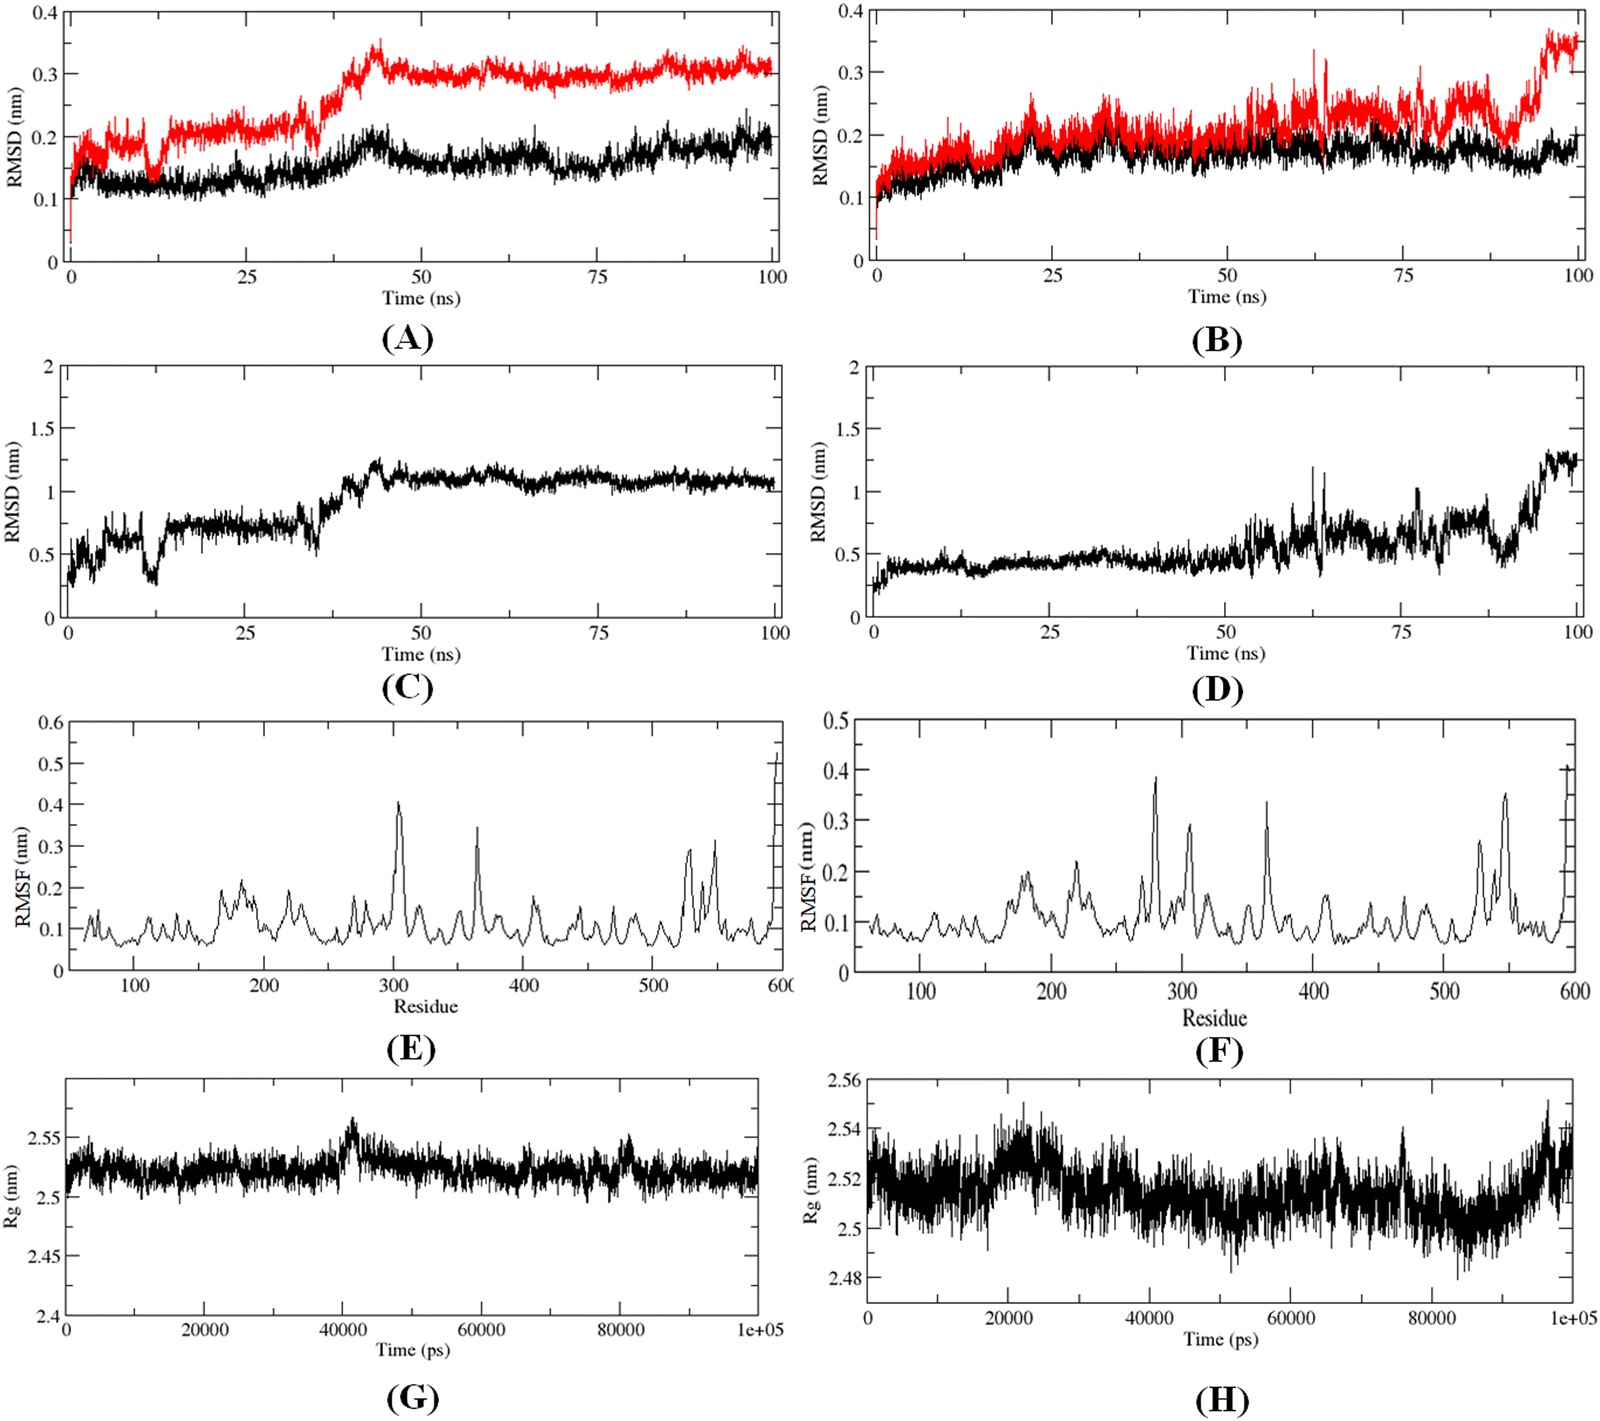 | ||
| Fig. 13 (A) RMSD of the C-α chain (black) and C-α-compound 1 complex (red), (B) RMSD of the C-α chain (black) and designed compound P-1 complex (red), (C) RMSD of compound 1, (D) RMSD of designed compound P-1, (E) RMSF for the C-α-compound 1 complex, (F) RMSF for the C-α-compound P-1 complex, (G) main chain radius of gyration (Rg) for the C-α-compound 1 complex, (H) main chain radius of gyration (Rg) for the C-α-compound P-1 complex. | ||
The RMS analysis (Fig. 13) after the MD simulation study of the complexes showed very low RMSD values for both the protein as well as the protein–ligand complexes, suggesting a stable binding for both compound 1 and the designed compound P-1 (Fig. 13(A) and (B)). Also, it was noticed that the designed compound P-1 showed almost similar RMSD values to that of the C-α chain, forming a stable complex (Fig. 13(B)) compared to the most active compound 1 (Fig. 13(A)). Interestingly, regarding the RMSD values of the compounds, it was observed that compound 1 showed a higher fluctuation in the RMSD value up to 50 ns; whereas, for the designed compound P-1, a higher RMSD fluctuation was noticed after a 50 ns timeframe (Fig. 13(C)vs.Fig. 13(D)). Regarding the RMSF and the main chain radius of gyration (Rg), both complexes showed almost similar fluctuation in the residues (Fig. 13(E)vs.Fig. 13(F)), whereas for these complexes, a lower value of Rg (<2.6 nm) suggested a stable binding of these compounds at the meprin β active site (Fig. 13(G)vs.Fig. 13(H)). The hydrogen bond formation and the % occupancy (ESI,† Fig. S4) for both of the compounds revealed that both compound 1 and P-1 showed a similar number of hydrogen bond formations throughout the simulation. Compound 1 formed a higher number of hydrogen bonds with Arg238, Arg 567, Arg146, Tyr211, Ala142, Arg184, Ser212, Thr564, and Ala561 amino acid residues. On the other hand, the designed compound P-1 showed hydrogen bond formation with Phe216, Ser212, Arg238, and His210 residues, where the Ser212 and Phe216 residues are quite important residues at the meprin β active site for maintaining higher activity. Therefore, it suggests that the designed compound P-1 can provide a higher meprin β inhibitory activity compared to the most active compound 1 through better binding at the active site. Furthermore, the binding mode analysis of these compounds at different time intervals (such as 0 ns, 50 ns, and 100 ns) (ESI,† Fig. S5) displayed that the designed molecule P-1 formed chelation at the active site for around 50 ns timeframe (ESI,† Fig. S5D–F) compared to the most active compound 1 (ESI,† Fig. S5A–C), suggesting the greater binding and stability of the designed compound P-1 at the meprin β active site over the most active compound 1, suggesting the probability of departing higher meprin β inhibition.
Additionally, with the last 10 ns of MD simulation (100 ns) trajectories, the binding energy of the ligands at the meprin β binding site was evaluated using MM/GBSA calculation (ESI,† Table S8). According to our calculations, the binding energy (G) between the protein molecule and the Zn metal-containing designed compound P-1 was higher than the binding energy (G) between the protein and the reference compound 1. It was found that compound P-1 showed a higher binding affinity (lower binding energy) of 49.20 ± 11.31 kcal mol−1 than that of compound 1 (54.00 ± 15.33 kcal mol−1) with the receptor binding site. Also, the amino acid residue contributions to the protein molecule's binding process with compound 1 and designed compound P-1 were also analyzed. From the binding process, it was observed that total decomposition contributions of van der Waals, electrostatic interactions, polar solvation, and non-polar solvation of amino acid residues of protein interaction site (Cys124, Trp125, Thr149, His152, Glu153, His156, His162, and Zn) were major with compound 1. On the other hand, amino acid residues of protein interaction sites, i.e., Cys124, Trp125, His152, Glu153, His156, His162, and Zn, were found to be majorly participating in the binding process. The catalytic Zn2+ ion and designed compound P-1 were found to interact more efficiently than compound 1. The binding process and contribution energy analysis of Zn2+-containing meprin β and compound P-1 can be very useful for therapeutic development because it explained how the compound P-1, Zn2+ ion, and the amino acid residues collaborated to form the complex's binding interaction.
Furthermore, as the structural integrity is governed by the principal components (PCs), Gibb's free energy landscape (FEL) was constructed using the first two principal components (PC1 and PC2) of the 100 ns MD simulation trajectory as reaction coordinates (Fig. 14).72,73 To generate Gibb's free energy landscape from PC1 and PC2, g_sham (inbuilt script in GROMACS) uses Boltzmann inversion of the multi-dimensional histogram. The blue/dark violet regions analyze the global minima energy conformation, which is an energetically preferred structural conformation as opposed to the unfavorable conformation consisting of red and yellow regions. The shallow and confined energy basin characterizes an unstable structural configuration. It was observed that the meprin β-compound P-1 complex generated multiple clusters and had a larger energy minima region than the meprin β-compound 1 complex (Fig. 14(B)vs.Fig. 14(A)).
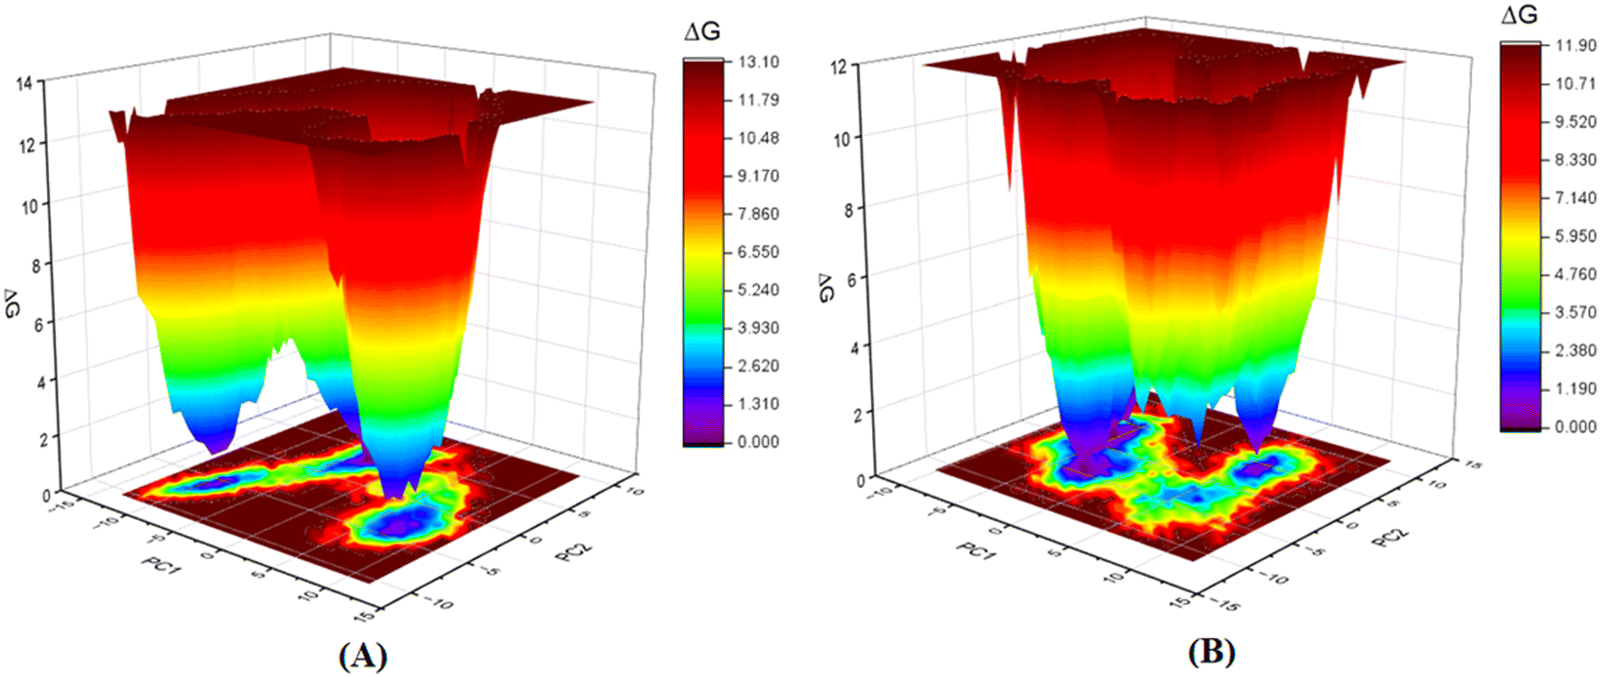 | ||
| Fig. 14 Gibb's free energy landscape plot of (A) meprin β-compound 1 complex, (B) meprin β-compound P-1 complex. | ||
4. Conclusion
Meprin β, a Zn2+ dependent metalloenzyme of the metzincin superfamily, takes part crucially in diverse pathological conditions, including inflammation, fibrosis, neurodegenerative diseases, hyperkeratosis, glomerulonephritis, diabetic kidney injury, inflammatory bowel diseases, and cancer. Surprisingly, there are no such potential meprin β inhibitors in the market to date as effective drug candidates despite the substantial amount of research that has been carried out associated with the abovementioned diseased states involving meprin β. In this article, a handful of existing meprin β inhibitors with a wide range of biological activity variations have been subjected to a non-linear pattern recognition through machine learning (ML)-based model development and binding mode analysis for correlation and identification of crucial structural attributes regulating the biological potency of these inhibitors by governing the interactions in the enzyme active site. Regarding the important structural attributes, it was noticed that the hydroxy function apart from Zn2+, the presence of phenolic hydroxy or carboxylic hydroxy moieties may favor meprin β inhibitory activity by forming suitable hydrogen bonding interactions at the enzyme active site (Fig. 15).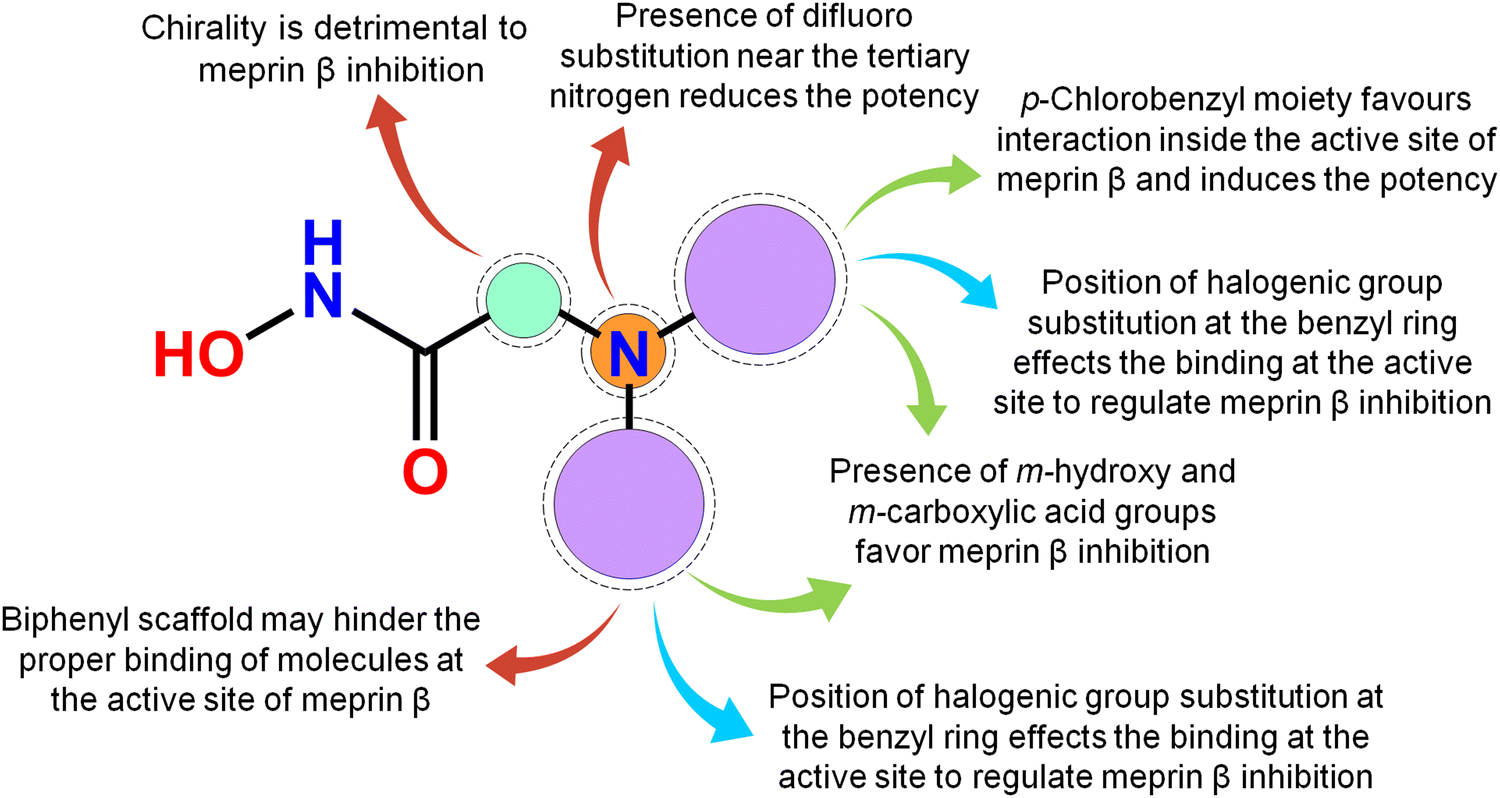 | ||
| Fig. 15 The key featured observations for the meprin β inhibitors obtained from the analysis of ML and the binding mode of interactions. | ||
Further, it was noticed that allyl alcohol fragments in the form of the phenolic group may be advantageous for meprin β inhibition. However, the replacement of the phenolic hydroxy group with methoxy or n-propoxy, or biphenyl scaffold enhanced the hydrophobic character that may decrease meprin β inhibition. Nevertheless, trisubstituted phenolic groups within path length 3 resulted in higher inhibitory potency, probably by forming favorable hydrogen bonding interactions at the enzyme active site. The position of halogen functions in the phenyl group also plays a crucial role. Difluoro substitution adjacent to the tertiary amine moiety yielded lesser inhibition. However, the p-chlorobenzyl moiety produced higher inhibition but the p-fluoro-m-hydroxy benzyl moiety yielded comparatively less meprin β inhibition. Propylene fragment in the form of a phenyl group further justified that the aryl group was necessary for exerting higher inhibition. Moreover, benzodioxole moiety was found to be better compared to the respective dihydrobenzodioxine scaffold. On the other hand, compounds bearing chiral carbon atoms attached to the alkylamide or arylamide moiety were detrimental to the activity. Again, compounds with chiral carbon atoms, along with the adjacent carbonyl function, resulted in inactive compounds. As these crucial features extracted by the ML models were supported by the binding mode of interaction analysis of these inhibitors, these ML models can further identify potential molecules with a similar or superior binding pattern for higher meprin β inhibition. Overall, this study disclosed some crucial structural attributes through several machine learning (ML) models. Depending on these important outcomes, some new molecules were designed and predicted as effective meprin β inhibitors. The MD simulation study also revealed that both the best active molecule (compound 1) and one of the designed molecules (compound P-1) formed stable complexes with meprin β enzyme. The information on the important structural fragments obtained from these validated ML models as well as the observations of this binding mode of interaction study will be useful for further development and identification of potent and effective meprin β inhibitors in the future.
Funding
SB is thankful to the Swami Vivekananda Merit-cum-Means (SVMCM) scholarship, Govt. of West Bengal, India, for awarding the fellowship. NA is thankful to the authority of Jadavpur University for providing a research grant to conduct the research work. BG is thankful to the Department of Health Research, India (File No. 11013_33_2021-GIA HR), Govt. of India and Council of Scientific and Industrial Research (CSIR-37(1722)/19/EMR-II), Govt. of India, for providing research grants.Conflicts of interest
The authors have no conflict of interest.Acknowledgements
The authors are thankful to the Department of Pharmaceutical Technology, Jadavpur University, Kolkata, India, the Department of Pharmacy, BITS-Pilani Hyderabad Campus, Shamirpet, Hyderabad, India, and the School of Medical Science & Technology, Indian Institute of Technology Kharagpur, India for proving the necessary research facilities.References
- N. Adhikari, T. Jha and B. Ghosh, J. Med. Chem., 2021, 64, 8827–8869, DOI:10.1021/acs.jmedchem.0c01676
.
- S. Yoon and G. H. Eom, Chonnam Med. J., 2016, 52, 1–11, DOI:10.4068/cmj.2016.52.1.1
- G. A. Cabral-Pacheco, I. Garza-Veloz, C. Castruita-De la Rosa, J. M. Ramirez-Acuña, B. A. Perez-Romero, J. F. Guerrero-Rodriguez, N. Martinez-Avila and M. L. Martinez-Fierro, Int. J. Mol. Sci., 2020, 21, 9739, DOI:10.3390/ijms21249739
- A. Waheed and W. S. Sly, Gene, 2017, 623, 33–40, DOI:10.1016/j.gene.2017.04.027
- S. Banerjee, S. A. Amin and T. Jha, Curr. Chem. Biol., 2021, 15, 19–49, DOI:10.2174/2212796815666210203104446
- S. K. Baidya, S. Banerjee, N. Adhikari and T. Jha, J. Med. Chem., 2022, 65, 10709–10754, DOI:10.1021/acs.jmedchem.1c01855
- S. K. Baidya, S. A. Amin, S. Banerjee, N. Adhikari and T. Jha, J. Mol. Struct., 2019, 1185, 128–142, DOI:10.1016/j.molstruc.2019.02.081
- S. Banerjee, N. Adhikari, S. A. Amin and T. Jha, Eur. J. Med. Chem., 2019, 164, 214–240, DOI:10.1016/j.ejmech.2018.12.039
- W. Li, W. Lückstädt, B. Wöhner, S. Bub, A. Schulz, E. Socher and P. Arnold, Biochim. Biophys. Acta, Mol. Cell Res., 2022, 1869, 119136, DOI:10.1016/j.bbamcr.2021.119136
- C. Broder and C. Becker-Pauly, Biochem. J., 2013, 450, 253–264, DOI:10.1042/BJ20121751
- J. S. Bond and R. J. Beynon, Pro. Sci., 1995, 4, 1247–1261, DOI:10.1002/pro.5560040701
- W. Stöcker and R. Zwilling, Methods Enzymol., 1995, 248, 305–325, DOI:10.1002/9781119951438.eibc0494
- P. Arnold, I. Boll, M. Rothaug, N. Schumacher, F. Schmidt, R. Wichert, J. Schneppenheim, J. Lokau, U. Pickhinke, T. Koudelka, A. Tholey, B. Rabe, J. Scheller, R. Lucius, C. Garbers, S. Rose-John and C. Becker-Pauly, Sci. Rep., 2017, 7, 44053, DOI:10.1038/srep44053
- C. Broder, P. Arnold, S. Vadon-Le Goff, M. A. Konerding, K. Bahr, S. Müller, C. M. Overall, J. S. Bond, T. Koudelka, A. Tholey, D. J. Hulmes, C. Moali and C. Becker-Pauly, Proc. Natl. Acad. Sci. U. S. A., 2013, 110, 14219–14224, DOI:10.1073/pnas.1305464110
- V. Biasin, M. Wygrecka, L. M. Marsh, C. Becker-Pauly, L. Brcic, B. Ghanim, W. Klepetko, A. Olschewski and G. Kwapiszewska, Sci. Rep., 2017, 7, 39969, DOI:10.1038/srep39969
- T. Bedau, F. Peters, J. Prox, P. Arnold, F. Schmidt, M. Finkernagel, S. Köllmann, R. Wichert, A. Otte, A. Ohler, M. Stirnberg, R. Lucius, T. Koudelka, A. Tholey, V. Biasin, C. U. Pietrzik, G. Kwapiszewska and C. Becker-Pauly, FASEB J., 2017, 31, 1226–1237, DOI:10.1096/fj.201601113R
- D. K. Berner, L. Wessolowski, F. Armbrust, J. Schneppenheim, K. Schlepckow, T. Koudelka, F. Scharfenberg, R. Lucius, A. Tholey, G. Kleinberger, C. Haass, P. Arnold and C. Becker-Pauly, FASEB J., 2020, 34, 6675–6687, DOI:10.1096/fj.201902183R
- J. Bien, T. Jefferson, M. Causević, T. Jumpertz, L. Munter, G. Multhaup, S. Weggen, C. Becker-Pauly and C. U. Pietrzik, J. Biol. Chem., 2012, 287, 33304–33313, DOI:10.1074/jbc.M112.395608
- A. Schütte, A. Ermund, C. Becker-Pauly, M. E. Johansson, A. M. Rodriguez-Pineiro, F. Bäckhed, S. Müller, D. Lottaz, J. S. Bond and G. C. Hansson, Proc. Natl. Acad. Sci. U. S. A., 2014, 111, 12396–12401, DOI:10.1073/pnas.1407597111
- C. Herzog, G. P. Kaushal and R. S. Haun, Cytokine, 2005, 31, 394–403, DOI:10.1016/j.cyto.2005.06.012
- S. Banerjee and J. S. Bond, J. Biol. Chem., 2008, 283, 31371–31377, DOI:10.1074/jbc.M802814200
- F. Peters, S. Rahn, M. Mengel, F. Scharfenberg, A. Otte, T. Koudelka, E. F. Wagner, F. T. Wunderlich, M. Haase, R. Naumann, A. Tholey and C. Becker-Pauly, Matrix Biol., 2021, 102, 37–69, DOI:10.1016/j.matbio.2021.08.002
- B. Oneda, N. Lods, D. Lottaz, C. Becker-Pauly, W. Stöcker, J. Pippin, M. Huguenin, D. Ambort, H. P. Marti and E. E. Sterchi, PLoS One, 2008, 3, e2278, DOI:10.1371/journal.pone.0002278
- J. Gooding, L. Cao, F. Ahmed, J. M. Mwiza, M. Fernander, C. Whitaker, Z. Acuff, S. McRitchie, S. Sumner and E. M. Ongeri, Am. J. Physiol. Renal. Physiol., 2019, 317, F1034–F1046, DOI:10.1152/ajprenal.00166.2019
- Q. Sun, H. J. Jin and J. S. Bond, Exp. Hematol., 2009, 37, 346–356, DOI:10.1016/j.exphem.2008.10.016
- C. Hansch, P. Maloney, T. Fujita and M. M. Robert, Nature, 1962, 194, 178–180, DOI:10.1038/194178b0
-
K. Roy, S. Kar and R. N. Das, A Primer on QSAR/QSPR Modeling: Fundamental Concepts, Springer, New York, 2015 Search PubMed
- J. Mao, J. Akhtar, X. Zhang, L. Sun, S. Guan, X. Li, G. Chen, J. Liu, H. N. Jeon, M. S. Kim, K. T. No and G. Wang, iScience, 2021, 24, 103052, DOI:10.1016/j.isci.2021.103052
- P. Carracedo-Reboredo, J. Liñares-Blanco, N. Rodríguez-Fernández, F. Cedrón, F. J. Novoa, A. Carballal, V. Maojo, A. Pazos and C. Fernandez-Lozano, Comput. Struct. Biotechnol. J., 2021, 19, 4538–4558, DOI:10.1016/j.csbj.2021.08.011
- S. Kolluri, J. Lin, R. Liu, Y. Zhang and W. Zhang, AAPS J., 2022, 24, 19, DOI:10.1208/s12248-021-00644-3
- D. Ramsbeck, A. Hamann, D. Schlenzig, S. Schilling and M. Buchholz, Bioorg. Med. Chem. Lett., 2017, 27, 2428–2431, DOI:10.1016/j.bmcl.2017.04.012
- D. Ramsbeck, A. Hamann, G. Richter, D. Schlenzig, S. Geissler, V. Nykiel, H. Cynis, S. Schilling and M. Buchholz, J. Med. Chem., 2018, 61, 4578–4592, DOI:10.1021/acs.jmedchem.8b00330
- K. Tan, C. Jäger, D. Schlenzig, S. Schilling, M. Buchholz and D. Ramsbeck, ChemMedChem, 2018, 13, 1619–1624, DOI:10.1002/cmdc.201800300
- The Binding Database, https://www.bindingdb.org/bind/index.jsp. As accessed in July 2022.
-
Discovery Studio 3.0., Accelrys Inc., San Diego, USA, 2011, http://www.accelrys.com Search PubMed
- C. W. Yap, J. Comput. Chem., 2011, 32, 1466–1474, DOI:10.1002/jcc.21707
- Pubchem finger print features, https://ftp.ncbi.nlm.nih.gov/pubchem/specifications/pubchem_fingerprints.txt. As accessed in August 2022.
- J. Klekota and F. P. Roth, Bioinformatics, 2008, 24, 2518–2525, DOI:10.1093/bioinformatics/btn479
- S. Banerjee, S. K. Baidya, B. Ghosh, N. Adhikari and T. Jha, New J. Chem., 2022, 46, 11591–11607, 10.1039/D2NJ01923J
- The simple, user-friendly and reliable online standalone tools freely available at http://dtclab.webs.com/software-tools. As accessed in July 2022.
- M. Roubehie Fissa, Y. Lahiouel, L. Khaouane and S. Hanini, J. Mol. Graphics Modell., 2019, 87, 109–120, DOI:10.1016/j.jmgm.2018.11.013
- L. Sun, H. Yang, J. Li, T. Wang, W. Li, G. Liu and Y. Tang, ChemMedChem, 2018, 13, 572–581, DOI:10.1002/cmdc.201700582
- C. H. H. Xuan, L. N. Kion, T. Rahman, H. S. San, W. K. Yam and X. Chee, bioRxiv, 2021, preprint DOI:10.1101/2021.02.23.432583v2.
- D. W. Aha and D. Kibler, M.K. Albert, Mach. Learn., 1991, 6, 37–66, DOI:10.1007/BF00153759
- L. Breiman, Random forests, Mach. Learn., 2001, 45, 5–32, DOI:10.1023/A:1010933404324
- V. Svetnik, A. Liaw, C. Tong, J. C. Culberson, R. P. Sheridan and B. P. Feuston, J. Chem. Inf. Comput. Sci., 2003, 43, 1947–1958, DOI:10.1021/ci034160g
- C. Nantasenamat, T. Naenna, C. Isarankura Na Ayudhya and V. Prachayasittikul, J. Comput.-Aided Mol. Des., 2005, 19, 509–524, DOI:10.1007/s10822-005-9004-4
- C. Nantasenamat, A. Worachartcheewan, S. Jamsak, L. Preeyanon, W. Shoombuatong, S. Simeon, P. Mandi, C. Isarankura-Na-Ayudhya and V. Prachayasittikul, Methods Mol. Biol., 2015, 1260, 119–147, DOI:10.1007/978-1-4939-2239-0_8
- S. K. Shevade, S. S. Keerthi, C. Bhattacharyya and K. K. Murthy, Neural Networks, 2000, 11, 1188–1193, DOI:10.1109/72.870050
- C. Nantasenamat, C. Isarankura-Na-Ayudhya, T. Naenna and V. Prachayasittikul, J. Mol. Graphics Modell., 2008, 27, 188–196, DOI:10.1016/j.jmgm.2008.04.005
- V. Vapnik, An Overview of Statistical Learning Theory, Wiley, New York, 1998 DOI:10.1109/72.788640.
- P. Itskowitz and A. Tropsha, J. Chem. Inf. Model., 2005, 45, 777–785, DOI:10.1021/ci049628
- W. Zheng and A. Tropsha, J. Chem.
Inf. Comput. Sci., 2000, 40, 185–194, DOI:10.1021/ci980033m
- S. Ajmani, K. Jadhav and S. A. Kulkarni, J. Chem. Inf. Model., 2006, 46, 24–31, DOI:10.1021/ci0501286
- S. A. Amin, N. Adhikari, S. Gayen and T. Jha, J. Mol. Struct., 2017, 1143, 49–64, DOI:10.1016/j.molstruc.2017.04.020
- R. Rodríguez-Pérez and J. Bajorath, J. Comput.-Aided Mol. Des., 2022, 36, 355–362, DOI:10.1007/s10822-022-00442-9
-
M. K. Gupta, S. Gupta and R. K. Rawal, Impact of artificial neural networks in QSAR and computational modeling, in Artificial Neural Network for Drug Design, Delivery and Disposition, ed. M. Puri, Y. Pathak, V. K. Sutariya, S. Tipparaju, W. Moreno, Academic Press, 2016, ch. 8, pp. 153–179 DOI:10.1016/B978-0-12-801559-9.00008-9
-
M. Hall, E. Frank, G. Holmes, B. Pfahringer, P. Reutemann and I. H. Witten, ACM SIGKDD Explor. Newslet., 2009, 11, 10–18 DOI:10.1145/1656274.1656278
- Y. Shi, Sci. Rep., 2021, 11, 8806, DOI:10.1038/s41598-021-88341-1
- Groningen machine for chemical simulations; software available at https://www.gromacs.org/. As accessed in December 2022.
- H. J. C. Berendsen, D. van der Spoel and R. van Drunen, Comput. Phys. Commun., 1995, 1–2, 43–56, DOI:10.1016/0010-4655(95)00042-E
- R. B. Best, X. Zhu, J. Shim, P. E. Lopes, J. Mittal, M. Feig and A. D. Mackerell Jr, J. Chem. Theory Comput., 2012, 8, 3257–3273, DOI:10.1021/ct300400x
- CHARMM General Force Field (CGenFF); available at https://cgenff.umaryland.edu/. As accessed in December 2022.
- A. A. Al-Karmalawy, M. A. Dahab, A. M. Metwaly, S. S. Elhady, E. B. Elkaeed, I. H. Eissa and K. M. Darwish, Front. Chem., 2021, 9, 661230, DOI:10.3389/fchem.2021.661230
- V. L. Golo and K. V. Shaĭtan, Biofizika, 2002, 47, 611–617 CAS
- S. C. Tuble, J. Anwar and J. D. Gale, J. Am. Chem. Soc., 2004, 126, 396–405, DOI:10.1021/ja0356131
- R. Kumari, R. Kumar, R. Open Source Drug Discovery Consortium and A. Lynn, J. Chem. Inf. Model., 2014, 54, 1951–1962, DOI:10.1021/ci500020m
- RCSB Protein Data Bank, https://www.rcsb.org/. As accessed in August 2022.
- M. Linnert, C. Fritz, C. Jäger, D. Schlenzig, D. Ramsbeck, M. Kleinschmidt, M. Wermann, H. U. Demuth, C. Parthier and S. Schilling, Int. J. Mol. Sci., 2021, 22, 5651, DOI:10.3390/ijms22115651
- N. Adhikari, S. A. Amin, B. Ghosh and T. Jha, J. Biomol. Struct. Dyn., 2018, 36, 3003–3022, DOI:10.1080/07391102.2017.1374210
- http://www.swissadme.ch/. As accessed in September 2022.
- R. Majumder, C. K. Das, I. Banerjee, B. C. Jena, A. Mandal, P. Das, A. K. Pradhan, S. Das, P. Basak, S. K. Das, L. Emdad, P. B. Fisher and M. Mandal, Comput. Biol. Med., 2022, 141, 105052, DOI:10.1016/j.compbiomed.2021.105052
- P. Das, R. Majumder, M. Mandal and P. Basak, J. Biomol. Struct. Dyn., 2021, 39, 1–16, DOI:10.1080/07391102.2020.1796799
Footnote |
| † Electronic supplementary information (ESI) available. See DOI: https://doi.org/10.1039/d2nj04753e |
| This journal is © The Royal Society of Chemistry and the Centre National de la Recherche Scientifique 2023 |