
Selection of chromatographic separation conditions for reliable monitoring of the transformation of AgNPs/Ag(I) species by HPLC-ICP-MS in surface water and green algae cells†
Julita
Malejko
 ,
Weronika
Liszewska
and
Beata
Godlewska-Żyłkiewicz
*
,
Weronika
Liszewska
and
Beata
Godlewska-Żyłkiewicz
*
Department of Analytical and Inorganic Chemistry, Faculty of Chemistry, University of Bialystok, K. Ciołkowskiego 1K, 15-245 Białystok, Poland. E-mail: bgodlew@uwb.edu.pl
First published on 31st October 2023
Abstract
A new method based on high performance liquid chromatography (HPLC) coupled with inductively coupled plasma mass spectrometry (ICP-MS) has been developed for the speciation analysis of silver nanoparticles (AgNPs) and dissolved silver forms (Ag(I)) in surface water and algal cells. Different compositions of the mobile phase, including surfactants preventing agglomeration/aggregation of AgNPs, pH buffers and complexing agents for silver ions, were carefully investigated to ensure complete elution and stability of silver species during chromatographic analysis. Under the optimal separation conditions (mobile phase: 10 mM sodium dodecyl sulfate, 2 mM citrate buffer, and 2 mM tiopronin), detection limits of 2.0 ng L−1 for Ag(I), 3.1 ng L−1 for 10 nm AgNPs, and 2.2 ng L−1 for 30 nm AgNPs were achieved. A linear relationship was found between the retention time of AgNPs and logarithm of particle diameter up to 40 nm, which can be used for the particle size determination in real samples. The HPLC-ICP-MS method has been successfully applied to study interactions of Ag(I) and citrate-stabilized AgNPs of different nominal diameters (10 nm and 30 nm) with green microalgae Acutodesmus obliquus in river water. The cell-associated fractions of silver were quite similar for all studied forms (silver biosorption was in the range of 77.2–82.7%). As a result of interaction with the biomass, biosynthesis of small nanoparticles (with a size of 6 nm) from Ag(I) ions and partial dissolution of 10 and 30 nm AgNPs were observed.
1. Introduction
Silver nanoparticles (AgNPs) are one of the most commercialized nanomaterials on the market. According to The Nanodatabase (developed by the Technical University of Denmark),1 nanosilver is now present in almost 570 consumer products, including antibacterial face masks, anti-odour sportswear, underwear and socks, disinfecting sprays, water filters, cosmetics (e.g. deodorants, soaps, toothpastes), food contact materials, and food supplements. The growing production and application of silver nanoparticles will certainly lead to the release of such materials into the aquatic environment, where they can be taken up by living organisms and enter the food chain.Microalgae species are a common aquatic biological model to study the uptake and toxicity of nanoparticles. Current investigations on the effects of NPs on microalgae have been recently reviewed.2 They depend mostly on the particle size, elemental composition, concentration, surface coating, shape, aggregation/agglomeration status, and tendency towards dissolution. However, these studies are mostly performed in laboratory conditions and there are still uncertainties and contradictory results about the behavioural effects of NPs under field conditions. Moreover, silver nanoparticles release silver ions under environmental conditions which may strongly contribute to the biological activity of AgNPs.3 It should be noted4 that in many studies on the exposure of organisms to AgNPs the need for characterization of the soluble silver fraction present in AgNP suspensions is still ignored, which possibly results in partial misinterpretation of the data obtained. Therefore, the dissolution of AgNPs should be taken into account when conducting research on the potential impact of AgNPs on living organisms.
Characterisation of the physico-chemical properties of nanoparticles requires application of various methods, such as microscopic, spectroscopic, mass spectrometric, and size-fractionation, which provide complementary information about nanoparticles.5,6 Among them, inductively coupled plasma-mass spectrometry (ICP-MS) has sufficiently low detection limits and selectivity for the analysis of trace levels of metallic nanoparticles in complex environmental and biological samples. However, this requires operation of ICP-MS in single particle mode or in combination with a separation technique, such as field flow fractionation (FFF), capillary electrophoresis (CE) or high performance liquid chromatography (HPLC). Despite the many excellent analytical capabilities of the single particle ICP-MS method, its application is restricted by particle size detection limit, which is about 20 nm for AgNPs in model solutions and even higher in real samples (e.g. 34 nm for lysates of green algal cells).7 This can be overcome by application of hyphenated techniques, such as HPLC-ICP-MS, which enable detection of smaller particles (from ∼1 nm). The chromatographic separation of the nano and dissolved forms of silver was performed on a reversed-phase column (Nucleosil C18) with relatively wide pore sizes (1000 Å and 4000 Å)8–10 or amino column (Venusil Durashell-NH2) with pore sizes of 500 Å and 1000 Å.11–14 The irreversible adsorption of particles onto the column packing materials was overcome by using a suitable surfactant in the mobile phase: SDS (sodium dodecyl sulphate) on a C18 column or FL-70 (a mixture of nonionic and anionic surfactants) on an amino column. In order to elute ionic silver species, sodium thiosulfate was added to the mobile phase. Positively charged silver ions were converted into anionic thiosulfate complexes, which prevented their adsorption on the column material negatively charged by SDS modification (as R–OSO3−Ag+).8 However, such eluent caused partial degradation of NPs, resulting in an ionic content of 65.1% for the in-house certified reference material of AgNPs (BAM N-001) compared to 7.9% detected using ultrafiltration as was shown by Sötebier et al.9,15 Moreover, other authors11 observed that in the presence of Na2S2O3 in the mobile phase the signal intensity of AgNPs decreased significantly. The phenomenon of the appearance of Ag(I) peaks in the chromatograms and the increase in the retention time with increasing thiosulfate concentration was explained by the release of Ag+ adsorbed on AgNPs and/or the dissolution of AgNPs.11 In another study, the addition of DL-penicillamine as a complexing agent for Ag+ was proposed as it provided a higher stability of AgNPs than thiosulfate.9 Despite these problems the HPLC-ICP-MS methods were applied for the analysis of Ag speciation in commercial antibacterial products (sports socks,8 nasal spray and kitchen cleansing spray10), environmental waters,11 fetal bovine serum,12 and rat liver in vivo,13 as well as for the analysis of the uptake, biodistribution, and transformation of silver nanoparticles and ions in bacteria Escherichia coli.14
It is well known that the analytical methods for the simultaneous determination of silver ions and nanoparticles in environmental and biological matrices should not affect the original forms of the analyte in the sample. Fulfilling this assumption is difficult in the case of silver speciation because the high reactivity of silver forms may lead to their mutual transformations or formation of new species during sample preparation and analysis. The aim of this work was to develop a new HPLC-ICP-MS method for reliable speciation analysis of the nano and dissolved forms of silver in surface water and algal cells. Particular attention was paid to optimization of the mobile phase composition during chromatographic separation in order to ensure the stability of the silver forms and their complete elution from the HPLC column. Among several reagents tested only 2 mM tiopronin used as an Ag+ complexing agent ensured the stability of both silver species during their chromatographic separation and ICP-MS analysis. The study included determination of biosorption and examination of the transformation of silver species by green microalgae Acutodesmus obliquus. The algae cells suspended in surface water were exposed to citrate-stabilized AgNPs of various sizes (10 and 30 nm) and Ag(I) ions at environmentally relevant concentrations (μg L−1) for a period of 24 hours. The total silver content in algal cells and supernatants was quantified by the ICP-MS method, while the identification of the individual forms of silver and characterization of the hydrodynamic diameter of AgNPs were performed by the developed HPLC-ICP-MS method.
2. Experimental
2.1. Instrumentation
The total silver content was determined using an ICP-MS (8800 ICP-QQQ, Agilent Technologies, Singapore) equipped with a MicroMist glass concentric nebulizer, Scott-type quartz spray chamber, quartz torch with a 2.5 mm injector, nickel interface cones, and a collision/reaction cell (octopole reaction system ORS3). The operating parameters of the ICP-MS are listed in Table 1. The data were processed using Agilent Mass Hunter software.| HPLC | |
|---|---|
| Column | Nucleosil C18 (250 × 4.6 mm, 7 μm particle size, 1000 Å pore size) |
| PLRP-S4000 column (150 × 4.6 mm, 8 μm particle size, 4000 Å pore size) | |
| Mobile phase | 10 mM SDS, 2 mM citrate buffer, 2 mM tiopronin, pH 4.5 |
| Flow rate | 0.5 mL min−1 |
| Analysis time | 7 min |
| Injection volume | 50 μL |
| ICP-MS | |
|---|---|
| RF power | 1550 W |
| Plasma gas flow | 15 L min−1 |
| Auxiliary gas flow | 1 L min−1 |
| Carrier gas flow | 1.05 L min−1 |
| Scan type | Single Quad |
| Plasma mode | General purpose |
| Cell mode | No gas (HPLC-ICP-MS) |
| No gas and He (ICP-MS) | |
| Acquisition mode | Time resolved analysis |
| Monitored isotope | 107Ag |
| Integration time | 0.5 s (HPLC-ICP-MS) |
| 0.3 s (ICP-MS) | |
The chromatographic separation of silver species was performed on an Agilent 1260 Infinity HPLC (Agilent Technologies, Germany). The chromatographic system was connected to an 8800 ICP-QQQ via a MicroMist nebulizer. All connections in the HPLC system and a 100 μL sample loop were made of PEEK. The silver species were separated on a Nucleosil C18 column (250 × 4.6 mm, 7 μm particle size, 1000 Å pore size) from Macherey-Nagel (Germany) and PLRP-S4000 column (150 × 4.6 mm, 8 μm particle size, 4000 Å pore size) with rigid poly(styrene/divinylbenzene) particles from Agilent Technologies (GB). The columns were operated at a temperature of 25 °C. The mobile phases were delivered with a flow rate of 0.5 mL min−1. The optimized conditions of HPLC separation are given in Table 1.
A Millipore Direct-Q 3 UV water purification system (France) was used to obtain ultrapure water. An MPW-350 centrifuge (MPW Med. Instruments, Poland) was used for separation of algal cells from the culture medium. A VCX 130 ultrasound processor (max. frequency 20 kHz, max. power 130 W) with a titanium probe (Sonics & Materials Inc., USA) was used for mechanical disruption of the algal cell wall.
A Milestone Ethos Lean (Italy) microwave unit with a MAXI-14 rotor and T2 infrared temperature control was used for digestion of samples.
2.2. Reagents and materials
Concentrated HNO3 (≥69%, TraceSelect, Fluka) and hydrogen peroxide (≥30%, for trace analysis, Sigma-Aldrich) were used for sample digestion. Sodium dodecyl sulfate (SDS, ≥99.5%) and sodium thiosulfate pentahydrate from Carl Roth, Tween 80, Triton X-100, Triton X-114, L-cysteine, D-penicillamine (3,3-dimethyl-D-cysteine, 98–101%), tiopronin (N-(2-mercaptopropionyl)glycine, ≥98%), and citrate buffer solution (0.09 mol L−1, pH 4.8) from Sigma-Aldrich, and ammonium acetate (≥99.0%, for HPLC) from Fluka were used for the preparation of the mobile phases.The ionic silver standard for ICP (1000 ± 5 mg L−1 in 2% HNO3) was obtained from Sigma-Aldrich and citrate stabilized silver nanoparticles with nominal diameters of 10 ± 2 nm, 20 ± 4 nm, 30 ± 3 nm, and 40 ± 5 nm were supplied by NanoComposix. The concentrations of Ag in AgNP stock suspensions (19.84 ± 0.58 mg L−1 for 10 nm AgNPs, 15.48 ± 0.40 mg L−1 for 20 nm AgNPs, 20.30 ± 0.68 mg L−1 for 30 nm AgNPs, and 20.73 ± 0.54 mg L−1 for 40 nm AgNPs) were determined by ICP-MS after nanoparticle digestion in concentrated nitric acid. Before HPLC-ICP-MS analysis, the stock solutions of silver nanoparticles were vigorously shaken (∼1 min) and diluted with 10 mM SDS solution. The final AgNPs and Ag(I) solutions injected to the HPLC system were prepared in the appropriate mobile phase.
ICP-MS stock tuning solution containing 10 mg L−1 each of Li, Y, Ce, Tl, and Co in 2% HNO3 was supplied by Agilent Technologies. Indium (1000 mg L−1, In(NO3)3 in 2% HNO3) from Merck was used as an internal standard for direct ICP-MS measurements.
Bold's Basal Medium (BBM) (an inorganic salts medium, pH = 7.0 (ref. 16)) was used for the culture of freshwater algae Acutodesmus obliquus.
Fresh surface water used in this study was collected from Supraśl river located in north-eastern Poland near Bialystok city and filtered through a membrane filter (Nylon, pore size 0.45 μm, Agilent). The parameters of the surface water were: pH 7.8 ± 0.1, total organic carbon 12.0 mg L−1, dissolved organic carbon 10.8 mg L−1, total metal content 9.9 mg L−1 Mg, 12.1 mg L−1 Ca, 0.5 μg L−1 Cr, 51.5 μg L−1 Mn, 152.1 μg L−1 Fe, 1.3 μg L−1 Cu, 3.9 μg L−1 Zn, 0.3 μg L−1 Pb.
2.3. Incubation of algae with silver species
The wild-type Acutodesmus obliquus (formerly named Scenedesmus obliquus (Turpin) Kützing, SAG strain no. 276-6) was purchased from SAG Culture of Algae Collection (Germany). Cultivation of algae in Bold Basal Medium was described in detail elsewhere.17 The algal cells were separated from the BBM by filtration (membrane filter with a pore size of 0.2 μm, Macherey-Nagel) and rinsed twice with 50 mL of Milli-Q water. Then, the separated cells (∼100 mg fresh weight) were re-suspended in 50 mL of surface water in Erlenmeyer flasks (250 mL) and were spiked individually with Ag(I) and AgNPs (10 nm and 30 nm) standards to a final silver concentration of 50 μg L−1. Control non-spiked samples were also prepared. Algae were incubated for the next 24 hours under controlled sterile conditions described elsewhere.7 Next, samples were centrifuged (10 min, 4000 rpm) to separate cells from the test medium. The cells were rinsed with 6 mL of ultrapure water to remove weakly associated silver species. The total content of silver in algal cells and supernatants was determined by ICP-MS (Section 2.4), whereas the speciation analysis of silver was performed by the HPLC-ICP-MS method (Section 2.5).2.4. Total silver content
The algal cells after incubation were transferred to Teflon vessels and digested in a microwave system with concentrated HNO3 (5 mL) and H2O2 (1 mL) using the following programme: 10 min to reach 150 °C, then 10 min to reach 180 °C and 15 min at 180 °C. The digested solutions were appropriately diluted with 2% HNO3 and analysed by ICP-MS. The supernatants were also diluted with 2% HNO3 before ICP-MS analysis. The limit of detection (LOD) for the determination of silver by ICP-MS was 3.1 ng L−1.72.5. Speciation analysis of silver by HPLC-ICP-MS
The algal cells after incubation were re-suspended in 5 mL of 10 mM SDS and were disrupted with an ultrasound probe for 15 min (amplitude: 100%, pulse mode: ON – 6 s, OFF – 2 s). During this stage, the sample tube was cooled with ice to avoid heating the sample. The suspensions were left for 24 h at room temperature. Before analysis they were re-sonicated for 5 min. The obtained cell lysates, after appropriate dilution with a mobile phase (10 mM SDS, 2 mM citrate buffer, 2 mM tiopronin) and filtration through a membrane filter (0.45 μm, Nylon, Agilent), were analysed by HPLC-ICP-MS.3. Results and discussion
3.1. Biosorption of silver species by algae
The biosorption of AgNPs and Ag(I) by A. obliquus was studied under conditions described in Section 2.3 and calculated according to the formula:where B is the biosorption (efficiency of analyte retention by algae in %), mAg(algae) is the mass of silver associated with algal cells, and mAg(added) is the known mass of silver added to the sample.
The biosorption was 82.3 ± 3.1% for Ag(I), 77.2 ± 2.0% for 10 nm AgNPs, and 82.7 ± 2.0% for 30 nm AgNPs (see Table 1S† for details). The amount of bound silver per gram of dry weight of algae (uptake) was also calculated. The uptake was equal to 143.0 ± 6.1 μg g−1 d.w. for Ag(I), 131.2 ± 2.4 μg g−1 d.w. for 10 nm AgNPs, and 143.8 ± 8.4 μg g−1 d.w. for 30 nm AgNPs. The obtained results indicate that the cell-associated fractions of silver are quite similar regardless of the form of analyte. Our previous study showed that biosorption of citrate stabilized AuNPs (50 μg L−1) on green algae Desmodesmus subspicatus in surface water was size dependent and increased with particle size from 49.1% for 10 nm AuNPs to 96.3% for 40 nm AuNPs.18 The biosorption of AgNPs (5 μg L−1) stabilized with polyvinylpyrrolidone (PVP) also depended on the particle size, but decreased from 56.1% to 37.7% with increasing NP diameter from 40 nm to 75 nm, respectively.7 Our studies confirm that the behaviour of metallic NPs in the environment depends on many factors, mostly on particle size, concentration, composition, and surface coatings.
The overall procedural recovery was calculated as the percentage of analyte recovered after the incubation test (mass of silver in the algal cells and supernatants) versus the nominal amount of analyte added to the sample. The quantitative values of recovery were obtained: 92.8 ± 2.7% for Ag(I), 87.3 ± 0.5% for 10 nm AgNPs, and 91.0 ± 2.6% for 30 nm AgNPs.
3.2. Development of the HPLC-ICP-MS method for speciation analysis of silver species
Two columns with different parameters were tested to separate the nano and dissolved forms of silver: a reversed phase Nucleosil C18 (1000 Å pore size) and polymeric reversed phase PLRP-S4000 (4000 Å pore size). The Nucleosil C18 has already been used for the separation of Ag(I) and AgNPs,8–10 whereas the PLRP-S column has been used for the speciation analysis of Au(III) and AuNPs.19,20 Anionic surfactant sodium dodecyl sulfate (SDS) at a concentration of 10 mM was used as the mobile phase in order to avoid agglomeration/aggregation of AgNPs and their irreversible adsorption onto the column. It was observed that the column pore size and column length affected the chromatographic resolution. Better peak separation was achieved on the Nucleosil C18 column (retention time, RT = 4.252 min for 10 nm AgNPs and 3.735 min for 40 nm AgNPs) in comparison with the PLRP-S4000 column (RT = 3.281 min for 10 nm AgNPs and 3.089 min for 40 nm AgNPs). However, Ag(I) ions were retained completely in both columns. Other surfactants tested in this work (Triton X-100 at concentrations of 1 mM and 5 mM, 0.2–5 mM Triton X-114, and 0.05–5 mM Tween 80) did not improve the recovery of Ag(I) from the column. In order to reduce Ag(I) interaction with the stationary phase, the addition of the complexing agent and pH buffer to the mobile phase was tested. Initially, sodium thiosulfate (1 mM) and ammonium acetate (10 mM) at pH 6.8 were used for this purpose. Optimization of the composition of the mobile phase was performed on the Nucleosil C18 column. The experiments were carried out with Ag(I) and AgNPs standards with silver concentration of 20 μg L−1, injection volume of 5 μL and flow rate of the mobile phase of 0.5 mL min−1.
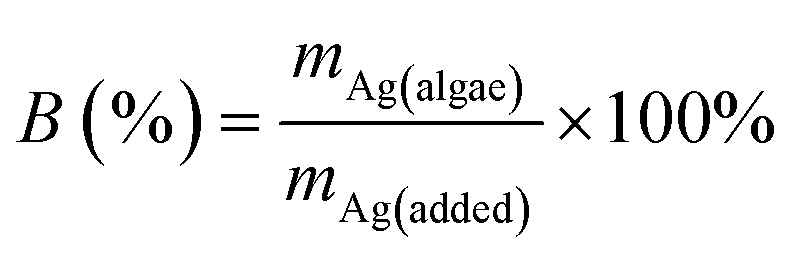
The mobile phase containing 10 mM SDS, 10 mM CH3COONH4, and 1 mM Na2S2O3 enabled elution of AgNPs and Ag(I) from the column, but resulted in the transformation of AgNPs into Ag(I), as can be seen in Fig. 1A. The retention time of 10 nm AgNPs shifted from 4.85 min to 4.94 min during 10 subsequent injections of the same solution, indicating reduction of particle size. Moreover, a second peak appeared at the retention time corresponding to Ag(I) (5.65 min), whose area was increasing for subsequent injections, indicating the gradual dissolution of nanoparticles. It was shown in the literature21,22 that in the presence of thiosulfate, the standard potential of Ag+/Ag is reduced from 0.80 to 0.01 V. Therefore, Ag can be oxidized to Ag+ by dissolved O2 and form Ag(S2O3)23− complexes. Ruiz et al.23 showed fast dissolution of Ag (less than 20 min) at neutral pH and formation of two complexes: Ag(S2O3)35− (predominant species) and Ag(S2O3)23−. Due to such behaviour thiosulfates were even used for leaching of silver from sulfurous minerals. A similar effect of AgNPs dissolution in the presence of thiosulfates was observed by Zhou et al.11 and Sötebier et al.9 As can be seen in Fig. 1B, the peak areas of Ag(I) derived from dissolution of 10 nm, 20 nm, and 40 nm AgNPs depended on the nanoparticle size: the highest areas and the most pronounced increase over time were observed for 10 nm AgNPs. Since the smallest particles were the most susceptible to dissolution, further mobile phase optimization was carried out for 10 nm AgNPs.
 | ||
| Fig. 1 Chromatograms of 10 nm AgNPs (mobile phase: 10 mM SDS, 10 mM CH3COONH4, 1 mM Na2S2O3) for 10 successive injections of the same solution (A), and changes of peak area of Ag(I) dissolved from AgNPs for successive injections of the same solution (B). Arrows indicate the direction of changes in the chromatograms during subsequent injections. | ||
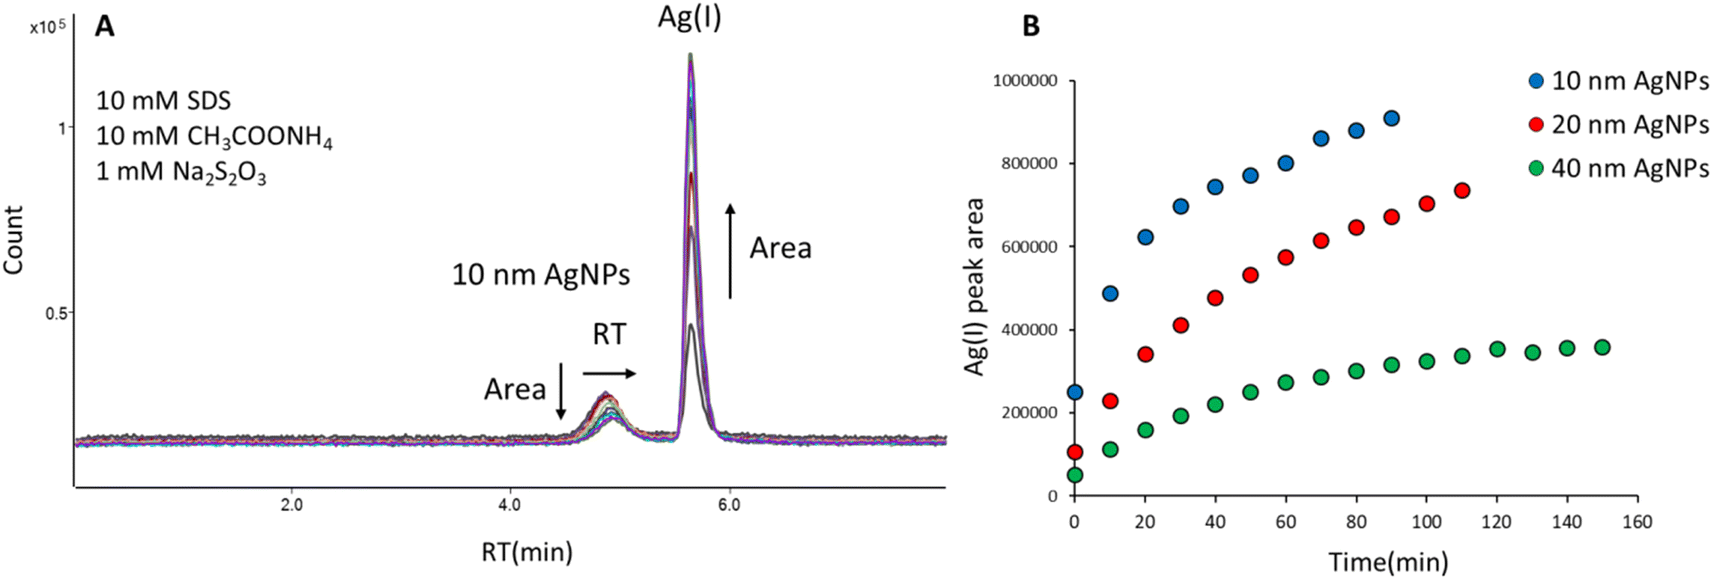
In subsequent studies, D-penicillamine (DPA), a ligand having both thiol and carboxyl functional groups, was used as a complexing agent for Ag(I). The mobile phase containing 10 mM SDS, 10 mM ammonium acetate, and 0.5 mM DPA eluted AgNPs and Ag(I) from the column, but affected the stability of AgNPs. The peak area of 10 nm AgNPs was decreasing, while the peak area of Ag(I) formed from AgNPs was increasing with time (Fig. 2). The observed dissolution of AgNPs in the presence of penicillamine is in agreement with the studies performed by Men et al.24 A similar effect was observed using another biologically important thiol, L-cysteine (mobile phase: 10 mM SDS, 10 mM ammonium acetate, 1 mM L-cysteine).
 | ||
| Fig. 2 Chromatograms of 10 nm AgNPs (mobile phase: 10 mM SDS, 10 mM CH3COONH4, 0.5 mM D-penicillamine) for 5 successive injections of the same solution (every 8 min). Arrows indicate the direction of changes in the chromatograms during subsequent injections. | ||
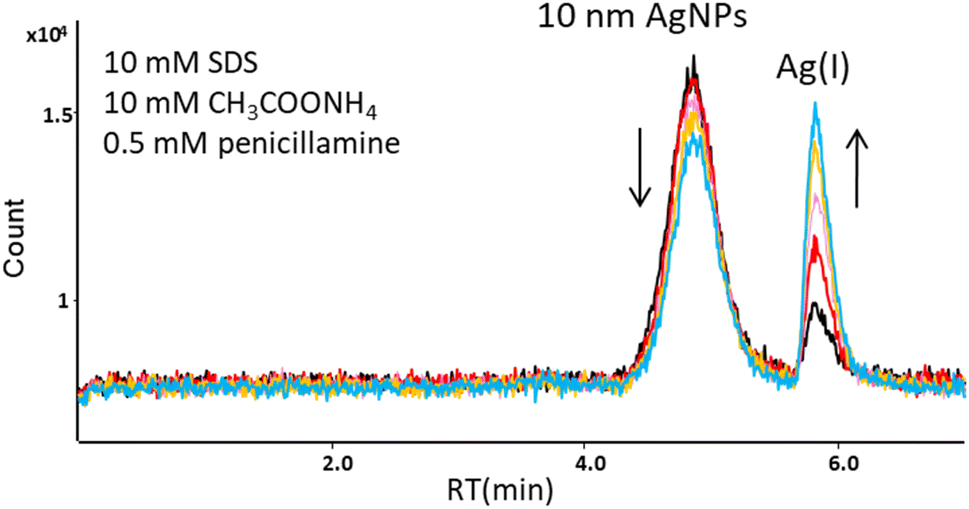
Finally, as a complexing agent for Ag(I) tiopronin (TP) was applied. This ligand has already been used as a component of background electrolyte (with Triton X-100 and cyclohexylaminoethane sulfonic acid (CHES) at pH 9.5) to facilitate the separation of ionic silver from nanoparticles by capillary electrophoresis.25 In our studies the mobile phase containing 10 mM SDS, 10 mM ammonium acetate, and 0.5 mM TP (pH 6.1) enabled elution of AgNPs from the C18 column with no significant transformation of nanoparticles (the relative standard deviation (RSD) for peak area was 2.9% for 6 successive injections of the same solution of 10 nm AgNPs), but resulted in the formation of two forms of Ag(I) (Fig. 3A). The concentration of one form with the retention time of 5.31 min was increasing and the other with the retention time of 5.52 min was decreasing over time (50 minutes passed between the first and last injections). This was probably due to gradual formation of complexes between Ag(I) and tiopronin molecules. Padmos et al.26 showed that complexes with more than one Ag atom per S can be formed with some low-molecular-weight thiols, such as tiopronin.
 | ||
| Fig. 3 Chromatograms of 10 nm AgNPs and Ag(I) for the following mobile phases: (A) 10 mM SDS, 10 mM CH3COONH4, 0.5 mM tiopronin (3 injections of the same solution, 2nd peak after 8 min and 3rd peak after 50 min), (B) 10 mM SDS, 2 mM citrate buffer, 5 mM tiopronin (4 successive injections of the same solution every 8 min), (C) 10 mM SDS, 2 mM citrate buffer, 2 mM tiopronin (5 successive injections of the same solution every 8 min). Arrows indicate the direction of changes in the chromatograms during subsequent injections. | ||
In order to stabilize the Ag(I) and prevent inter-species conversion, we optimized the concentration of tiopronin as well as the type and concentration of the pH buffer. Lower concentrations of ammonium acetate (5 mM and 1 mM) and higher concentration of TP (1 mM) were tested; however, two forms of Ag(I) were still observed. In further studies, ammonium acetate was replaced with citrate buffer (pH 4.8). The tested concentrations were 2 and 5 mM for citrate buffer and 1, 2, and 5 mM for tiopronin. A single peak for the dissolved form of silver was obtained for 2 mM citrate buffer and 2 mM or 5 mM tiopronin. However, the concentration of 5 mM tiopronin turned out to be too high as it affected the retention time of nanoparticles. The RT of 10 nm AgNPs shifted from 4.55 min to 4.16 min during 4 subsequent injections of the same solution (Fig. 3B), indicating an increase in the hydrodynamic size of NPs, most likely due to sorption of tiopronin molecules on the particle surface. Some authors suggest that the thiolate groups of tiopronin cause sulfidation at AgNP surfaces, which was already used for protection of silver nanoparticles.26,27 Therefore, the chosen composition of the mobile phase was: 10 mM SDS + 2 mM citrate buffer + 2 mM tiopronin. As can be seen in Fig. 3C, a baseline separation of 10 nm AgNPs and Ag(I) was achieved. A small peak appearing on the AgNPs chromatogram at the retention time corresponding to Ag(I) accounted for up to 10% of the nano form, which was considered acceptable.
![[thin space (1/6-em)]](https://www.rsc.org/images/entities/char_2009.gif) 295
295Fig. 4A shows the overlaid chromatograms obtained under optimal separation conditions for Ag(I), 10, 20, 30, and 40 nm AgNPs. The Ag(I) elutes at 5.27 min, whereas nanoparticles elute at different retention times depending on their size: 4.64 min (10 nm), 4.22 min (20 nm), 4.00 min (30 nm), and 3.83 min (40 nm), indicating that separation is based on a size-exclusion-like mechanism. A linear relationship was observed between the retention time of nanoparticles and logarithm of particle diameter (Fig. 4B). The obtained calibration plot can be used for the size characterization of silver nanoparticles in real samples. It is worth mentioning that the HPLC method allows for determination of the hydrodynamic diameter of particles which includes the core diameter and the corona thickness.
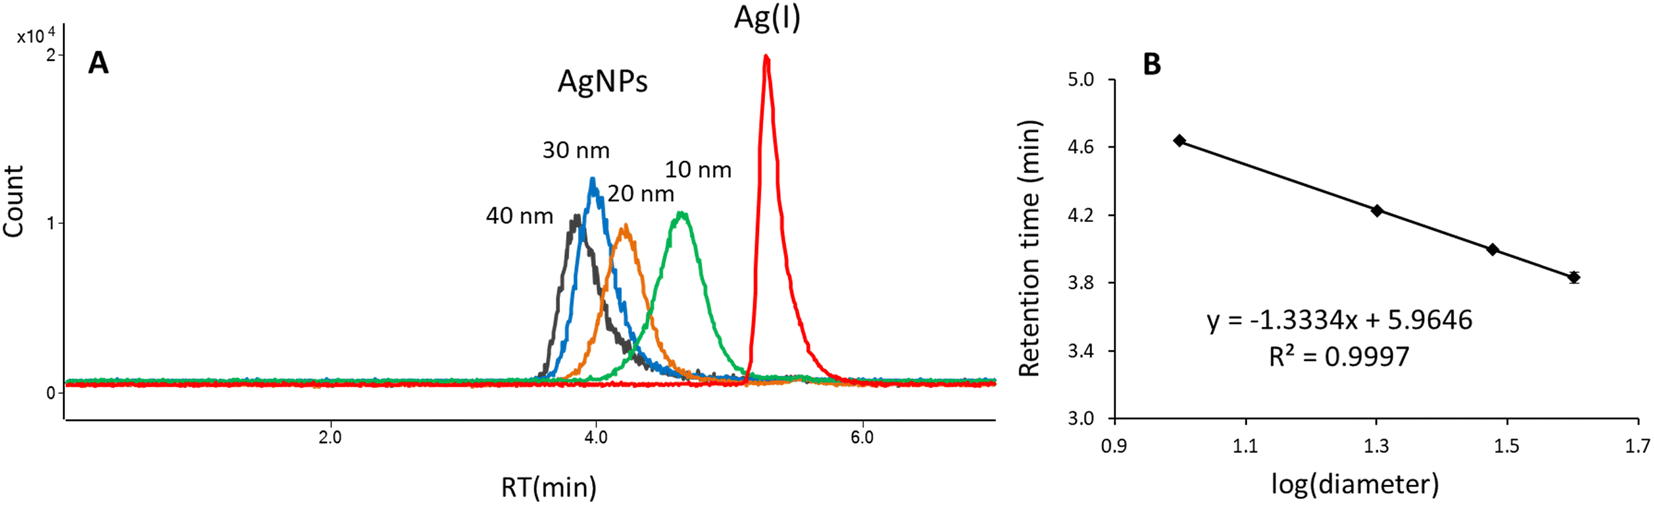 | ||
| Fig. 4 Chromatograms of Ag(I) and 10, 20, 30, and 40 nm AgNPs (A), and particle size calibration (B). | ||
3.3. Transformation of AgNPs and Ag(I) in a water–green algae environment
The developed HPLC-ICP-MS method was applied to study the transformation of AgNPs of different sizes (10 and 30 nm) and Ag(I) by algae A. obliquus after 24 h incubation in surface water. The incubation test and preparation of cell lysate were performed according to the procedure detailed under Sections 2.3 and 2.5. The chromatograms of supernatants and lysates are shown in Fig. 5. The retention times of Ag(I) and AgNPs standards in the mobile phase are shown as vertical lines. The average diameters of nanoparticles detected in samples, derived from their retention time and the correlation equation given in Fig. 4B, are also presented in Fig. 5.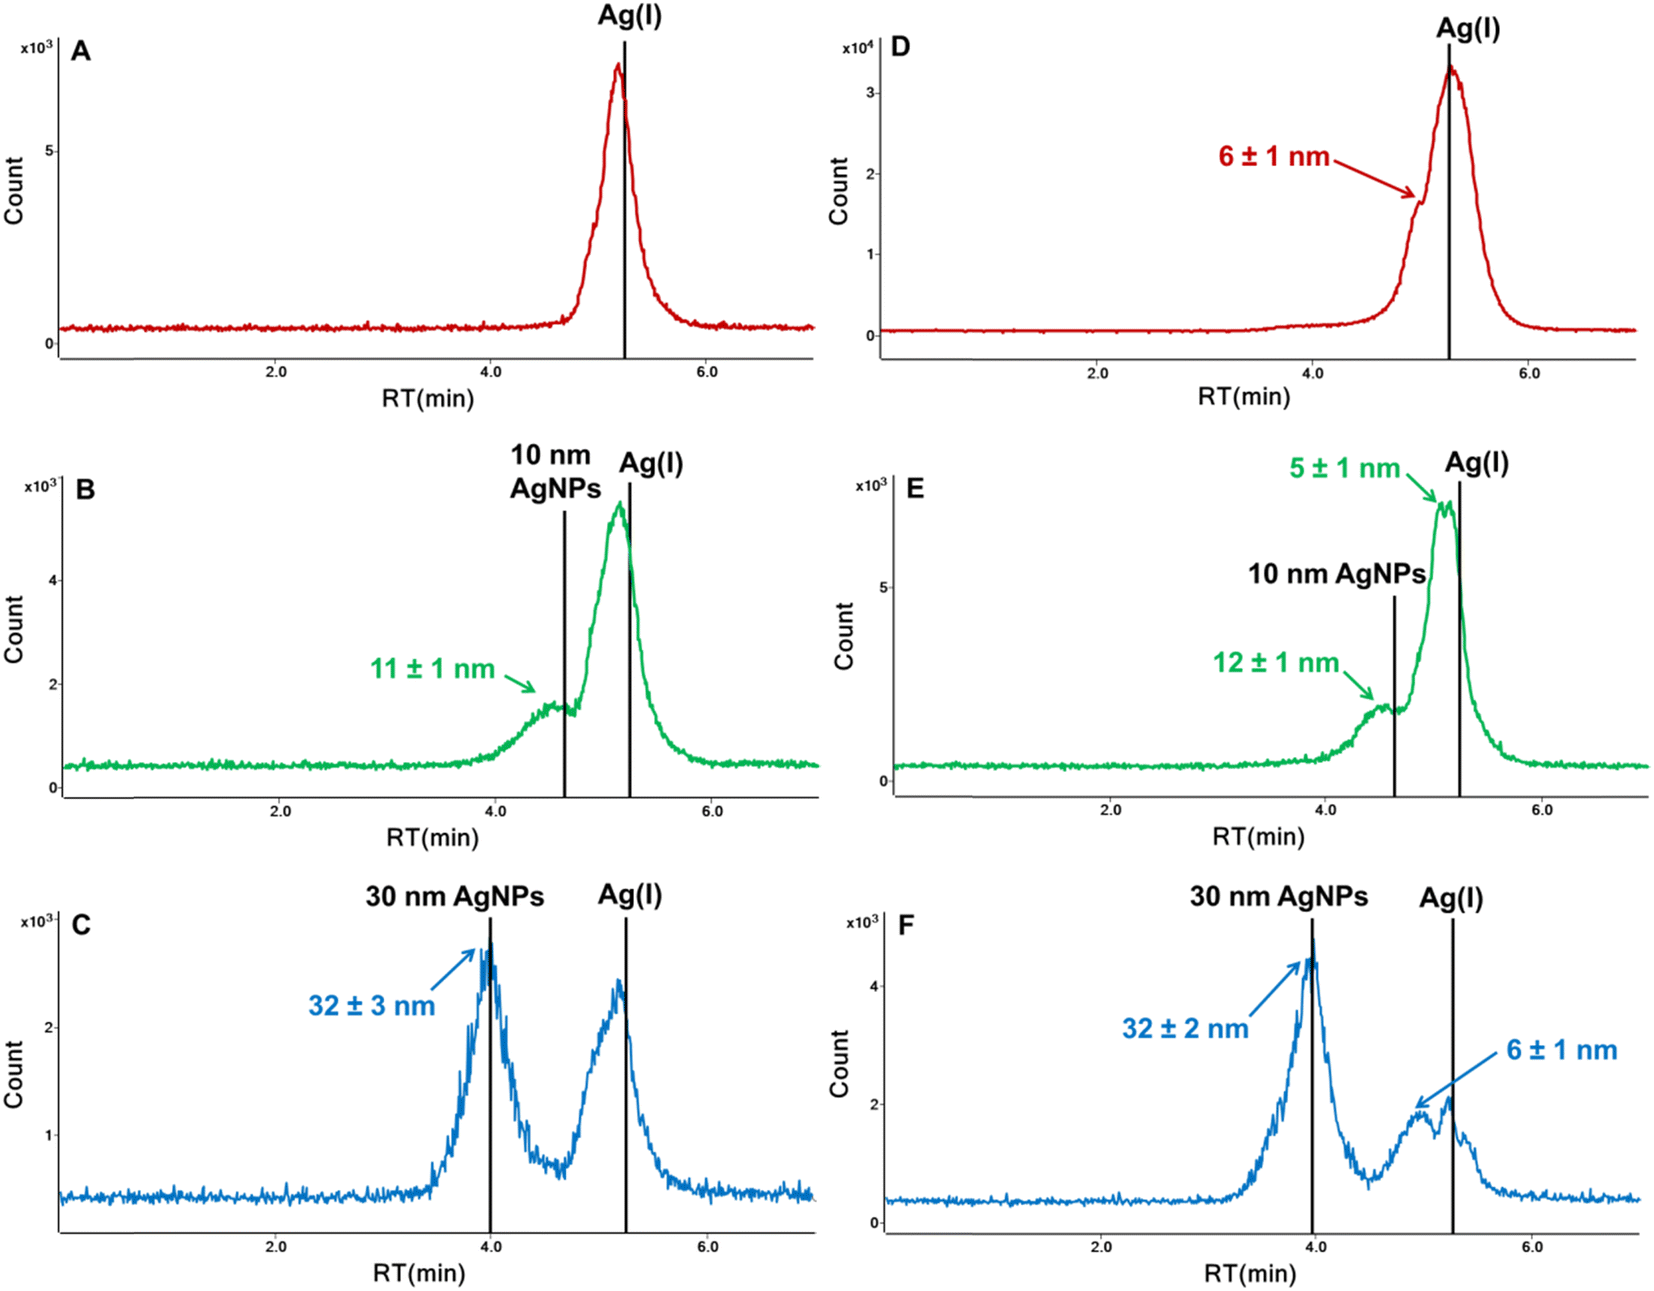 | ||
| Fig. 5 Chromatograms of supernatants – surface water (A–C) and algal cell lysates (D–F) after 24 h incubation with Ag(I) (A and D), 10 nm AgNPs (B and E), and 30 nm AgNPs (C and F) obtained by the HPLC-ICP-MS method (column: Nucleosil C18 (250 × 4.6 mm, 7 μm particle size, 1000 Å pore size), mobile phase: 10 mM SDS, 2 mM citrate buffer, 2 mM tiopronin, flow rate: 0.5 mL min−1, injection volume: 50 μL). RTs of silver standards in the mobile phase are shown as vertical lines. | ||
The chromatograms of samples exposed to Ag(I) are shown in Fig. 5A and D. The presence of nanoparticles of 6 nm in cell lysates indicates reduction of silver ions into their metallic nanoparticles during incubation. The ability of living algae (e.g. Chlorella vulgaris, Chlamydomonas reinhardtii, or Nannochloropsis oculata) to efficiently reduce Ag(I) ions into AgNPs has already been demonstrated in the literature.28
In the case of samples exposed to AgNPs, transformations were observed both in the algal cells and in the supernatants. The nanoparticles most likely partially dissolved to Ag(I), as evidenced by chromatographic peaks with a retention time close to that of the Ag(I) standard (Fig. 5B–F). This is further confirmed by the presence of nanoparticles with sizes much smaller than the nominal ones, namely 5 nm and 6 nm in algal cell lysates (Fig. 5E and F). Such dissolution of nanoparticles was not observed in our previous study18 for AuNPs after incubation with algal cells. However, the release of silver ions from nanoparticles has been detected during interaction of citrate-coated AgNPs (mean size of 47 nm) with green algae Euglena gracilis,29 carbonate-coated AgNPs (average diameter of 29 nm) with Chlamydomonas reinhardtii,30 and citrate-coated 30 nm AgNPs with Pseudokirchneriella subcapitata.31 The developed method offers new opportunities for a better understanding of the biological effect of nanoAg by tracking the mutual transformations of both silver species under the influence of environmental and biological factors.
4. Conclusions
This work concerns the development of an analytical procedure for reliable speciation analysis of the dissolved and nano forms of silver by the HPLC-ICP-MS method. The mobile phase containing 10 mM SDS, 2 mM citrate buffer, and 2 mM tiopronin ensured elution and stability of both silver species during chromatographic analysis. The developed HPLC-ICP-MS method is characterized by very low detection limits of silver species (2.0–3.1 ng L−1) and good precision, which enable the detection of silver ions and nanoparticles in environmental and biological samples. A linear relationship was found between the retention time of AgNPs and logarithm of particle diameter up to 40 nm. The obtained calibration plot was applied for the size determination of AgNPs in real samples, such as surface water and green algae Acutodesmus obliquus incubated with AgNPs (10 and 30 nm) or Ag(I) at environmentally relevant concentrations. As a result of interaction with the biomass, silver ions partially transformed into small nanoparticles (about 6 nm), whereas silver nanoparticles partially dissolved and released Ag(I) ions. Such dissolution of nanoparticles was not observed for gold, which confirms the higher reactivity of AgNPs. Silver ions released from AgNPs were indicated to be mainly responsible for the adverse effects on living organisms. Monitoring of silver transformations during toxicity tests or in various environmental and biological matrices can contribute to a better understanding of the mechanism of nanosilver toxicity.Author contributions
JM: conceptualization, investigation, methodology, validation, visualization, data curation, writing – original draft, writing – review & editing; WL: investigation, visualization; BGŻ: conceptualization, resources, funding acquisition, writing – original draft, writing – review & editing, supervision.Conflicts of interest
There are no conflicts of interest to declare.Acknowledgements
The authors kindly acknowledge the financial support from the Polish National Science Centre (UMO-2014/15/B/ST4/04641). The ICP-MS instrument was financed by EU funds via the project with contract numbers POPW.01.03.00-20-034/09-00. The authors kindly acknowledge Prof. Andrzej Bajguz and Marlena Tomczuk (University of Bialystok, Faculty of Biology) for cultivation of algae.References
- The Nanodatabase - inventory for products that contain nanomaterials, https://nanodb.dk/en/, access 26.06.2023.
- M. K. Nguyen, J.-Y. Moon and Y.-C. Lee, Ecotoxicol. Environ. Saf., 2020, 201, 110781 CrossRef CAS PubMed.
- D. McShan, P. C. Ray and H. Yu, J. Food Drug Anal., 2014, 22, 116–127 CrossRef CAS PubMed.
- M. van der Zande, R. J. Vandebriel, E. Van Doren, E. Kramer, Z. Herrera Rivera, C. S. Serrano-Rojero, E. R. Gremmer, J. Mast, R. J. B. Peters, P. C. H. Hollman, P. J. M. Hendriksen, H. J. P. Marvin, A. A. C. M. Peijnenburg and H. Bouwmeester, ACS Nano, 2012, 6, 7427–7442 CrossRef CAS PubMed.
- C. Jiang, S. Liu, T. Zhang, Q. Liu, P. J. J. Alvarez and W. Chen, Environ. Sci. Technol., 2022, 56(12), 7426–7447 CrossRef CAS PubMed.
- M. Montes-Bayón and J. Bettmer, Compr. Anal. Chem., 2021, 93, 285–301 Search PubMed.
- J. Gruszka, J. Malejko, A. Bajguz and B. Godlewska-Żyłkiewicz, J. Anal. At. Spectrom., 2022, 37, 1208 RSC.
- J. Soto-Alvaredo, M. Montes-Bayón and J. Bettmer, Anal. Chem., 2013, 85, 1316–1321 CrossRef CAS PubMed.
- C. A. Sötebier, S. M. Weidner, N. Jakubowski, U. Panne and J. Bettmer, J. Chromatogr. A, 2016, 1468, 102–108 CrossRef PubMed.
- Y. Yang, L. Luo, H.-P. Li, Q. Wang, Z.-G. Yang, Z.-P. Qu and R. Ding, Talanta, 2018, 182, 156–163 CrossRef CAS PubMed.
- X.-X. Zhou, R. Liu and J.-F. Liu, Environ. Sci. Technol., 2014, 48, 14516–14524 CrossRef CAS PubMed.
- X.-X. Zhou, J.-F. Liu and G.-B. Jiang, Environ. Sci. Technol., 2017, 51, 3892–3901 CrossRef CAS PubMed.
- L.-J. Dong, X.-X. Zhou, L.-G. Hu, Y.-G. Yin and J.-F. Liu, J. Environ. Sci., 2018, 63, 227–235 CrossRef CAS PubMed.
- L.-J. Dong, Y.-J. Lai, S.-J. Yu and J.-F. Liu, Anal. Chem., 2019, 91, 12525–12530 CrossRef CAS PubMed.
- C. A. Sötebier, F. S. Bierkandt, S. Rades, N. Jakubowski, U. Panne and S. M. Weidner, J. Anal. At. Spectrom., 2015, 30, 2214–2222 RSC.
- R. A. Andersen, J. A. Berges, P. J. Harrison and M. M. Watanabe, Appendix A – recipes for freshwater and seawater media, in Algal Culturing Techniques, ed. R. A. Andersen, Academic Press, Amsterdam, 2005, p. 429 Search PubMed.
- A. Piotrowska-Niczyporuk, A. Bajguz, M. Talarek, M. Bralska and E. Zambrzycka, Environ. Sci. Pollut. Res., 2015, 22, 19112–19123 CrossRef CAS PubMed.
- J. Malejko, N. Szymańska, A. Bajguz and B. Godlewska-Żyłkiewicz, J. Anal. At. Spectrom., 2019, 34, 1485–1496 RSC.
- J. Malejko, N. Świerżewska, A. Bajguz and B. Godlewska-Żyłkiewicz, Spectrochim. Acta, Part B, 2018, 142, 1–7 CrossRef CAS.
- J. Kruszewska, D. Kulpińska, I. Grabowska-Jadach and M. Matczuk, Metallomics, 2020, 12, 408–415 CrossRef CAS PubMed.
- J. Peng, G. Liu, D. Yuan, S. Feng and T. Zhou, Talanta, 2017, 167, 310–316 CrossRef CAS PubMed.
- T. Lou, L. Chen, Z. Chen, Y. Wang, L. Chen and J. Li, ACS Appl. Mater. Interfaces, 2011, 3, 4215–4220 CrossRef CAS PubMed.
- A. M. Teja Ruiz, J. C. Juárez Tapia, I. A. Reyes Domínguez, L. E. Hernández Cruz, M. Reyes Pérez, F. Patiño Cardona and M. U. Flores Guerrero, Metals, 2017, 7, 411 CrossRef.
- X. Men, C. Wu, X. Zhang, X. Wei, M.-L. Chen, T. Yang and J.-H. Wang, Anal. Chim. Acta, 2021, 1166, 338540 CrossRef CAS PubMed.
- H. Qu, T. K. Mudalige and S. W. Linder, J. Chromatogr. A, 2016, 1429, 348–353 CrossRef CAS PubMed.
- J. D. Padmos, D. J. Morris and P. Zhang, Can. J. Chem., 2018, 96, 749–754 CrossRef CAS.
- J. D. Padmos, R. T. M. Boudreau, D. F. Weaver and P. Zhang, J. Phys. Chem. C, 2015, 119, 24627–24635 CrossRef CAS.
- D. Chugh, V. S. Viswamalya and B. Das, J. Genet. Eng. Biotechnol., 2021, 19, 126 CrossRef PubMed.
- X. Li, K. Schirmer, L. Bernard, L. Sigg, S. Pillai and R. Behra, Environ. Sci.: Nano, 2015, 2, 594–602 RSC.
- F. Piccapietra, C. Gil Allué, L. Sigg and R. Behra, Environ. Sci. Technol., 2012, 46, 7390–7397 CrossRef CAS PubMed.
- A. Malysheva, N. Voelcker, P. E. Holm and E. Lombi, Environ. Sci. Technol., 2016, 50, 12455–12463 CrossRef CAS PubMed.
Footnote |
| † Electronic supplementary information (ESI) available. See DOI: https://doi.org/10.1039/d3ja00213f |
| This journal is © The Royal Society of Chemistry 2023 |