 Open Access Article
Creative Commons Attribution 3.0 Unported Licence
Unexpectedly flexible graphene nanoribbons with a polyacene ladder skeleton†‡
Marvin T.
Unruh
a,
Ullrich
Scherf
 a,
Hilke
Bahmann
b,
Ana Clara B.
Rodrigues
c,
Carla
Cunha
c,
J. Sérgio
Seixas de Melo
 c,
Jakob
Schedlbauer
d and
John M.
Lupton
 d
d
aBergische Universität Wuppertal, Macromolecular Chemistry Group (buwMakro) and Wuppertal Center for Smart Materials and Systems (CM@S), Gauss-Str. 20, D-42119 Wuppertal, Germany. E-mail: scherf@uni-wuppertal.de
bUniversität des Saarlandes, Physical and Theoretical Chemistry, Campus Saarbrücken B 2.2, D-66123 Saarbrücken, Germany. E-mail: hilke.bahmann@uni-saarland.de
cUniversity of Coimbra, CQC, Department of Chemistry, Rua Larga, 3004-535, Coimbra, Portugal. E-mail: sseixas@ci.uc.pt
dInstitut für Experimentelle und Angewandte Physik, Universität Regensburg, D-93053 Regensburg, Germany. E-mail: john.lupton@ur.de
First published on 15th July 2021
Abstract
A new conjugated ladder polymer with a polyacene skeleton was synthesized in a Aldol-type condensation protocol between benzylic and aryl-ketone side groups of suitably functionalized single-stranded precursor polymers. The photophysical behavior of the new conjugated polyacene ladder polymer PAL comprising a polyacene skeleton has been investigated by steady-state and time-resolved photoluminescence spectroscopy in solvents of different viscosity and polarity, and by single-molecule spectroscopy (SMS). From the time-resolved photoluminescence experiments it is concluded that the excited state deactivation mainly results from energy transfer processes without significant conformational relaxation. When solutions in solvent mixtures of a good (THF) and a non-solvent (water) are studied, pronounced differences are seen between PAL and the well-known poly(para-phenylene) ladder polymer MeLPPP. Single molecule spectroscopy (SMS) reveals a remarkable heterogeneity in molecular shape, very much unlike MeLPPP, as determined by the polarization anisotropy and various photophysical properties. Several molecular models of PAL are characterized with density functional theory supporting this observation. We demonstrate that the PL lifetime, peak position, spectral width and vibronic intensity correlate with each other, implying that the polymer behaves as an intramolecular J-aggregate. Compared to MeLPPP, intramolecular energy transfer is not particularly efficient because of the high degree of disorder, which is also seen in the modest degree of photon antibunching and the pronounced temporal dynamics thereof due to the slow singlet–singlet annihilation.
Introduction
The generation of vinylene-bridges in phenylene ladder polymers in a post-polymerization ring closure (carbonyl olefination) of neighbouring keto functions with in situ generated boron sulphide B2S3 is today seen as an early example of the synthesis of graphene nanoribbons (GNRs) of small width.1,2 During the last two decades, GNRs have attracted continuously increasing attention both from synthesis perspectives and from the point of view of applications.3–6 Today, research into GNRs is a very hot topic of materials science. Most of the GNRs are generated in Scholl-type post-polymerization cyclization procedures, as pioneered by the Klaus Müllen group in the late 1990s.7–9 Recently, also base-mediated, Aldol-type condensation protocols between aryl-carbonyl >CO and benzylic >CH2 functions have been successfully utilized for C![[double bond, length as m-dash]](https://www.rsc.org/images/entities/char_e001.gif) C double-bond formation in conjugated oligomer/polymer syntheses, e.g. in work published by Iain McCulloch10 and Michael Mastalerz,11 and respective co-workers. While McCulloch and co-workers used the coupling of isatine-type bifunctional monomers with heteroaromatic components containing active (benzylic) CH2 groups for the generation of C
C double-bond formation in conjugated oligomer/polymer syntheses, e.g. in work published by Iain McCulloch10 and Michael Mastalerz,11 and respective co-workers. While McCulloch and co-workers used the coupling of isatine-type bifunctional monomers with heteroaromatic components containing active (benzylic) CH2 groups for the generation of C![[double bond, length as m-dash]](https://www.rsc.org/images/entities/char_e001.gif) C-connected, alternating donor–acceptor copolymers with high solid-state charge-carrier mobility, Mastalerz and co-workers applied a post-polymerization condensation of aryl aldehyde and 9,10-dihydroanthracene motifs for the fabrication of conjugated, polyaromatic oligomers. Following such a base-mediated condensation/cyclization approach, in our case between benzylic and aryl-ketone side groups, we now succeeded in the synthesis of a first conjugated hydrocarbon ladder polymer PAL with a polyacene skeleton, as an example of a narrow GNR. Note that the multiple benzannulation of the polyacene-like skeleton as depicted in Scheme 1 leads to a distinctly increased aromaticity of the GNR ladder polymer backbone when compared to a hypothetical, unsubstituted polyacene ladder. This increase in aromaticity is accompanied by a widening of the HOMO/LUMO energy gap if compared to a hypothetical poly[n]acene. Following the conjugation pathways of PAL (as highlighted in red in Scheme 1), the π-electron system of our new ladder polymer is better described as a planar arylene–vinylene system with alternating ortho- and para-phenylenes.
C-connected, alternating donor–acceptor copolymers with high solid-state charge-carrier mobility, Mastalerz and co-workers applied a post-polymerization condensation of aryl aldehyde and 9,10-dihydroanthracene motifs for the fabrication of conjugated, polyaromatic oligomers. Following such a base-mediated condensation/cyclization approach, in our case between benzylic and aryl-ketone side groups, we now succeeded in the synthesis of a first conjugated hydrocarbon ladder polymer PAL with a polyacene skeleton, as an example of a narrow GNR. Note that the multiple benzannulation of the polyacene-like skeleton as depicted in Scheme 1 leads to a distinctly increased aromaticity of the GNR ladder polymer backbone when compared to a hypothetical, unsubstituted polyacene ladder. This increase in aromaticity is accompanied by a widening of the HOMO/LUMO energy gap if compared to a hypothetical poly[n]acene. Following the conjugation pathways of PAL (as highlighted in red in Scheme 1), the π-electron system of our new ladder polymer is better described as a planar arylene–vinylene system with alternating ortho- and para-phenylenes.
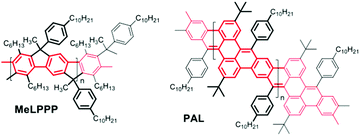 | ||
| Scheme 1 Chemical structures of a poly-para-phenylene ladder polymer MeLPPP (left) and the new polyacene-type GNR ladder polymer (right) PAL. | ||
In this report we describe the synthesis of the new GNR-type ladder polymer PAL comprising a polyacene skeleton together with an in-depth analysis of its optical properties, especially by time-resolved photoluminescence (PL) spectroscopy and PL investigations on the single-chain level. The optical properties are systematically compared to those of the long-known poly-para-phenylene ladder polymer MeLPPP.12,13 We find that the PAL chain is far more flexible than MeLPPP and therefore the optical properties are much more heterogeneous.
Experimental section
Materials
All chemicals and solvents were purchased from commercial suppliers (Sigma Aldrich, VWR, TCI Chemical, Fisher Scientific etc.) and used without further purification, if not mentioned separately. Both monomers for PAL synthesis have been described in the literature.11,12,14Polymer synthesis
For synthetic details, see the ESI.‡Calculations with density functional theory
For computation details, see the ESI.‡Thin films and sample preparation
Thin films of the compounds were obtained with a desktop precision spin-coating system, model P6700 series from Speedline Technologies, as described elsewhere.15 Briefly, thin films from the samples were obtained by deposition of ca. 50 mL from a solution of the compounds onto a circular sapphire substrate (10 mm diameter) followed by spin-coating (2500 rpm) in a nitrogen-saturated atmosphere (2 psi). The solutions for spin-coating were prepared by adding 2 mg of the samples to 200 mL of chloroform solution, with stirring, at ambient temperature, overnight.A 3 mL stock solution of each polymer in THF with an absorbance of 0.1–0.2 (at 530 nm) in a 10 mm quartz cuvette was prepared. An aliquot (200 μL) of the stock solution was transferred to a 2 mL volumetric flask. After an appropriate amount of THF was added, water was added to furnish mixtures with different water fractions (fw = 0–90 vol%) with the same polymer concentration. The photophysical studies of the resultant mixtures were performed immediately after the sample preparation.
Photophysical measurements
Photoluminescence quantum yields (ϕF) for the polymer in solution were measured using the absolute method with a Hamamatsu Quantaurus QY absolute photoluminescence quantum yield spectrometer, model C11347 (integration sphere).
Photoluminescence decays were measured using a home-built picosecond time-correlated single photon counting (ps-TCSPC) apparatus described elsewhere.16 The excitation source consists of a tuneable picosecond Spectra-Physics mode-locked Tsunami laser (Ti:Sapphire) model 3950 (80 MHz repetition rate, tuning range 700–1000 nm), pumped by a 532 nm continuous wave Spectra-Physics Millennia Pro-10s laser. The excitation wavelength (λexc = 395 nm) was obtained with a Spectra-Physics harmonic generator, model GWU-23PS. To eliminate the pump laser in the dispersed light, a RG530 filter was used after the sample holder and before the emission monochromator. Temperature control was achieved using a home-built system based on cooled nitrogen and electric heating. The photoluminescence decay curves were deconvoluted using the experimental instrument response function signal collected with a scattering solution (aqueous Ludox solution). The deconvolution procedure was performed using the modulation functions method, as implemented by G. Striker in the SAND program, previously reported.17
![[thin space (1/6-em)]](https://www.rsc.org/images/entities/char_2009.gif) :
:![[thin space (1/6-em)]](https://www.rsc.org/images/entities/char_2009.gif) 30 with a beam splitter. The larger part of the signal is deflected onto a spectrograph (Andor Technology PLC, SR-303i-B) coupled to a CCD camera (Andor Technology PLC, DU401A-BV). The PL spectra were measured by integrating over a time period of 5 s and further analysed by an automated fitting routine using Gaussian peak functions. By using an avalanche photodiode (Picoquant MPD-050-CTB) in the second beam path we additionally record the PL decay simultaneously to the spectrum by means of TCSPC. For polarization sensitive measurements we rotate the laser polarization with a frequency of 40 Hz using an electro-optical modulator (FastPulse Technology Inc., 3079-4PW). For photon correlation measurements we split the fluorescence equally onto two APDs (Picoquant π-SPAD-20) using a 50
30 with a beam splitter. The larger part of the signal is deflected onto a spectrograph (Andor Technology PLC, SR-303i-B) coupled to a CCD camera (Andor Technology PLC, DU401A-BV). The PL spectra were measured by integrating over a time period of 5 s and further analysed by an automated fitting routine using Gaussian peak functions. By using an avalanche photodiode (Picoquant MPD-050-CTB) in the second beam path we additionally record the PL decay simultaneously to the spectrum by means of TCSPC. For polarization sensitive measurements we rotate the laser polarization with a frequency of 40 Hz using an electro-optical modulator (FastPulse Technology Inc., 3079-4PW). For photon correlation measurements we split the fluorescence equally onto two APDs (Picoquant π-SPAD-20) using a 50![[thin space (1/6-em)]](https://www.rsc.org/images/entities/char_2009.gif) :
:![[thin space (1/6-em)]](https://www.rsc.org/images/entities/char_2009.gif) 50 beam splitter. To investigate triplet-state formation rates on the single-molecule level, we purge the sample with a constant flow of nitrogen to prevent triplet quenching by molecular oxygen in the ambient air. Measurements and data evaluation were carried out using a custom written LabView program.
50 beam splitter. To investigate triplet-state formation rates on the single-molecule level, we purge the sample with a constant flow of nitrogen to prevent triplet quenching by molecular oxygen in the ambient air. Measurements and data evaluation were carried out using a custom written LabView program.
Results and discussion
Synthesis and characterization
PAL (P2) is synthesized in a two-step procedure involving a Suzuki-type aryl–aryl cross coupling between the literature-known 3,7-di-tert-butyl-9,10-dihydroanthracene-1,5-bispina-colatoborate (M1)11 and the likewise known 2,5-dibromo-4′,4′′-bis-n-decyl-terephthalophenone (M2) into P1 followed by the already mentioned, base-mediated post-polymerization cyclization between benzylic and aryl-ketone side groups (see Scheme 2 and ESI‡) to obtain PAL (P2). The obtained Mn value of PAL (P2) of 11.9k corresponds to a degree of polymerization of Pn of ca. 15 (for the 1H and 13C NMR spectra of P1/2 see the ESI,‡ Fig. S1a and b, and S2; for the IR spectra of P1/2 Fig. S3). DFT calculations (see ESI‡ for Computational details) on short simplified segments (with up to four repeat units) of the ladderized PAL backbone indicate a certain flexibility and conformational diversity of the ladderized backbone, which is also manifested in the moderately increased Stokes shift of ∼400 cm−1 between absorption and emission energies for PAL (P2) in comparison with the much more rigid MeLPPP (∼140 cm−1); see Table 2.13,19Photophysical studies
The photophysical properties of the new polyacene-type GNR ladder polymer PAL (P2) were investigated in several solvents varying either (i) the viscosity (from 0.46 cP to 3.74 cP) or (ii) the polarity of the solvent (1.95 to 6.97), as well as (iii) for thin films. The results were further compared to the properties of the well-studied methyl-substituted poly(para-phenylene), MeLPPP, as prototypical rigid-rod conjugated ladder polymer.12,20 The average molecular weights![[M with combining macron]](https://www.rsc.org/images/entities/i_char_004d_0304.gif) n and
n and ![[M with combining macron]](https://www.rsc.org/images/entities/i_char_004d_0304.gif) W, as well as the polydispersities (PD) of the polymers are listed in Table 1 (according to GPC analysis in chloroform). The respective degrees of polymerization (DP) were calculated based on
W, as well as the polydispersities (PD) of the polymers are listed in Table 1 (according to GPC analysis in chloroform). The respective degrees of polymerization (DP) were calculated based on ![[M with combining macron]](https://www.rsc.org/images/entities/i_char_004d_0304.gif) n.
n.
| Polymer |
![[M with combining macron]](https://www.rsc.org/images/entities/i_char_004d_0304.gif) n (g mol−1)
n (g mol−1) |
![[M with combining macron]](https://www.rsc.org/images/entities/i_char_004d_0304.gif) W (g mol−1)
W (g mol−1) |
PD | DP |
|---|---|---|---|---|
a Mean and weight average molecular weights (![[M with combining macron]](https://www.rsc.org/images/entities/i_char_004d_0304.gif) n, n, ![[M with combining macron]](https://www.rsc.org/images/entities/i_char_004d_0304.gif) W), polydispersities (PD), and degrees of polymerization (DP), based on W), polydispersities (PD), and degrees of polymerization (DP), based on ![[M with combining macron]](https://www.rsc.org/images/entities/i_char_004d_0304.gif) n, determined by GPC in chloroform with polystyrene calibration. n, determined by GPC in chloroform with polystyrene calibration.
|
||||
| MeLPPP | 12![[thin space (1/6-em)]](https://www.rsc.org/images/entities/char_2009.gif) 000 000 |
17![[thin space (1/6-em)]](https://www.rsc.org/images/entities/char_2009.gif) 400 400 |
1.45 | 17 |
| PAL (P2) | 11![[thin space (1/6-em)]](https://www.rsc.org/images/entities/char_2009.gif) 900 900 |
20![[thin space (1/6-em)]](https://www.rsc.org/images/entities/char_2009.gif) 000 000 |
1.68 | 15 |
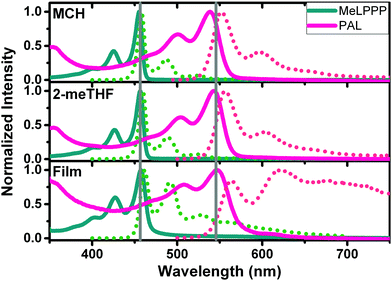
Fig. 1 presents absorption and PL emission spectra of the two ladder polymers in solution (methylcyclohexane, MCH and 2-methyltetrahydrofuran, 2-meTHF), as well as in thin films. Additional data for an increase of the medium viscosity (η) of the solvent from octane to hexadecane are presented in Fig. S4 (ESI‡).
The spectral data (wavelength maxima for absorption, photoluminescence and Stokes shift) and solvent properties are presented in detail in Table 2. Highly structured absorption and emission spectra are observed, characteristic of aromatic, rigid chromophores as in fully planarized conjugated ladder polymers. MeLPPP displays the absorption maximum at ca. 460 nm in all solvents, whereas red-shifted optical spectra (red-shifted by ca. 100 nm) are observed for PAL (P2, Fig. 1). In the solid state (thin films), some loss of vibronic structure is observed for PAL accompanied by a broadening of the emission feature (compared to the solution). The thin-film data for PAL possibly provide evidence for emission features associated to defects, in analogy to the case of MeLPPP.21,22 The spectral broadening and the less pronounced vibrational structure, along with the overall redshift in emission for PAL (P2) in the solid state, can be associated to the occurrence of emissive defect species which are populated by interchain energy transfer in the solid state.
| Polymer | Medium | ε | η (cP) | λ abs (nm) | λ em (nm) | Δ SS (cm−1) | ϕ F |
|---|---|---|---|---|---|---|---|
| MeLPPP | 2-MeTHF | 6.97 | 0.46 | 456 | 460 | 191 | 0.92 |
| Octane | 1.95 | 0.51 | 455 | 458 | 144 | 0.88 | |
| MCH | 2.02 | 0.63 | 455 | 458 | 144 | 0.85 | |
| Dodecane | 2.01 | 1.37 | 456 | 459 | 143 | 0.93 | |
| Decaline | 2.15 | 2.41 | 456 | 459 | 143 | 0.96 | |
| Hexadecane | 2.08 | 3.47 | 456 | 459 | 143 | 0.94 | |
| Film | — | — | 457 | 462 | 237 | 0.27 | |
| PAL | 2-MeTHF | 6.97 | 0.46 | 543 | 556 | 431 | 0.53 |
| Octane | 1.95 | 0.51 | 540 | 551 | 370 | 0.32 | |
| MCH | 2.02 | 0.63 | 539 | 553 | 470 | 0.53 | |
| Dodecane | 2.01 | 1.37 | 543 | 553 | 333 | 0.27 | |
| Decaline | 2.15 | 2.41 | 544 | 555 | 364 | 0.55 | |
| Hexadecane | 2.08 | 3.47 | 545 | 554 | 298 | 0.27 | |
| Film | — | — | 547 | 563 | 520 | 0.08 |
Detailed photophysical data for PAL (P2) can be found in Table S2 (ESI‡) and for MeLPPP in Table S3 (ESI‡). The PL quantum yields ϕF for PAL (P2) are relatively high (>50% in 2-MeTHF, MCH and decaline solutions, but ϕF decreases to <10% in thin films), but they are, however, generally lower than those found for MeLPPP.
Time-resolved PL
Time-resolved PL experiments were conducted for MeLPPP and PAL polymers in solvents of different viscosity, also as a function of temperature. The decays were collected at two emission wavelengths (see Table S4 (ESI‡) for complete data on the extracted PL decay times and pre-exponential factors for PAL (P2), data for MeLPPP are given in Table S1, ESI‡).The PL intensity response with time, I(t), is given by eqn (1), with decay times, τi, and pre-exponential factors, aij, where i stands for the number of the exponential and ij for the pre-exponential factor at the different emission wavelengths,
 | (1) |
As known from previous studies, the PL decay of MeLPPP can be described as single exponential with a lifetime of 310 ps and is found to be solvent and temperature independent.20 Moreover, for planar ladder polymers, where significant conformational changes are not expected, only energy transfer between emissive segments of slightly different electronic nature occurs. The time-resolved photoluminescence behaviour found for the new ladder-polymer PAL (P2) contrasts with what was found for MeLPPP. Our time-resolved PL data for the two ladder polymers are listed in Table 3. The PL decay of PAL (P2) is properly fitted as a three-exponential decay with decay times of 35–130 ps, 570–890 ps, and 1.3–2 ns (Table 3). The fractional contribution [Ci (%)] of each decay time component given in Table 3 is calculated by eqn (2):23
 | (2) |
| Medium | λ em (nm) | τ 1 (ns) | τ 2 (ns) | τ 3 (ns) | a 1 | a 2 | a 3 | χ 2 | C 1 (%) | C 2 (%) | C 3 (%) |
|---|---|---|---|---|---|---|---|---|---|---|---|
| a For a better judgment of the quality of the fits, the χ2 values are also presented. | |||||||||||
| 2-MeTHF | 575 | 0.118 | 0.849 | 2.04 | 0.387 | 0.588 | 0.024 | 1.03 | 8 | 84 | 8 |
| 610 | 0.386 | 0.551 | 0.062 | 0.95 | 7 | 73 | 20 | ||||
| Octane | 575 | 0.035 | 0.570 | 1.94 | 0.738 | 0.141 | 0.137 | 1.17 | 10 | 31 | 59 |
| 610 | 0.582 | 0.211 | 0.175 | 1.11 | 5 | 30 | 65 | ||||
| MCH | 575 | 0.124 | 0.862 | 1.98 | 0.170 | 0.741 | 0.090 | 0.99 | 3 | 76 | 21 |
| 610 | 0.174 | 0.705 | 0.121 | 1.08 | 2 | 70 | 28 | ||||
| Dodecane | 575 | 0.047 | 0.624 | 1.31 | 0.342 | 0.598 | 0.060 | 0.95 | 7 | 76 | 17 |
| 610 | 0.323 | 0.571 | 0.106 | 0.92 | 6 | 66 | 28 | ||||
| Decaline | 575 | 0.133 | 0.889 | 2.04 | 0.597 | 0.244 | 0.159 | 1.15 | 7 | 39 | 54 |
| 610 | 0.563 | 0.242 | 0.195 | 1.11 | 6 | 35 | 59 | ||||
| Hexadecane | 575 | 0.045 | 0.594 | 1.33 | 0.620 | 0.243 | 0.137 | 1.17 | 8 | 41 | 51 |
| 610 | 0.576 | 0.249 | 0.175 | 1.11 | 6 | 36 | 57 | ||||
| Film | 610 | 0.020 | 0.200 | 0.980 | 0.939 | 0.045 | 0.016 | 1.46 | 10 | 5 | 85 |
The time-resolved PL behaviour in solvents of different viscosity and as a function of temperature is often used to distinguish between different (fast) relaxation processes, namely between conformational relaxation and electronic energy migration.
Decay-time variation with solvent viscosity
While going from octane to the more viscous solvent hexadecane, the τ1 and τ2 decay times and associated pre-exponential factors remain effectively unchanged (Fig. S5 (ESI‡) and Table 3). Because conformational relaxation is an activated process, which therefore strongly depends, among other properties, on solvent viscosity, the results indicate that despite the assumed, certain flexibility of the PAL (P2) backbones (particularly when compared to MeLPPP) such processes do not play a significant role in the deactivation of the singlet excited state of PAL (P2).Dependence on the temperature
Time-resolved photoluminescence data at different temperatures (from 25 to 65 °C) for PAL (P2) in decaline are summarized in Fig. S6 (ESI‡). The three decay components (τ1, τ2 and τ3) are found to be temperature independent, despite some scattering for the long-lived time component (τ3). This absence of temperature dependence again points to a non-activated process, to be discussed in terms of an energy migration from higher to lower energy segments within the polymer chains.23,24The longer (1–2 ns) decay component (τ3) is expected to represent the decay of the relaxed exited state into the ground state.
Dependence on concentration and behaviour in solvent/non-solvent mixtures
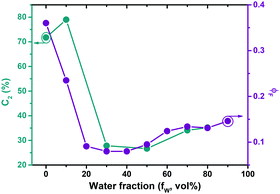
To further investigate a possible contribution of aggregation effects in PAL (P2) to the photophysical behaviour the concentration dependence of the PL was studied (Fig. S7, ESI‡). The data show the absence of Mie scattering effects in the concentration range of the current experiments (for concentrations <0.01 mg mL, Fig. S7, ESI‡). Additional studies were carried out in solvent/non-solvent mixtures (in THF/water: Fig. S8 for MeLPPP, Fig. S9 for PAL (P2), ESI‡). With increasing water content in the mixture, there is a gradual decrease of ϕF for MeLPPP, mirroring the occurrence of aggregation-caused quenching (ACQ).25 However, the same is not observed for PAL (P2, Fig. 2). Here, the initial decrease of ϕF (up to 20 vol% water) is followed by a moderate increase of ϕF, as weak aggregation-enhanced emission effect.24,26 More interesting to observe is the dependence of the contribution of the τ2 decay time component (C2) when increasing the water fraction (Fig. 2 and Table S3, ESI‡) in the mixture. C2 follows the same trend as found for ϕF, thus indicating that especially this decay component responds to the changes of the solvent system.Single-molecule spectroscopy
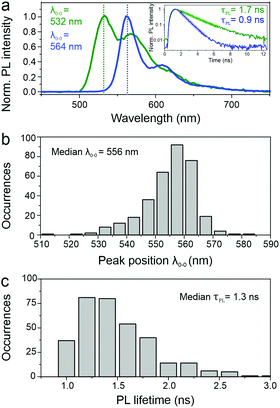
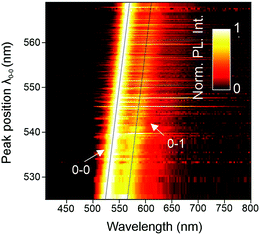
SMS has proven to be a very powerful technique to unravel structure–property relationships in conjugated polymers. In the past, different chromophores could be resolved within a single polymer chain, as well as the specific interactions between them, most notably in the case of MeLPPP.27–29 Single molecules of PAL (P2) were isolated in a PMMA matrix and studied with a confocal fluorescence microscope, at room temperature. Fig. 3 shows examples of single-molecule PL spectra (panel a) along with a histogram of peak positions (panel b). The PL spectra are quite narrow but scatter widely in wavelength. Such a wide scatter is familiar from more flexible conjugated polymers such as poly(phenylene–vinylenes),27 and is not observed in MeLPPP. The variation of the PL lifetime on the single-molecule level is even more extreme, spanning almost a factor of two (panel c). This extraordinary heterogeneity in PL decays – which are single-exponential on the single-molecule level – offers a rationalization of the triple-exponential decay seen in the ensemble in the data above.A useful approach to mapping this heterogeneity is to sort all single-molecule spectra by their 0–0 peak position λ0–0 (representing the transition energy E0–0) and plot them in a false-colour representation as in Fig. 4.30 Two bands are resolved clearly in this representation, the 0–0 and the 0–1 transition. It is evident that the intensity of the vibronic transition decreases as the 0–0 peak position λ0–0 shifts to the red. Such a decrease in vibronic intensity is reminiscent of J-aggregation effects in supramolecular assemblies of dye molecules,31 and of J-type aggregation between the monomer units of a conjugated polymer.32 In-line transition dipole moments will add up together, increasing the radiative decay rate.32,33
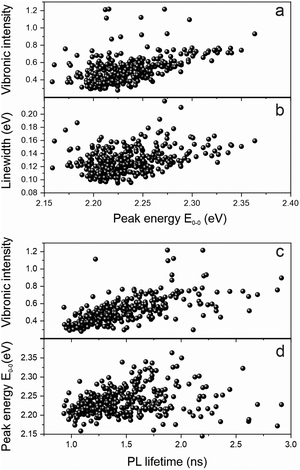
We examine the spectral heterogeneity further by correlating different spectroscopic observables with each other: the transition peak energy, the vibronic intensity, the PL spectral linewidth and the PL lifetime, measured simultaneously with the PL spectrum on the same polymer chain by using microscopic TCSPC techniques.34Fig. 5a shows a clear correlation of the relative vibronic peak intensity, the 0–1 to 0–0 peak ratio, with the peak energy: the more delocalized the excited state is, the weaker the coupling to vibrations. Such delocalization in the context of J-type aggregation is also expected to reveal itself in the transition linewidth.
As the transition dipole moments add up in a J-type aggregation arrangement,31 more and more transitions occur within a narrow spectral range, giving rise to a spectral narrowing effect with increasing effective chromophore length, which has also been demonstrated in MeLPPP.33 This narrowing is indeed clearly seen in the correlation between linewidth and transition energy in Fig. 5b. The increased decay rate should also be reflected in the PL lifetime, although for materials of relatively low quantum yield, where the decay rate is dominated by non-radiative processes, the effect is anticipated to be comparatively weak. Whereas the correlation between PL lifetime and PL peak energy is indeed quite weak in panel d, it is pronounced when comparing the vibronic peak intensity to the PL lifetime in panel c. As for MeLPPP22 and polyfluorene,21,35PAL (P2) also appears to show defect emission on the single-molecule level. This defect is characterised by broad, featureless emission of extended lifetime, which we identified clearly in a few single molecules. The coincidence of such a species with the backbone exciton emission may add to obscuring the correlation between PL peak and lifetime correlation.
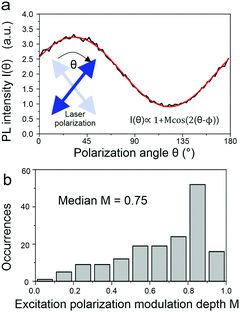
What then is the source of this heterogeneity in photophysical characteristics? A powerful way to assess molecular conformation on the single-chain level is to examine the polarization anisotropy in excitation, i.e. the modulation of the fluorescence intensity as the plane of polarization of the exciting laser is rotated.36,37 This approach is illustrated in Fig. 6a and allows an effective modulation depth of the fluorescence to be determined as a metric of chain extension: a straight chain will show a strong modulation, a bent chain will result in reduced modulation down to an absence of a polarization anisotropy. This histogram in Fig. 6b scatters widely, implying that there are both elongated and folded chains present in the sample.
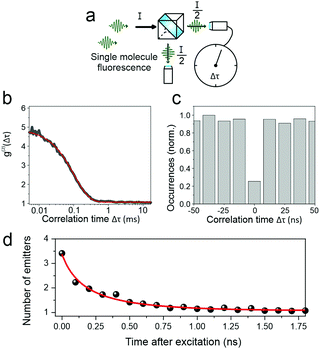
Interestingly, no correlation was found between the modulation depth and the PL lifetime of the single chain. This lack of correlation presumably arises from the fact that the polarization anisotropy measurement probes the entire chain, whereas the luminescence – the spectrum and lifetime – relate to only a small segment of the chain. However, it is possible to extract information relating to the entire polymer chain from the fluorescence by considering the fluorescence photon statistics, i.e. the temporal intervals between the arrival of single photons on the detector. To do this, as sketched in Fig. 7a, the luminescence is passed through a 50![[thin space (1/6-em)]](https://www.rsc.org/images/entities/char_2009.gif) :
:![[thin space (1/6-em)]](https://www.rsc.org/images/entities/char_2009.gif) 50 beam splitter and the photon coincidence rate on two photodetectors placed on either side of the beam splitter is measured. Two effects can occur, depending on the underlying interactions of excitons on the polymer chain. First, a chromophore on the polymer may enter a triplet state. Subsequent excitation of the polymer chain, and absorption of a photon by a second chromophore, will then lead to singlet–triplet annihilation so that the single molecule will appear dark. Photons therefore arrive in discrete bunches with time, as the molecular fluorescence turns on and off. This “photon bunching”, revealed in the photon correlation measurement in Fig. 7b, offers a direct measurement of the triplet lifetime within the polymer,38 which is determined to be approx. 450 μs. The fact that such photon bunching is observed here demonstrates that intramolecular energy transfer of singlets indeed occurs, as concluded from the ensemble experiments. Using a second approach, it is possible to resolve this singlet energy migration in real time. If two singlets are generated by a single excitation pulse within the multichromophoric polymer molecule, then these two excitations can interact with each other by singlet–singlet annihilation.18
50 beam splitter and the photon coincidence rate on two photodetectors placed on either side of the beam splitter is measured. Two effects can occur, depending on the underlying interactions of excitons on the polymer chain. First, a chromophore on the polymer may enter a triplet state. Subsequent excitation of the polymer chain, and absorption of a photon by a second chromophore, will then lead to singlet–triplet annihilation so that the single molecule will appear dark. Photons therefore arrive in discrete bunches with time, as the molecular fluorescence turns on and off. This “photon bunching”, revealed in the photon correlation measurement in Fig. 7b, offers a direct measurement of the triplet lifetime within the polymer,38 which is determined to be approx. 450 μs. The fact that such photon bunching is observed here demonstrates that intramolecular energy transfer of singlets indeed occurs, as concluded from the ensemble experiments. Using a second approach, it is possible to resolve this singlet energy migration in real time. If two singlets are generated by a single excitation pulse within the multichromophoric polymer molecule, then these two excitations can interact with each other by singlet–singlet annihilation.18
The consequence of such annihilation is that the molecule emits precisely one single photon at a time: photons arrive on the detectors “antibunched” in time, one at a time on the one detector or the other, so that the coincidence rate for simultaneous arrival on both detectors drops to zero. Such an example of a photon coincidence histogram showing photon antibunching is displayed in Fig. 7c. The quality of single-photon emission can be quantified by considering the ratio of central to lateral peak heights in the correlation histogram. For PAL (P2), we typically find values of 0.25–0.3, whereas for LPPP compounds of comparable molecular weight, the antibunching dip is much more pronounced, typically ≈0.05.18 The utility of the TCSPC approach in acquiring photon statistics is that the arrival time of the photons can be assessed with regards to the excitation laser pulse. In other words, the temporal evolution of the photon coincidence histogram can be examined. For MeLPPP, the photon antibunching appears immediately, with a pronounced dip apparent in the correlation for the earliest photons emitted following excitation.18 The situation is very different for PAL (P2), shown in Fig. 7d. By a simple analysis, the dip of the photon antibunching histogram can be converted into an effective number of emitters,39 which evidently drops from ≈3.5 at the shortest times after excitation to a value of unity, signifying perfect photon antibunching for the photons which are emitted latest. This improvement in photon antibunching arises because singlet excitons migrate along the polymer chain, interacting with each other by singlet–singlet annihilation. This effective rate of singlet–singlet annihilation, of order (500 ps)−1, is more than an order of magnitude slower than that estimated in MeLPPP. This low rate of intramolecular energy transfer is a direct consequence of both energetic and conformational heterogeneity.39
Density functional theory studies
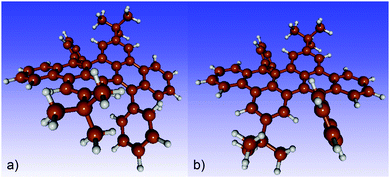
Density functional theory (DFT) calculations were performed for several short segments with up to four repeat units. The n-decyl side chains were replaced by hydrogen atoms for simplicity.Due to the bulky tBu-groups, the phenyl side groups are slightly rotated out of the perpendicular position with respect to the polyacene skeleton. Thus, two different conformations are possible in the monomer (shown in Fig. 8): one with the phenyl groups rotated into opposite directions (termed ab, Fig. 8a) and one with two almost parallel phenyl rings (aa, Fig. 8b).
While the first structure corresponds to a ground state, the second is a transition state lying 30.9 kJ mol−1 above the ground state with a small imaginary frequency of 5.94 cm−1. For the monomeric unit, the opposing rotation is facilitated by a significant bend of the polyacene skeleton with both phenyl rings pointing to the same side of the polyacene plane.
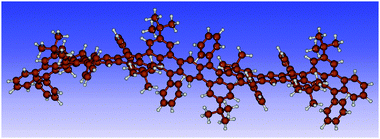
Consequently, only structures with an ab configuration of the phenyl rings on a given repeat unit could be obtained in our calculations for the longer chains. The two possible configurations for the dimer are ab/ba and ab/ab. Our results show that both correspond energetically to a ground state with an energy difference of only 2.0 kJ mol−1. For the trimer, optimizations with various starting structures yield the two stable configurations ab/ba/ab/or ab/ba/ba. The energy difference is in this case 2.4 kJ mol−1. Clearly, each additional unit introduces more flexibility increasing the possible number of stable configurations with different conformations of the repeat units. Our calculations identify stable non-planar, bent, and twisted backbone structures (see Fig. S10 and S11, ESI‡). For the tetramer, an exemplary structure with ab/ab/ba/ab configuration is shown in Fig. 9 highlighting a wavelike structure of the polyacene backbone.
Fig. 10 shows the calculated absorption spectra for the two conformers of the dimer and the trimer in direct comparison. While the energies of the first vertical transition differ by only 0.01 eV in the trimer and 0.02 eV in the dimer the other parts of the spectra are more distinct. With more repeat units, the variation in the lowest energy excitations is expected to increase.
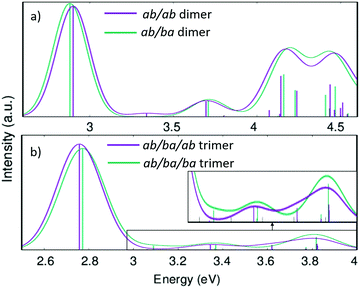 | ||
| Fig. 10 Calculated absorption spectra (with linear-response time-dependent DFT) of the dimer (a) and trimer (b) models for the PAL molecule. | ||
Conclusions
This study reports synthesis and photophysical characterization of a new ladder polymer PAL (P2) comprising a polyacene skeleton, with the optical properties set in comparison to the extensively studied MeLPPP ladder polymer. PL studies for different temperatures and solvent viscosities show that the dominant decay mechanism for PAL (P2) involves energy transfer between polymer segments (on-chain energy transfer). Single molecule spectroscopy illustrates the unusual level of intermolecular heterogeneity but reveals how, on an intramolecular level, the chromophores of the conjugated polymer behave like J-type aggregates with transition-dipole moments adding up. According to DFT calculations, different stable conformers exist already for PAL (P2) models with few repeat units. They exhibit distinct absorption spectra.Conflicts of interest
There are no conflicts to declare.Acknowledgements
This work was carried out with the support of Centro de Química de Coimbra [FCT (Fundação para a Ciência e a Tecnologia) Ref. UIDB/00313/2020 and UIDP/00313/2020], and the COMPETE 2020 Operational Thematic Program for Competitiveness and Internationalization (Project “Hylight”, 02/SAICT/2017, PTDC/QUI-QFI/31625/2017), co-financed by national funds through the FCT/MCTES, the European Union through the European Regional Development Fund (ERDF) under the Portugal 2020 Partnership Agreement and the Deutsche Forschungsgemeinschaft (DFG, Grants No. SCHE 410/33 and No. 439215932). The research leading to these results has received funding from Laserlab-Europe (grant agreement no. 284464, EC's Seventh Framework Programme). CC thanks FCT for a PhD Grant (2020.09661.BD).References
- K. Chmil and U. Scherf, Makromol. Chem., Rapid Commun., 1993, 14, 217–222 CrossRef CAS.
- K. Chmil and U. Scherf, Acta Polym., 1997, 48, 208–211 CrossRef CAS.
- J. Cai, P. Ruffieux, R. Jaafar, M. Bieri, T. Braun, S. Blankenburg, M. Muoth, A. P. Seitsonen, M. Saleh, X. Feng, K. Müllen and R. Fasel, Nature, 2010, 466, 470–473 CrossRef CAS PubMed.
- A. Narita, X. Feng and K. Müllen, Chem. Rec., 2015, 15, 295–309 CrossRef CAS PubMed.
- A. Narita, Z. Chen, Q. Chen and K. Müllen, Chem. Sci., 2019, 10, 964–975 RSC.
- Z. Chen, A. Narita and K. Müllen, Adv. Mater., 2020, 32, e2001893 CrossRef PubMed.
- V. S. Iyer, M. Wehmeier, J. D. Brand, M. A. Keegstra and K. Müllen, Angew. Chem., Int. Ed. Engl., 1997, 36, 1604–1607 CrossRef CAS.
- V. S. Iyer, K. Yoshimura, V. Enkelmann, R. Epsch, J. P. Rabe and K. Müllen, Angew. Chem., Int. Ed., 1998, 37, 2696–2699 CrossRef CAS.
- B. T. King, J. Kroulik, C. R. Robertson, P. Rempala, C. L. Hilton, J. D. Korinek and L. M. Gortari, J. Org. Chem., 2007, 72, 2279–2288 CrossRef CAS PubMed.
- A. Onwubiko, W. Yue, C. Jellett, M. Xiao, H. Y. Chen, M. K. Ravva, D. A. Hanifi, A. C. Knall, B. Purushothaman, M. Nikolka, J. C. Flores, A. Salleo, J. L. Bredas, H. Sirringhaus, P. Hayoz and I. McCulloch, Nat. Commun., 2018, 9, 416 CrossRef PubMed.
- G. Zhang, F. Rominger, U. Zschieschang, H. Klauk and M. Mastalerz, Chem. – Eur. J., 2016, 22, 14840–14845 CrossRef CAS PubMed.
- U. Scherf and K. Müllen, Makromol. Chem., Rapid Commun., 1991, 12, 489–497 CrossRef CAS.
- U. Scherf, J. Mater. Chem., 1999, 9, 1853–1864 RSC.
- J.-F. Lee, Y.-C. Chen, J.-T. s. Lin, C.-C. Wu, C.-Y. Chen, C.-A. Dai, C.-Y. Chao, H.-L. Chen and W.-B. Liau, Tetrahedron, 2011, 67, 1696–1702 CrossRef CAS.
- J. Pina, J. Seixas de Melo, H. D. Burrows, A. Bilge, T. Farrell, M. Forster and U. Scherf, J. Phys. Chem. B, 2006, 110, 15100–15106 CrossRef CAS PubMed.
- J. Pina, J. Seixas de Melo, H. D. Burrows, A. L. Maçanita, F. Galbrecht, T. Bünnagel and U. Scherf, Macromolecules, 2009, 42, 1710–1719 CrossRef CAS.
- G. Striker, V. Subramaniam, C. A. M. Seidel and A. Volkmer, J. Phys. Chem. B, 1999, 103, 8612–8617 CrossRef CAS.
- J. Schedlbauer, P. Wilhelm, L. Grabenhorst, M. E. Federl, B. Lalkens, F. Hinderer, U. Scherf, S. Höger, P. Tinnefeld, S. Bange, J. Vogelsang and J. M. Lupton, Nano Lett., 2020, 20, 1074–1079 CrossRef CAS PubMed.
- J. G. Müller, M. Anni, U. Scherf, J. M. Lupton and J. Feldmann, Phys. Rev. B: Condens. Matter Mater. Phys., 2004, 70, 035205 CrossRef.
- F. B. Dias, A. L. Maçanita, J. Seixas de Melo, H. D. Burrows, R. Güntner, U. Scherf and A. P. Monkman, J. Chem. Phys., 2003, 118, 7119–7126 CrossRef CAS.
- J. M. Lupton, Chem. Phys. Lett., 2002, 365, 366–368 CrossRef CAS.
- J. M. Lupton, A. Pogantsch, T. Piok, E. J. W. List, S. Patil and U. Scherf, Phys. Rev. Lett., 2002, 89, 167401 CrossRef CAS PubMed.
- B. Ferreira, P. F. da Silva, J. S. Seixas de Melo, J. Pina and A. Macanita, J. Phys. Chem. B, 2012, 116, 2347–2355 CrossRef CAS PubMed.
- J. Pina, M. Alnady, A. Eckert, U. Scherf and J. S. Seixas de Melo, Mater. Chem. Front., 2018, 2, 281–290 RSC.
- A. C. B. Rodrigues and J. S. Seixas de Melo, Top. Curr. Chem., 2021, 379, 15 CrossRef CAS PubMed.
- A. C. B. Rodrigues, I. S. Geisler, P. Klein, J. Pina, F. J. H. Neuhaus, E. Dreher, C. W. Lehmann, U. Scherf and J. S. Seixas de Melo, J. Mater. Chem. C, 2020, 8, 2248–2257 RSC.
- F. Schindler, J. M. Lupton, J. Feldmann and U. Scherf, Proc. Natl. Acad. Sci. U. S. A., 2004, 101, 14695–14700 CrossRef CAS PubMed.
- J. G. Müller, U. Lemmer, G. Raschke, M. Anni, U. Scherf, J. M. Lupton and J. Feldmann, Phys. Rev. Lett., 2003, 91, 267403 CrossRef PubMed.
- J. G. Müller, J. M. Lupton, J. Feldmann, U. Lemmer and U. Scherf, Appl. Phys. Lett., 2004, 84, 1183–1185 CrossRef.
- T. Eder, J. Vogelsang, S. Bange, K. Remmerssen, D. Schmitz, S. S. Jester, T. J. Keller, S. Höger and J. M. Lupton, Angew. Chem., Int. Ed., 2019, 58, 18898–18902 CrossRef CAS PubMed.
- F. Würthner, T. E. Kaiser and C. R. Saha-Moller, Angew. Chem., Int. Ed., 2011, 50, 3376–3410 CrossRef PubMed.
- F. C. Spano and C. Silva, in Annu. Rev. Phys. Chem., ed. M. A. Johnson and T. J. Martinez, 2014, vol. 65, pp. 477–500 Search PubMed.
- F. Schindler, J. Jacob, A. C. Grimsdale, K. Müllen, U. Scherf, J. M. Lupton and J. Feldmann, Angew. Chem., Int. Ed., 2004, 44, 1520–1523 CrossRef PubMed.
- P. Wilhelm, J. Vogelsang, G. Poluektov, N. Schönfelder, T. J. Keller, S. S. Jester, S. Höger and J. M. Lupton, Angew. Chem., Int. Ed., 2017, 56, 1234–1238 CrossRef CAS PubMed.
- T. Adachi, J. Vogelsang and J. M. Lupton, J. Phys. Chem. Lett., 2014, 5, 573–577 CrossRef CAS PubMed.
- D. H. Hu, J. Yu, K. Wong, B. Bagchi, P. J. Rossky and P. F. Barbara, Nature, 2000, 405, 1030–1033 CrossRef CAS PubMed.
- R. Camacho, D. Taeuber and I. C. Scheblykin, Adv. Mater., 2019, 31, 1805671 CrossRef PubMed.
- F. Steiner, J. Vogelsang and J. M. Lupton, Phys. Rev. Lett., 2014, 112, 137402 CrossRef PubMed.
- G. J. Hedley, T. Schröder, F. Steiner, T. Eder, F. J. Hofmann, S. Bange, D. Laux, S. Höger, P. Tinnefeld, J. M. Lupton and J. Vogelsang, Nat. Commun., 2021, 12, 1327 CrossRef CAS PubMed.
Footnotes |
| † Dedicated to Professor Kees Hummelen. |
| ‡ Electronic supplementary information (ESI) available. See DOI: 10.1039/d1tc02302k |
| This journal is © The Royal Society of Chemistry 2021 |


