
 Open Access Article
 This Open Access Article is licensed under a
 Creative Commons Attribution 3.0 Unported Licence
Bimetallic CuPd nanoparticles supported on ZnO or graphene for CO2 and CO conversion to methane and methanol†
Qaisar
Maqbool‡
a,
Klaus
Dobrezberger‡
 a,
Julian
Stropp
a,
Martin
Huber
a,
Karl-Leopold
Kontrus
a,
Anna
Aspalter
a,
Julie
Neuhauser
a,
Thomas
Schachinger
b,
Stefan
Löffler
b and
Günther
Rupprechter
*a
a,
Julian
Stropp
a,
Martin
Huber
a,
Karl-Leopold
Kontrus
a,
Anna
Aspalter
a,
Julie
Neuhauser
a,
Thomas
Schachinger
b,
Stefan
Löffler
b and
Günther
Rupprechter
*a
aInstitute of Materials Chemistry, TU Wien, Getreidemarkt 9/BC, 1060 Vienna, Austria. E-mail: guenther.rupprechter@tuwien.ac.at
bUniversity Service Center for Transmission Electron Microscopy, TU Wien, Stadionallee 2/057-02, 1020 Vienna, Austria
First published on 4th September 2024
Abstract
Carbon dioxide (CO2) and carbon monoxide (CO) hydrogenation to methane (CH4) or methanol (MeOH) is a promising pathway to reduce CO2 emissions and to mitigate dependence on rapidly depleting fossil fuels. Along these lines, a series of catalysts comprising copper (Cu) or palladium (Pd) nanoparticles (NPs) supported on zinc oxide (ZnO) as well as bimetallic CuPd NPs supported on ZnO or graphene were synthesized via various methodologies. The prepared catalysts underwent comprehensive characterization via high-resolution transmission electron microscopy (HRTEM), energy-dispersive X-ray spectroscopy (EDX) mapping, electron energy loss spectroscopy (EELS), X-ray diffraction (XRD), hydrogen temperature-programmed reduction and desorption (H2-TPR and H2-TPD), and deuterium temperature-programmed desorption (D2O-TPD). In the CO2 hydrogenation process carried out at 20 bar and elevated temperatures (300 to 500 °C), Cu, Pd, and CuPd NPs (<5 wt% loading) supported on ZnO or graphene predominantly yielded CH4 as the primary product, with CO generated as a byproduct via the reverse water gas shift (RWGS) reaction. For CO hydrogenation between 400 and 500 °C, the CO conversion was at least 40% higher than the CO2 conversion, with CH4 and CO2 identified as the main products, the latter from water gas shift. Employing 90 wt% Cu on ZnO led to an enhanced CO conversion of 14%, with the MeOH yield reaching 10% and the CO2 yield reaching 4.3% at 230 °C. Overall, the results demonstrate that lower Cu/Pd loading (<5 wt%) supported on ZnO/graphene favored CH4 production, while higher Cu content (90 wt%) promoted MeOH production, for both CO2 and CO hydrogenation at high pressure.
Sustainability spotlightThe hydrogenation of carbon dioxide (CO2) to methane (CH4) or methanol (CH3OH) is a promising route to use CO2 as feedstock, lowering its emissions and reducing dependence on fossil fuels. It aligns well with the UN's Sustainable Development Goals on energy, sustainability and climate. This study reports the synthesis of copper-based catalysts supported on zinc oxide or graphene, promoted by palladium. The nanoparticle catalysts demonstrate high efficiency in CO2 and CO hydrogenation, favouring methane production at lower metal loadings but methanol production at higher copper content. This sustainable approach highlights the potential for reducing environmental impact by improving catalytic performance. |
Introduction
Carbon dioxide (CO2) is Earth's most abundant greenhouse gas responsible for absorbing and radiating heat.1 As of April 2024, the atmospheric CO2 concentration observed by the NOAA Global Monitoring Lab reached 425.38 ppm, marking a new record.2 This value surpasses any previous levels observed in human history and it is expected to increase to ≈500 ppm in the next 20 years, which is regarded as the point of no return.3 Accordingly, the International Energy Agency (IEA) took the initiative of Carbon Capture, Utilization and Storage (CCUS)4 and Net Zero Emissions by the 2050 (NZE)5 Scenario. However, despite the existence of numerous strategies, effective solutions to this challenge remain elusive.The increase in CO2 concentration is largely attributed to burning fossil fuels for energy generation and use as feedstock for chemicals. The utilization of CO2 as an alternative and sustainable carbon source has thus gained worldwide attention as a key aspect of CCUS.6 The advancements in energy-efficient catalytic CO2 conversion using renewable energy have the potential to mitigate CO2 emissions and reduce reliance on fossil fuels.7 One of the straightforward ways to utilize CO2 is its hydrogenation to produce value-added products such as hydrocarbons (including olefins, liquid hydrocarbons, and aromatics), oxygenates (such as alcohols and dimethyl ether) or reaction gases such as CO (for syngas and Fischer–Tropsch processes) or methane.8,9 The three primary catalytic methods for CO2 hydrogenation include thermal catalysis,8–20 electrocatalysis,21,22 and photocatalysis.23–26 Although thermal catalysis requires higher temperatures and pressures for CO2 activation, it remains a widely applied process for rapid and efficient transformation of CO2 (that could originate from carbon capture).
Due to thermodynamic limitations, hydrogenation to methanol (MeOH) demands high-pressure and elevated operating temperature to achieve favorable reaction kinetics, as well as an effective and active catalyst. In this regard, various catalytic materials including Pt, In, Ni, Ru, Zr, Rh, and Ga have been widely explored for CO2 hydrogenation to MeOH.27–32 However, Cu still stands out as the most utilized and studied metal16–18 due to its high activity at lower temperatures, making it particularly suitable for the CO2 hydrogenation reaction. Additionally, Cu offers advantages in terms of cost-effectiveness, as well as its multivalency (Cu0, CuI, and CuII).19 Moreover, Cu maintains stable interaction with oxygen, preventing the formation of unstable intermediates or surface poisoning. The CO-induced mobility of Cu atoms may counteract sintering.33,34 It also exhibits strong interactions with other materials, such as Zn, which improves stability, selectivity, and the ability to dissociate H2.35,36
Industrially, MeOH is mainly synthesized from a feed of CO2, CO, and H2 at high pressure (100 bar), using Cu/ZnO/Al2O3 catalysts.37,38 The kinetics and thermodynamics of this reaction have been widely studied11,39–41 along with the influence of water on catalyst performance.42–44 There are three main reactions involved in the hydrogenation of CO2,
Reverse water gas shift (RWGS):
| CO2 + H2 → CO + H2O ΔH25°C = 41 kJ mol−1 (ref. 8) |
Methanation:
| CO2 + 4H2 → CH4 + 2H2O ΔH25°C = −164 kJ mol−1 (ref. 45) |
MeOH synthesis:
| CO2 + 3H2 → CH3OH + H2O ΔH25°C = −49.5 kJ mol−1 (ref. 46) |
The reaction selectivity is thus influenced by the reaction temperature, pressure, and the catalyst used. Additionally, the catalytic performance of Cu can be further improved by the addition of promoters (e.g. Mn, Zr, Zn, and Al)47,48 and by various supports (e.g. graphitic carbon, SiO2, CNTs, and MgO).49–52 This can modulate active sites and the surface charge of Cu.53
Studies have shown that the use of Pd, either alone or as a promoter of Cu, both over ZnO, can enhance selectivity towards various products of CO2 hydrogenation.54,55 Siriworarat et al.56 investigated the impact of Pd loading (5, 10, and 15 wt%) on a Pd–Cu–Zn catalyst, where Cu and Zn comprised 25 wt%. Conducted at 250 °C and 25 bar, the study demonstrated that the highest performance was achieved with the catalyst containing 15 wt% Pd, 25 wt% Cu, and 25 wt% Zn, yielding a MeOH space-time yield of 0.112 kgMeOH kgcat−1 h−1. In another study by Díez-Ramírez et al.,57 37.5 wt% Pd with CuZn/SiC exhibited the highest selectivity towards MeOH. In addition, Deerattrakul et al.7 found that 15 wt% CuZn(O) loading over a nitrogen-doped graphene aerogel achieved the highest MeOH production (0.095 kgMeOH kgcat−1 h−1) at a reaction temperature of 250 °C and a relatively low pressure of 15 bar. Collectively, the combination of Cu with Pd over ZnO or graphene as the support may present an intriguing avenue to enhance CO2 hydrogenation to hydrocarbons, warranting further exploration through studies of monometallic Cu/ZnO, bimetallic CuPd/ZnO, or CuPd/Gr. Even more so, as one would rather avoid using noble metals.
To add to the current understanding, different preparation protocols were adapted to prepare ZnO-supported CuPd (bimetallic) and graphene-supported CuPd, as well as ZnO supported Cu or Pd (monometallic) catalysts, as summarized in Table 1. The reduction temperature of the catalysts (monometallic) was varied (i.e., 200, 300, and 500 °C) to investigate its influence on catalytic activity, catalyst morphology, particle size, and composition. High resolution transmission electron microscopy (HRTEM) with electron energy loss spectroscopy (EELS) and energy-dispersive X-ray spectroscopy (EDX), high-angle annular dark-field scanning transmission electron microscopy (HAADF-STEM), and X-ray powder diffraction (XRD) were employed to analyze the size, distribution of metal particles, and the catalysts' composition. Furthermore, temperature-programmed reduction (TPR) provided insights into catalyst stability and metal–support interactions. Moreover, temperature-programmed desorption (TPD) revealed information about adsorption sites. On the reduced catalysts, the hydrogenation of CO2 was carried out at atmospheric pressure and an elevated pressure of 20 bar in a continuous flow fixed-bed reactor, connected to a micro-gas chromatograph (GC) for kinetic measurements, with the reaction conducted at different temperatures. Selectivity and catalytic activity as a function of reaction temperature were compared for each catalyst.
| Synthesized catalysts | Abbreviation |
|---|---|
5% CuPd (3![[thin space (1/6-em)]](https://www.rsc.org/images/entities/char_2009.gif) :2) on ZnO or graphene (reduction method) :2) on ZnO or graphene (reduction method) |
(i) CuPd/ZnO-r |
| (ii) CuPd/Gr-r | |
| 5% CuPd (3:2) on ZnO (polyol synthesis method) |
(iii) CuPd/ZnO-p |
| 90% Cu- and Zn-nitrates reduced with Na2CO3 (co-precipitation method) | (iv) 90Cu/ZnO-c |
| 5% Cu or Pd on ZnO (wet impregnation method) | (v) Cu/ZnO-i |
| (vi) Pd/ZnO-i |
Results and discussion
Catalyst synthesis and characterization
Fig. 1A illustrates the synthesis procedures for obtaining different types of catalysts using ZnO or graphene (Gr) as supports (Table 1; for details see the Experimental section). Following a redox method (denoted by r)58 for 5 wt% Cu/Pd (3:2), H2-reduced Cu on ZnO or Gr was mixed with Pd salt under N2 (Cu + Pd2+ → Cu2+ + Pd) forming (i) CuPd/ZnO-r or (ii) CuPd/Gr-r catalysts, respectively.
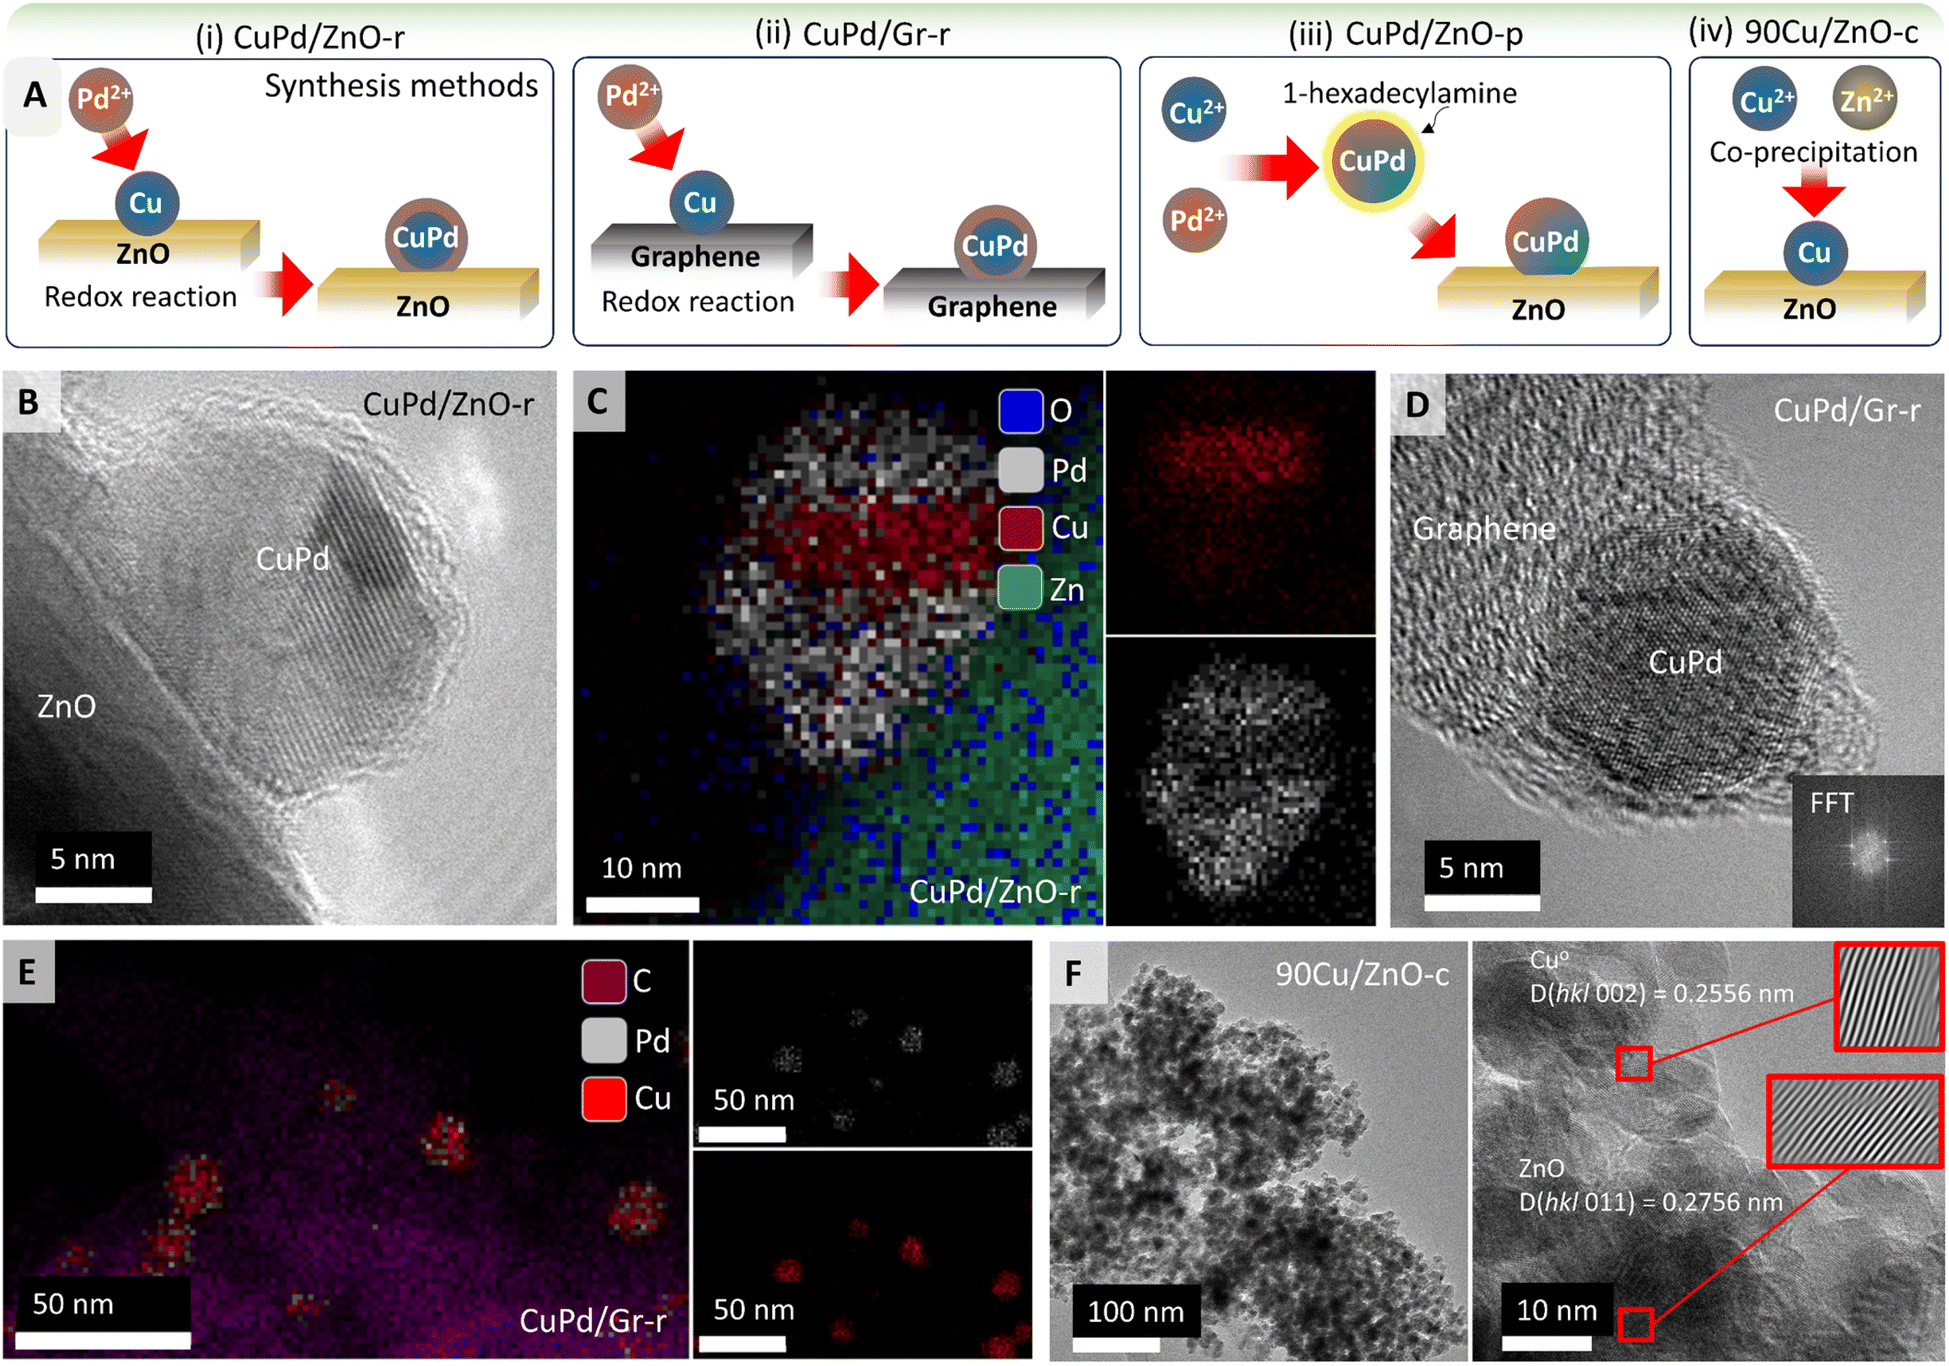 | ||
| Fig. 1 (A) Schematics elaborating the synthesis of nanocatalysts through different methods, mainly (i) 5%Cu/Pd (3:2) over ZnO or (ii) graphene through the liquid reduction method, (iii) Pd2+ and Cu2+ reduction with ethylene glycol, stabilization with 1-hexadecylamine and deposition on ZnO to obtain CuPd/ZnO-p, and (iv) 90% Cu with Zn nitrates, reduced with aqueous Na2CO3 to produce 90Cu/ZnO-c (for the details of synthesis see the Experimental section), (B) HRTEM image of the bimetallic CuPd/ZnO-r catalysts, (C) corresponding EDX mapping showing the distribution of ‘Pd’, ‘Cu’ and ‘O’ atoms in CuPd/ZnO-r, (D) HRTEM image of the CuPd/Gr-r catalysts, (E) EDX mapping showing the distribution of ‘C’, ‘Pd’, and ‘Cu’ atoms in CuPd/Gr-r and (F) HRTEM image of the 90Cu/ZnO-c catalysts, also showing the interplanar spacing of Cu (d = 0.256 nm) and ZnO (d = 0.277 nm). | ||
In a polyol synthesis,59,60 Pd2+ and Cu2+ ions were reduced with ethylene glycol and stabilized with 1-hexadecylamine as a ligand. The obtained CuPd alloy nanoparticles (NPs) were impregnated on the ZnO support forming (iii) CuPd/ZnO-p (p denotes polyol synthesis). Moreover, adopting a co-precipitation method,61 90 wt% Cu and Zn nitrates were reduced together with aqueous Na2CO3, dried, and calcined at 350 °C to obtain (iv) the 90Cu/ZnO-c catalyst (c denotes co-precipitation). (v) Cu/ZnO-i and (vi) Pd/ZnO-i were prepared by wet impregnation (denoted by i). In the following, for simplicity %loading refers to wt%.
In order to determine the morphology, elemental composition, and metal–support interactions of the prepared catalysts, HRTEM, EDX, and EELS mapping were employed. CuPd/ZnO-r was examined after H2 pretreatment (Fig. 1B) and after CO2 hydrogenation, as shown in Fig. 1C and S1.† A notable aspect (EDX mapping in Fig. 1C) is the segregation of Cu and Pd within the NPs. Two potential reasons may account for CuPd/ZnO-r possessing a core–shell structure, formed during synthesis. As shown in Fig. 1A, CuPd/ZnO-r is formed through the direct deposition of Pd via a redox reaction, with Cu/ZnO already in place while Pd coats the Cu, resulting in the development of layered NPs. Second, the layered structure may arise from reaction conditions, as CO can displace (mobilize) Cu atoms,33,62 while the strong binding of CO to Pd drives its surface segregation. Given the layered morphology of the NP, the Cu:Pd ratio does not correspond to a specific phase. The line scan of a NP after CO hydrogenation (Fig. S2†) confirmed that Cu is predominantly present in the core, while Pd is mainly located on the outer shell, which is also consistent with CuPd/ZnO-r observed after CO2 hydrogenation (Fig. S1†). Furthermore, the concentration of Zn within the particle increases in the vicinity of the ZnO support. Since there is no concurrent increase in oxygen within the particle, it suggests that Zn interacts with the particle, forming an interface alloy between the particle and support.
The bimetallic CuPd/ZnO-p catalyst was examined both before (Fig. S3†) and after CO2 hydrogenation (Fig. S4†). The EDX maps in Fig. S3† suggest that the NPs were CuPd alloys, with Fig. S4† showing a nearly uniform distribution of Cu and Pd within the NPs. No metallic Zn was detected in the NPs, although XRD detected PdZn alloys (see below).
A HRTEM image of the reduced CuPd/Gr-r catalyst is presented in Fig. 1D. By performing fast Fourier transformation (FFT) of a small image area encompassing the NP, the lattice distance was determined. This analysis was conducted for four different NPs, yielding the results listed in Table S1.† The percentage of Cu was calculated using Vegard's rule, which assumes that an arbitrary mixture of two components (such as Cu and Pd) has the same face-centered cubic (fcc) crystal structure. Based on the lattice constant of Cu of 0.361 nm and that of Pd of 0.389 nm, successful incorporation of Cu into the Pd lattice can be assumed. Additionally, EDX analysis was applied for determining the elemental composition (Fig. 1E). EDX phase mapping clearly shows that the NPs mainly consist of Cu and Pd as assumed for Vegard's rule. The accompanying EDX plot (Fig. S5†) shows the quantification spectra of the NPs, with results listed in Table S2.† Similar to the results obtained via Vegard's rule, no discernible trend regarding the NP composition (Cu/Pd) ratio was observed.
In addition to EDX mapping, EDX line scans of the CuPd/Gr-r catalyst were acquired, depicted in Fig. S6.† Notably, the NP in the central image exhibited a much lower Pd percentage than the other NPs. In the left image, an apparent increase in carbon content inside the NP was observed nearer to the support. Given that the inclusion of carbon inside the NPs is unlikely, the signal rather originates from the graphene support under the NP. The line scan in the right image traverses two NPs, with Cu found between them, but no Pd. This suggests that sintering is initiated by the movement of Cu atoms,33 leading to coalescence on the graphene support.
The catalyst obtained via the co-precipitation method, with 90% Cu over ZnO (90Cu/ZnO-c), exhibited an average particle size of 12 nm (Fig. 1F), with NPs uniformly dispersed. The interplanar spacing of Cu was d = 0.256 nm, while for ZnO it was d = 0.277 nm. The lattice constant of fcc Cu is 0.361 nm, while ZnO exhibits a hexagonal crystal structure, with lattice parameters a = 0.32496 nm and c = 0.52042 nm. This confirms the assignment of the interplanar spacings and lattice structures to Cu and ZnO.
Similarly, the catalysts with low Cu or Pd loading (5%) over ZnO, obtained through a one pot wet-impregnation method, were also analyzed. The Cu/ZnO-i catalyst after reduction in H2 showed a single Cu NP on ZnO (Fig. S7†). Benefitting from the high resolution, lattice planes were analyzed for phase identification, i.e. in the red square an FFT was generated. After inverse FFT, the image revealed individual lattice planes without interference from background signals. The distance between lattice planes was measured to be 0.251 nm. Fig. S7† illustrates the unit cell of Cu, focusing on (1 1 0) lattice planes marked in purple, where the distance between two Cu atoms was measured as d(Cu–Cu) = 0.25 nm, as observed in the HRTEM image.
Additionally, Fig. S8† depicts a high-angle annular dark-field scanning transmission electron (HAADF-STEM) micrograph of the Pd/ZnO-i catalyst after H2 reduction at 500 °C. Variations in intensity in HAADF images are attributed to differences in sample thickness or the atomic number. The red box surrounding the NP on the surface of the ZnO support (Fig. S8†) was chosen for EDX analysis revealing reduced Pd and Zn, with an overall composition of 46.6 at% Pd and 53.4 at% Zn.
Fig. S9 and S10† reveal the effect of high pressure (20 bar) and temperature (500 °C) on NP size in the course of the hydrogenation reaction. Bimetallic NPs (CuPd) showed significantly more sintering on graphene, increasing in size from 8.7 nm to 20 nm, than when supported on ZnO, for which the NP size only increased from 8.4 nm to 11 nm. In contrast, monometallic NPs of both Cu and Pd on ZnO even exhibited a slight reduction in size, likely due to CO-induced redispersion (Fig. S9†).
Fig. 2A and S11–S13† display the (area-averaged) X-ray diffraction (XRD) patterns of the as-prepared (calcined) and H2-reduced catalysts. For the CuPd/ZnO-r catalyst in the calcined state, CuO was identified, with no mixed CuPd oxide detected. Due to the small size of the metal particles, the Bragg peaks appear broader and blend into the background noise. Pd exhibits a higher affinity towards Zn, as a separate PdZn (1 1 1, 2 0 0) phase was detected after H2 reduction at 500 °C, still with no signs of a CuPd alloy. This suggests that in CuPd/ZnO, Cu and Pd separate, also forming PdZn interfaces, in line with the locally resolved HRTEM studies (see Fig. 1B). The CuPd/ZnO-p catalyst showed similar XRD patterns before and after H2 reduction, with peaks related to PdZn being less intense than the ones for CuPd/ZnO-r. Conversely, the CuPd/Gr-r catalyst (Fig. S11†) after H2 reduction exhibited dominant diffraction from graphitic carbon (0 0 2), because of graphene calcination at elevated temperatures, in line with literature reports.63,64 Furthermore, the XRD patterns of the Cu/ZnO-i and Pd/ZnO-i catalysts (Fig. S12 and S13†) after pretreatment in H2 at different temperatures confirmed that PdO was reduced at 200 °C, while CuO reduction occurred at a higher temperature of 300 °C.
 | ||
| Fig. 2 (A) Crystal structure of calcined (500 °C) and H2-reduced CuPd/ZnO-r and CuPd/ZnO-p catalysts. The crystal structure of other catalysts can be seen in Fig. S9–S11.† (B) H2-temperature programmed reduction (TPR) profile of calcined (500 °C) CuPd/ZnO-r, CuPd/ZnO-p, Cu/ZnO-i and Pd/ZnO-i catalysts. | ||
Temperature-programmed reduction (TPR) studies were thus carried out to monitor the H2-induced reduction behaviour of the (calcined) catalysts in more detail (10% H2 in Ar). The mass spectrometer (MS) signals of H2 (m/z = 2) were plotted against temperature, as shown in Fig. 2B and S14.† Pd/ZnO-i exhibited H2 consumption starting at a minimum temperature of 80 °C, while Cu/ZnO-i was reduced at 270 °C. In contrast, CuPd/ZnO-r and CuPd/ZnO-p displayed distinctly different profiles. For CuPd/ZnO-r, the minimum of Pd was slightly shifted to higher temperature (130 °C), while the minimum for Cu was at 290 °C. This again suggests that CuPd/ZnO-r consists of somewhat separate, but still connected Cu and Pd, likely within the NPs. The CuPd/ZnO-p profile exhibited only a single minimum at 170 °C, indicating the presence of alloyed CuPd NPs.
To evaluate the binding strength and distribution of H2 adsorption sites, hydrogen-temperature programmed desorption (H2-TPD) was performed, which also shed light on metal–support interactions. H2-TPD was performed for both catalysts (Cu and Pd/ZnO-i) for each reduction temperature (T200, T300, and T500°C). In Fig. 3A, the H2 desorption profile of the Cu/ZnO-i catalysts revealed desorption maxima at 390 and 393 °C for 200 and 300 °C reduction temperatures, respectively. In contrast, the Cu/ZnO-i catalyst reduced at 500 °C did not exhibit a clear desorption peak, potentially due to the high-temperature reduction process leading to the formation of a CuZn alloy or sintering, which weakens the chemical bonding of H2 on the catalyst surface. Similarly, at higher reduction temperatures (T300 and T500°C), the Pd/ZnO-i catalysts did not display the desorption maximum observed after T200°C (Fig. 3A) anymore. This again suggests that Pd can rather easily form an alloy with Zn at temperatures exceeding 200 °C.66–68 Metallic Pd can absorb hydrogen into the NPs, which ceases upon forming a PdZn alloy. Analogously, previous studies with Pd–Pb alloys indicated a decreasing intensity of H2 desorption upon addition of Pb.69 For the calculation of the binding energy of molecules on the catalyst's surface, the Redhead approximation was applied.70 The energy of desorption (Edes) for Cu/ZnO-i was Edes = 169 kJ mol−1 at Tmax = 390 °C, while for Pd/ZnO-i, it was Edes = 174 kJ mol−1 at Tmax = 410 °C.
 | ||
| Fig. 3 Temperature programmed desorption (TPD) studies of catalysts. (A) H2-TPD of Cu/ZnO-i and Pd/ZnO-i for different reduction temperatures with m/z = 2 recorded and (B) D2O-TPD of ZnO for different reduction temperatures with m/z = 4 recorded. Structure of ZnO with possible reaction pathways of H2 and D2(O) on the ZnO surface.65 | ||
Furthermore, to detect surface defects in the ZnO support,71 TPD was performed with deuterium oxide (D2O-TPD). The desorption behaviour of D2 from D2O adsorbed on the catalyst surface is indicative of the nature and density of surface defects or oxygen vacancies.72 Specifically, the desorption temperature and intensity of D2 desorption peaks can reveal the availability and accessibility of surface defect sites. Higher desorption temperatures and/or broader desorption peaks may suggest stronger interactions between D2O and defects, indicating vacancies in the ZnO support, which can influence the CO2 and CO hydrogenation reactions.73
In Fig. 3B, D2 desorption from the ZnO surface is displayed. After catalyst reduction at 200 °C and D2O dosing, only weak D2 desorption was observed. However, D2 desorption peaks were clearly visible for reduction at 300 and 500 °C, with peak maxima ranging from 313 to 427 °C and 285 to 510 °C, respectively. A desorption peak at approximately 370 °C is evident for every reduction temperature. Fig. 3B also illustrates potential processes involving the interaction of H2 and H2O, or D2 and D2O, with O vacancies on the ZnO surface. Due to the interaction of D2O with the surface defects of ZnO, oxygen vacancies can be re-filled and D2 formed (m/z = 4). The literature also reported the observations of surface defects in hydrothermally grown ZnO after exposure to D2 gas at elevated temperatures.74
CO2 and CO hydrogenation to methane or methanol
We then determined the CO2 hydrogenation performance of the various catalysts (Fig. 4A) at 20 bar pressure and temperatures from 300 to 500 °C, including CuPd/ZnO-r, CuPd/ZnO-p, CuPd/Gr-r, 90Cu/ZnO-c, Cu/ZnO-i, and Pd/ZnO-i. Prior to each measurement, the catalysts were reduced in a hydrogen flow. The reaction mixture consisted of 5% CO2 and 20% H2 in helium. CO2 conversion increased with temperature, rising from about 5% at 300 °C to >30% at 500 °C. Notably, for the bimetallic catalysts, CO2 conversion was at least 3% higher across all measured temperatures. CO and CH4 were detected as the main products of CO2 hydrogenation, with the CO yield increasing linearly with temperature, reaching 20% at 500 °C. For both CuPd/ZnO-r and CuPd/ZnO-p, a significant increase was also observed in CH4 yield (from 5.8% to 13%) as the temperature increased from 350 to 400 °C. At 500 °C, CuPd/ZnO-r exhibited the highest CH4 yield (16%) as compared to CuPd/ZnO-p and CuPd/Gr, which both yielded 14%. The monometallic Cu/ZnO-i had a CH4 yield of 12%, while Pd/ZnO-i showed the lowest yield of 8%.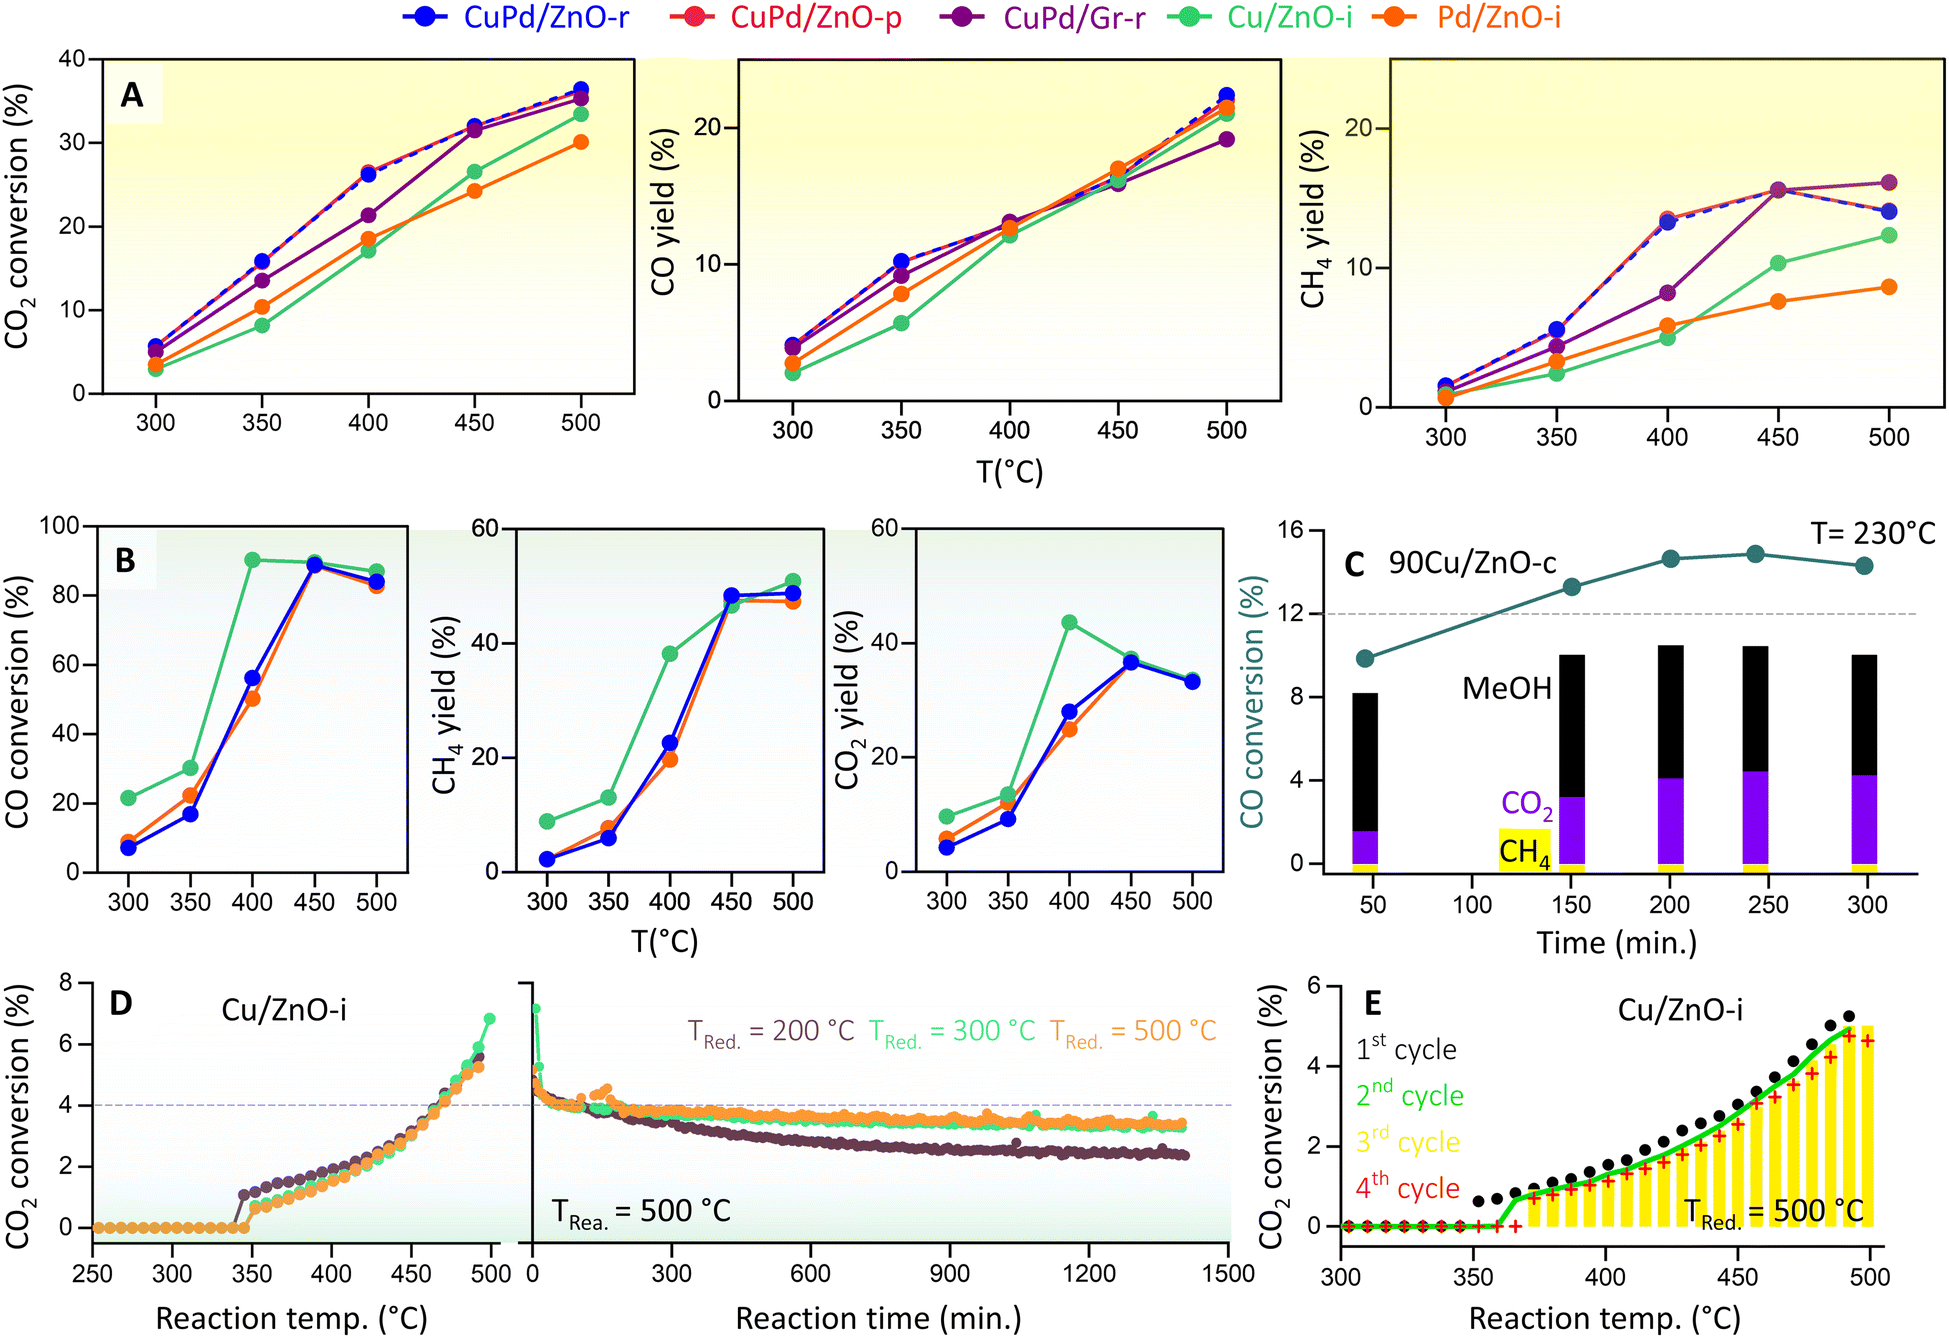 | ||
| Fig. 4 Kinetic measurements of CO2 and CO hydrogenation. (A) Catalytic performance of CuPd/ZnO-r, CuPd/ZnO-p, CuPd/Gr-r, Cu/ZnO-i, and Pd/ZnO-i catalysts in terms of CO2 conversion and CO and CH4 yields at p = 20 bar and T = 300–500 °C, and (B) CO conversion and CH4 and CO2 yields for CuPd/ZnO-r, Cu/ZnO-i, and Pd/ZnO-i at p = 20 bar and T = 300–500 °C. (C) CO hydrogenation to MeOH (%) and CO2 (%) by 90Cu/ZnO-c catalysts at p = 20 bar and T = 230 °C (for CO2 hydrogenation, see Fig. S15†), (D) CO2 conversion (%) to CO by Cu/ZnO-i catalysts reduced at different temperatures, at p = 1 bar and T = 300–500 °C, and “reaction time” refers to the time on stream under constant conditions (for the Pd/ZnO-i catalyst, see Fig. S17†), and (E) CO2 conversion (%) to CO over multiple cycles (for the Cu/ZnO-i catalyst reduced at 500 °C). | ||
Very differently, the catalyst containing 90 wt% Cu (90Cu/ZnO-c), prepared by co-precipitation and tested at 230 °C, exhibited selectivity towards MeOH rather than CH4 (Fig. S15†). Despite a CO2 conversion of 5.5%, the MeOH yield remained constant over time, with little CH4 detected. Overall, the CO yield was 4%, while MeOH was recorded at 2%. A similar trend had been observed in previous studies, demonstrating improved MeOH selectivity/yield upon high Cu loading on ZnO10,75 and observation of a volcano-like pattern in MeOH selectivity with respect to the Cu NP size.76
Furthermore, as RWGS may be followed by CO hydrogenation, the latter reaction was evaluated on Cu/ZnO-i, Pd/ZnO-i, and CuPd/ZnO-r under conditions similar to those of CO2 hydrogenation, and only 5% CO was used instead of CO2 (Fig. 4B). Notably, from 400 to 500 °C, CO conversion was at least 40% higher than CO2 conversion. CH4 (from methanation) and CO2 (from WGS) were identified as the main products of CO hydrogenation, with the CO2 yield increasing linearly with temperature, peaking at 37% at 450 °C and then dropping to 33% at 500 °C. The CH4 yield reached its highest level of 48% at 450 °C and remained steady up to 500 °C. No significant differences were observed between monometallic or bimetallic catalysts for CO hydrogenation. Nevertheless, ethane (from FT) was detected as a side product (≈4%) at 400 °C (Fig. S16†). Interestingly, the 90Cu/ZnO-c catalyst showed a higher CO conversion of 14%, with a MeOH yield of 10% and a CO2 yield of 4.3% at 230 °C (Fig. 4C). Overall, the MeOH yield remained constant at 8–10% over 300 minutes. This further confirmed that a CO/H2 gas feed increases the MeOH yield (CO + 2H2 → CH3OH).20,41 Indeed, for the best performance, a mixture of CO2/CO/H2 (5%/20%/75%) is known to be required.77 The conducted experiments confirm that the hydrogenation of CO yields more CH4 or MeOH than CO2 hydrogenation. Thus, for MeOH production at the industrial level using Cu/ZnO-based catalysts, CO serves as the major feed gas (20%) alongside CO2 and H2.14
The catalytic performance of the best performing catalysts was further described by calculating the space-time yield (STY) (more details in the ESI†), which includes the amount of the catalyst (0.1 g) used during the reaction:
• For CO2 hydrogenation to CH3OH over 90Cu/ZnO-c, the STY was 0.0836 gMeOH gcat−1 h−1, and for CO hydrogenation, its STY was 0.4811 gMeOH gcat−1 h−1.
• For CO2 hydrogenation to CH4, CuPd/Gr-r showed the best performance with a STY of 0.2416 gCH4 gcat−1 h−1, while for CO hydrogenation, Cu–ZnO-i exhibited the best STY of 0.7618 gCH4 gcat−1 h−1.
A CuO/ZnO catalyst obtained through an ammonia-evaporation-induced synthetic method involving the impregnation of filament-like ZnO for CO2 hydrogenation at 3 bars showed the best performance, with a MeOH STY of 0.55 gMeOH gcat−1 h−1 and a selectivity of 78.2%.78 Moreover, Han et al.79 observed that doping Cu/ZnO catalysts with Pd, Pt, and Ru led to the formation of electron-rich Cu sites due to partial electron transfer, greatly enhancing CO2 activation. The Pd-doped catalyst demonstrated the highest MeOH STY of 0.52 gMeOH gcat−1 h−1 with 100 hours of stability. In contrast, over a Cu0.5Ni0.5/γ-Al2O3 catalyst at 5 bar pressure, Reddy et al.80 reported CO2 conversion not exceeding 30% to CO. During the reaction, the Cu core atoms migrated toward the surface, resulting in the restructuring of the Cu@Ni core–shell structure to a Cu–Ni alloy, which functioned as the active site by enhancing CO desorption.
To examine the effect of pressure, CO2 hydrogenation was also studied at atmospheric pressure (1 bar) from 250 to 500 °C, using Cu/ZnO-i or Pd/ZnO-i catalysts, pre-reduced at different temperatures (Tred = 200, 300, and 500 °C) (Fig. 4D). CO was the primary product of both catalysts. The CO2 conversion of Pd/ZnO-i was 11% higher than that of Cu/ZnO-i for every reduction temperature. A reaction temperature of about 300 °C was necessary for CO formation with the Pd/ZnO-i catalyst, whereas with Cu/ZnO-i amounts of CO were first detected at 380 °C. According to the literature,81–84 the reaction mechanism involves the adsorption of CO2 on the ZnO-supported Cu or Pd catalysts, leading to intermediate-carbonate formation.
To evaluate the catalysts' stability, a 24 hour reaction was carried out at 500 °C. Each catalyst underwent reduction pretreatment at 200, 300, or 500 °C before the long-term reaction. The Cu/ZnO-i catalyst reduced at 200 °C exhibited more pronounced deactivation than those pre-reduced at 300 or 500 °C (Fig. 4D). It appears that reduction at 200 °C was insufficient, with CuO still being present. During the reaction, the partly reduced sample was subjected to 500 °C and a gas flow of 20 vol% H2, leading to sintering of the remaining CuO NPs and final reduction to metallic Cu. The Cu/ZnO-i catalysts reduced at 300 and 500 °C displayed almost constant CO2 conversion to CO over the 24 hour reaction period (Fig. 4D). In contrast, the Pd/ZnO-i catalyst exhibited some CO2 conversion to CO at 200 °C, possibly due to metallic Pd already being present on the catalyst surface at this reduction temperature (Fig. S15†). The increase in reduction temperature resulted in surface alloy formation,55,85 as indicated by the presence of a PdZn alloy in XRD (Fig. S11†). Additionally, cyclic and long-term reactions demonstrated the stability of both catalysts, with no signs of decreasing CO2 conversion observed over multiple reaction cycles or for lower reduction temperatures (Fig. 4E and S17†).
For MeOH production over Cu/ZnO catalysts, a formate pathway has been proposed in the literature.86 A DFT study by Grabow and Mavrikakis87 demonstrated that CO2 hydrogenation over Cu/ZnO occurs via the formate pathway ( → HCOO* → HCOOH* →
  → CH2O* → CH3O* → CH3OH*). Meanwhile, MeOH production from CO follows the sequence CO* → HCO* → CH2O* → CH3O* → CH3OH*. Nevertheless, it is well documented in the literature that methanation, particularly over Pd-based bimetallic catalysts (e.g., CuPd), can follow either the formate or the reverse-water gas shift (RWGS) pathway.88 Future studies employing in situ or operando techniques may provide confirmation of these intermediates, although the mechanism is still controversially discussed.84
Conclusions
Not unexpectedly, the hydrogenation of CO2 or CO to CH4 and/or MeOH with catalysts of Cu, Pd, and PdCu NPs supported on ZnO or graphene has shown promise for reducing CO2 emissions. Through comprehensive characterization involving various techniques such as HRTEM, EDX, HAADF-STEM, XRD, H2-TPR, H2-TPD, and D2O-TPD, as well as CO2/CO hydrogenation kinetics, it was observed that lower Cu or Pd loadings (5%) supported on ZnO or graphene favored CH4 production from 300 to 500 °C and 20 bar pressure. CO was the major byproduct, indicating the occurrence of the reverse water gas shift (RWGS) reaction. The addition of the noble metal Pd to Cu had only a minor effect on performance. In contrast, higher Cu content (90%) strongly increased MeOH production in both CO2 and CO hydrogenation at high pressure (20 bar).CO2 hydrogenation at ambient pressure (1 bar) and high temperature (300–500 °C) on both Cu and Pd on ZnO produced CO as the major product, corroborating that high pressure is essential for CH4/MeOH production.
For CO hydrogenation at 400 to 500 °C, CO conversion was at least 40% higher than CO2 conversion, with CH4 and CO2 identified as the main products. Again, utilizing 90% Cu supported on ZnO led to an enhanced CO conversion of 14%, with a MeOH yield reaching 10% and a CO2 yield reaching 4.3% at 230 °C.
The findings underline the significance of catalyst (NP) composition, affected by the corresponding synthesis methodologies, for optimizing CO2 and CO hydrogenation processes for efficient methane or methanol production. This offers useful insights for advancing sustainable energy solutions.
Experimental
Synthesis of catalysts
The bimetallic catalysts were synthesized employing two distinct methods. For the first method (Fig. 1A), Cu was initially deposited on the support, followed by the addition of palladium salt to initiate a redox reaction and form alloyed NPs. The synthesis was conducted on both ZnO powder and graphene, with a total metal loading of 5 wt% and a Pd/Cu ratio of 2:3. Copper acetate monohydrate (0.19 g) was dissolved in distilled water under stirring, followed by the addition of 1.90 g ZnO (or graphene nanoplatelets), and the suspension was stirred overnight. The mixture was then heated to 130 °C to evaporate the water, and the solid was dried for 2 hours at 120 °C. Subsequently, the catalyst was calcined at 500 °C for 2 hours in air and then reduced with H2 at 350 °C for 2 hours. In a separate step, a solution of palladium acetate in water was prepared, and the reduced copper catalyst was added to the solution under a flow of nitrogen. After evaporating the water and drying, the catalyst was calcined at 500 °C for 2 hours before reduction in the reactor prior to kinetic measurements. The prepared catalysts are named “CuPd/ZnO-r” and “CuPd/Gr-r”.
In the second method (Fig. 1A), 1-hexadecylamine (HDA) capped Pd–Cu nanoparticles were synthesized and then dissolved in toluene for impregnation on ZnO. The metal loading was 5 wt%, with a Pd:Cu ratio of 2:3. In a round-bottom flask equipped with a magnetic stirrer, refluxing device, and nitrogen purging source, 80 mL of ethylene glycol was cooled with an ice bath and degassed for ten minutes under a stream of nitrogen. Copper acetate hydrate (0.95 g) and palladium acetate (0.43 g) were added to the flask, followed by the addition of 4.8 g of HDA to the ethylene glycol solution kept in the ice bath. The mixture was heated to 60 °C until HDA dissolved, resulting in a color change from blue to green. The solution was then heated to 160 °C and maintained at this temperature overnight. The color of the solution changed from deep blue/violet to green, then blue, and finally black, with a red layer, likely Cu2O, deposited on the inner wall of the flask. After cooling to room temperature, black NPs were separated by centrifugation and washed three times with ethanol to remove excess HDA and ethylene glycol. The NPs were dried overnight, resulting in a yield of approximately 58.7%. Subsequently, the nanoparticles were deposited on ZnO. The required amount of NPs for a metal loading of 5 wt% was calculated, and 0.1 g of NPs was suspended in toluene with 1.89 g of ZnO. After removing all toluene under vigorous stirring at about 150 °C, the precipitate was dried overnight at 125 °C, followed by calcination in air at 500 °C for 2 hours to completely remove HDA. The reduction of metal oxides was performed in the reactor before conducting kinetic measurements. The resulting catalyst weighed 1.77 g, representing a yield of 88.5%, named “CuPd/ZnO-p”.
Using a co-precipitation method,61 copper nitrate (90%) and Zn nitrates (10%) were reduced with aqueous Na2CO3, dried, and calcined at 350 °C to obtain the “90Cu/ZnO-c” catalyst (Fig. 1A).
The monometallic Cu and Pd catalysts were prepared via the wet-impregnation (“-i”) method of a ZnO support. Each catalyst was synthesized by weighing 0.32 g of copper acetate monohydrate or 0.21 g of palladium acetate. The metal salt was then suspended in 30 mL toluene in a flask, ensuring complete dissolution by adding a few drops of ethanol. Subsequently, 1.90 g of ZnO powder was added, and the suspension was stirred overnight at room temperature. The solvent was evaporated by heating the mixture to 150 °C, and the resulting solid was dried for 2 hours in an oven at 120 °C. The calcination of the catalysts was performed in air at 500 °C for 2 hours, using a heating rate of 10 °C min−1. This calcination step was essential for removing the acetate from the catalyst and converting the metals into oxides. Prior to kinetic measurements, the catalysts underwent reduction in the reactor. The reduction was carried out using a 10 vol% hydrogen/He flow at three different temperatures: 200 °C, 300 °C, and 500 °C. The prepared catalysts were named “Cu/ZnO-i” and “Pd/ZnO-i”.
Characterization of catalysts
The morphology and crystal structure of the catalysts were analyzed using an FEI TECNAI G2 F20™ at the University Service Center for Transmission Electron Microscopy (USTEM) at TU Wien. The microscope was equipped with a field emission gun (X-FEG) operated at an acceleration voltage of 200 kV. Additionally, an energy dispersive X-ray (EDX) silicon drift detector (SSD) (EDAX Apollo XLT SSD™) was incorporated into the TEM. Catalyst samples were loaded onto a carbon-coated Cu grid and then inserted into the TEM's inlet system using a single tilt holder. Various TEM images, including high-angle annular dark field (HAADF) and high-resolution (HR) TEM images, were recorded for each catalyst both before and after the reaction. Structural alterations during the reaction were discerned through image comparison, with the high resolution of HRTEM images allowing for precise measurement of lattice planes to identify different phases. Additionally, energy dispersive X-ray spectroscopy (EDX) and electron energy loss spectroscopy (EELS) measurements were conducted to investigate alloy formation. Particle size and distribution were analyzed using DigitalMicrograph software (Gatan™).The XRD measurements were primarily carried out to elucidate the atomic structure of various crystalline phases (metals, alloys, and oxides). Diffractograms were acquired using a PANanalytical X'Pert Pro™ Bragg–Brentano™ powder diffractometer at the X-ray Center of TU Wien. Cu Kα with a wavelength of 1.54 Å served as the radiation source. A small amount of each catalyst (including calcined catalysts and those subjected to three different reduction temperatures) was applied to a silicon wafer (Si (1 1 1) layer) fixed to a sample holder. The position (2θ angle) of the measured reflexes was compared with diffractograms from a database (COD Crystallography Open Database™) to identify crystalline phases. Rietveld refinement was employed to quantify the different compounds present in the diffractograms. This technique utilizes the least squares method to fit a theoretical line profile to the observed reflexes until a satisfactory match is achieved. Furthermore, Rietveld refinement facilitated the calculation of the crystallite size of both the support and the metal particles (using HighScore Plus 4.1 – PANalytical software™).
Temperature programmed reduction (TPR) served as a standard method for gathering insights into the reducibility of a material. The H2 TPR analysis was conducted in a continuous fixed bed quartz tube reactor. Approximately 50 mg of catalyst was loaded into the reactor tube, which was then positioned in a heating furnace. Gas flows of argon and H2 (the reducing gas) were carefully regulated using calibrated mass flow controllers. A total flow of 100 mL min−1 with 10 vol% H2 in Ar was passed through the sample. During the experiment, the furnace underwent heating from room temperature to 500 °C at a rate of 10 °C min−1. The quartz tube reactor was linked to a quadrupole mass spectrometer (Balzers Prisma™), which recorded the mass signals of H2 (m/z = 2) and H2O (m/z = 18) over time as a function of temperature. These experiments were carried out for both synthesized catalysts and the pure ZnO support.
Temperature programmed desorption (TPD) provided insights into the binding energy of absorbed molecules. The experiments were conducted within a solid quartz tube reactor in conjunction with a quadrupole mass spectrometer (Balzers Prisma™). Each catalyst, weighing 50 mg, was fixed with quartz wool and loaded into the reactor tube. To facilitate the adsorption of gas molecules on the surface, the catalyst was exposed to a gas mixture containing probe molecules such as H2 or D2O (100 or 10 mbar gas pressure, respectively). The Redhead approximation (eqn (1))70 can be applied for calculating the binding energy of molecules on the catalyst's surface:
 | (1) |
In general, the Redhead equation is valid for first-order desorption (single step desorption). As an approximation, eqn (1) was used with a frequency factor of v = 1013 s−1.
Moreover, D2O TPD of ZnO was carried out after reduction at various temperatures, and m/z = 4 signals were recorded. This experiment provided insights into possible vacancies within the support. Due to the interaction of D2O with the surface defects of ZnO, D2 was formed and detected by the mass spectrometer (m/z = 4). The same preparation and measurement steps as those used for H2 TPD were applied, with a partial pressure of 10 mbar D2O utilized for adsorption.
CO2 and CO hydrogenation
The kinetic measurements were conducted using a PID Eng&Tech Microactivity Effi Reactor™, a 30 cm long stainless-steel tubular reactor with an internal diameter of 9.91 mm, in a temperature range of 25 to 800 °C and pressures up to 20 bar. Feed gases including H2, O2, CO, CO2, and He were introduced into the reactor, with flow rates regulated by calibrated mass flow controllers. Online product analysis was performed via a micro-GC system (Inficon™; 300 Micro GC, runtime < 2 min), equipped with a molecular sieve, a plotQ column™ and a Thermal Conductivity Detector (TCD). The molecular sieve effectively separated small molecules such as H2, O2, and N2, while the plotQ column facilitated the separation of carbon-containing compounds. Kinetic measurements were conducted for CO2 and CO hydrogenation at 20 bar (or ambient pressure) and various temperatures ranging from 230 to 500 °C. Each temperature step was held constant for 8 hours, with average values taken for further calculations. This duration allowed the catalyst to reach a quasi-stationary state, minimizing the effects of transient behaviour. The total gas flow was maintained at 10 mL min−1 (corresponding to a flow of 6.81 × 10⁻⁶ mol s−1), comprising 5% CO2 or CO and 20% H2 in helium. Following each reaction period at a specific temperature, a reactivation treatment was applied. For this, the catalyst underwent oxidation with 10% O2 in He at 500 °C to remove carbonaceous deposits, followed by reduction with 10% H2 in He.The TCD was calibrated prior to the experiments using standard gas mixtures to ensure accurate quantification of the detected species. Calibration curves were generated by plotting the peak areas against the known concentrations of the standards (CO2, CO, and H2, respectively). Linear regression was used to determine the relationship between the peak area and concentration. During the experiments, the peak areas corresponding to the different reactants and products were recorded. These peak areas were then used to determine the concentrations of the molecules present. The calibrated peak areas from GC chromatograms were then utilized for the calculation of, e.g., the conversionCO2 (%), as given in eqn (2),
 | (2) |
 = peak area of CO2 entering the reactor and
  = peak area of CO2 exiting the reactor.
Analogously, for CO hydrogenation, the CO GC peak areas were utilized for the calculation of the CO conversion.
The selectivity of the catalysts for producing MeOH selectivityMeOH (%) was determined using eqn (3),
 | (3) |
Similarly, the CH4 selectivityCH4 (%) was determined using eqn (4)
 | (4) |
With conversion (eqn (2)) and selectivity (eqn (3) or (4)), the yield of MeOH, CH4, or CO can be calculated using eqn (5)–(7),
 | (5) |
 | (6) |
 | (7) |
For CO hydrogenation, yields were calculated analogously.
For the Gas Hourly Space Velocity (GHSV), Residence Time (τ), and Space Time Yield (STY) calculations, refer to Note 1 of the ESI.†
Data availability
The data supporting this article have been included as part of the ESI.†Author contributions
QM: conceptualization, methodology, validation, software, formal analysis, investigation, data curation, writing – original draft, and writing – review & editing. KD: conceptualization, methodology, validation, and formal analysis. JS: data curation and writing – review & editing. MH: methodology, validation, formal analysis, investigation, and writing – review & editing. KLK, TS, SL, AA, and JN: formal analysis, data curation, validation, and writing – review & editing. GR: conceptualization, validation, resources, writing – review & editing, and supervision.Conflicts of interest
There are no conflicts of interest to declare.Acknowledgements
This research was funded in part by the Austrian Science Fund (FWF) [10.55776/F81 and 10.55776/COE5] (SFB TACO and Cluster of Excellence Materials for Energy Conversion and Storage, MECS). For open-access purposes, the author has applied a CC BY public copyright license to any author-accepted article version arising from this submission.Notes and references
- K. O. Yoro and M. O. Daramola, CO2 emission sources, greenhouse gases, and the global warming effect. Adv Carbon Capture Methods, Technol. Appl., 2020, 3–28 Search PubMed.
- Global Monitoring Laboratory, Carbon Cycle Greenhouse Gases, [Internet], [cited 2024 Apr 20], available from: https://gml.noaa.gov/ccgg/trends/.
- H. Bhatt, M. Davawala, T. Joshi, M. Shah and A. Unnarkat, Forecasting and mitigation of global environmental carbon dioxide emission using machine learning techniques, Cleaner Chem. Eng., 2023, 5, 100095 CrossRef , https://www.sciencedirect.com/science/article/pii/S2772782323000037.
- Carbon Capture, Utilisation and Storage - Energy System, IEA, [Internet], [cited 2024 Apr 20]. available from: https://www.iea.org/energy-system/carbon-capture-utilisation-and-storage.
- Net Zero Emissions by 2050 Scenario (NZE) – Global Energy and Climate Model – Analysis, IEA, [Internet], [cited 2024 Apr 20], available from: https://www.iea.org/reports/global-energy-and-climate-model/net-zero-emissions-by-2050-scenario-nze.
- Q. Zhang, J. Liu, G. Wang and Z. Gao, A new optimization model for carbon capture utilization and storage (CCUS) layout based on high-resolution geological variability, Appl. Energy, 2024, 363, 123065 CrossRef CAS.
- V. Deerattrakul, N. Yigit, G. Rupprechter and P. Kongkachuichay, The roles of nitrogen species on graphene aerogel supported Cu-Zn as efficient catalysts for CO2 hydrogenation to methanol, Appl. Catal., A, 2019, 580, 46–52 CrossRef CAS.
- J. Díez-Ramírez, F. Dorado, A. R. De La Osa, J. L. Valverde and P. Sánchez, Hydrogenation of CO2 to Methanol at Atmospheric Pressure over Cu/ZnO Catalysts: Influence of the Calcination, Reduction, and Metal Loading, Ind. Eng. Chem. Res., 2017, 56(8), 1979–1987 CrossRef.
- M. Behrens, Promoting the Synthesis of Methanol: Understanding the Requirements for an Industrial Catalyst for the Conversion of CO2, Angew. Chem., Int. Ed., 2016, 55(48), 14906–14908, DOI:10.1002/anie.201607600.
- G. Xie, R. Jin, P. Ren, Y. Fang, R. Zhang and Z. J. Wang, Boosting CO2 hydrogenation to methanol by adding trace amount of Au into Cu/ZnO catalysts, Appl. Catal., B, 2023, 324, 122233 CrossRef CAS.
- D. Laudenschleger, H. Ruland and M. Muhler, Identifying the nature of the active sites in methanol synthesis over Cu/ZnO/Al2O3 catalysts, Nat. Commun., 2020, 11(1), 1–10 CrossRef , https://www.nature.com/articles/s41467-020-17631-5.
- M. Tóth, J. Kiss, A. Oszkó, G. Pótári, B. László and A. Erdohelyi, Hydrogenation of carbon dioxide on Rh, Au and Au-Rh bimetallic clusters supported on titanate nanotubes, nanowires and TiO2, Top. Catal., 2012, 55(11–13), 747–756, DOI:10.1007/s11244-012-9862-7.
- T. Numpilai, N. Chanlek, Y. Poo-Arporn, S. Wannapaiboon, C. K. Cheng and N. Siri-Nguan, et al., Pore size effects on physicochemical properties of Fe-Co/K-Al2O3 catalysts and their catalytic activity in CO2 hydrogenation to light olefins, Appl. Surf. Sci., 2019, 483, 581–592 CrossRef CAS.
- M. Behrens, F. Studt, I. Kasatkin, S. Kühl, M. Hävecker and F. Abild-Pedersen, et al., The Active Site of Methanol Synthesis over Cu/ZnO/Al2O3 Industrial Catalysts, Science, 2012, 336(6083), 893–897, DOI:10.1126/science.1219831.
- J. D. Grunwaldt, A. M. Molenbroek, N. Y. Topsøe, H. Topsøe and B. S. Clausen, In Situ Investigations of Structural Changes in Cu/ZnO Catalysts, J. Catal., 2000, 194(2), 452–460 CrossRef CAS.
- B. R. Van Den, G. Prieto, G. Korpershoek, L. I. Van Der Wal, A. J. Van Bunningen and S. Lægsgaard-Jørgensen, et al., Structure sensitivity of Cu and CuZn catalysts relevant to industrial methanol synthesis, Nat. Commun., 2016, 7(1), 1–7 Search PubMed , https://www.nature.com/articles/ncomms13057.
- S. Kuld, M. Thorhauge, H. Falsig, C. F. Elkjær, S. Helveg and I. Chorkendorff, et al., Quantifying the promotion of Cu catalysts by ZnO for methanol synthesis, Science, 2016, 352(6288), 969–974, DOI:10.1126/science.aaf0718.
- N. J. Divins, D. Kordus, J. Timoshenko, I. Sinev, I. Zegkinoglou and A. Bergmann, et al., Operando high-pressure investigation of size-controlled CuZn catalysts for the methanol synthesis reaction, Nat. Commun., 2021, 12(1), 1–10 CrossRef PubMed , https://www.nature.com/articles/s41467-021-21604-7.
- V. D. B. C. Dasireddy and B. Likozar, The role of copper oxidation state in Cu/ZnO/Al2O3 catalysts in CO2 hydrogenation and methanol productivity, Renewable Energy, 2019, 140, 452–460 CrossRef CAS.
- Z. Zhang, X. Chen, J. Kang, Z. Yu, J. Tian and Z. Gong, et al., The active sites of Cu–ZnO catalysts for water gas shift and CO hydrogenation reactions, Nat. Commun., 2021, 12(1), 1–9 CrossRef , https://www.nature.com/articles/s41467-021-24621-8.
- M. Yu, P. F. Sui, X. Z. Fu, J. L. Luo, S. Liu and M. Yu, et al., Specific Metal Nanostructures toward Electrochemical CO2 Reduction: Recent Advances and Perspectives, Adv. Energy Mater., 2023, 13(2), 2203191, DOI:10.1002/aenm.202203191.
- H. Rabl, S. N. Myakala, J. Rath, B. Fickl, J. S. Schubert and D. H. Apaydin, et al., Microwave-assisted synthesis of metal-organic chalcogenolate assemblies as electrocatalysts for syngas production, Commun. Chem., 2023, 6(1), 1–8 CrossRef , https://www.nature.com/articles/s42004-023-00843-3.
- J. Hong, W. Zhang, J. Ren and R. Xu, Photocatalytic reduction of CO2 : a brief review on product analysis and systematic methods, Anal. Methods, 2013, 5(5), 1086–1097 RSC , https://pubs.rsc.org/en/content/articlehtml/2013/ay/c2ay26270c.
- Y. Cui, A. Labidi, X. Liang, X. Huang, J. Wang and X. Li, et al., Pivotal Impact Factors in Photocatalytic Reduction of CO2 to Value-Added C1 and C2 Products, ChemSusChem, 2024, e202400551, DOI:10.1002/cssc.202400551.
- S. Naghdi, A. Cherevan, A. Giesriegl, R. Guillet-Nicolas, S. Biswas and T. Gupta, et al., Selective ligand removal to improve accessibility of active sites in hierarchical MOFs for heterogeneous photocatalysis, Nat. Commun., 2022, 13(1), 1–12 Search PubMed , https://www.nature.com/articles/s41467-021-27775-7.
- H. Kisch and D. Bahnemann, Best Practice in Photocatalysis: Comparing Rates or Apparent Quantum Yields?, J. Phys. Chem. Lett., 2015, 6(10), 1907–1910, DOI:10.1021/acs.jpclett.5b00521.
- W. Zhou, E. Brack, C. Ehinger, J. Paterson, J. Southouse and C. Copéret, Reactivity Switch of Platinum with Gallium: From Reverse Water Gas Shift to Methanol Synthesis, J. Am. Chem. Soc., 2024, 146, 10806–10811, DOI:10.1021/jacs.4c01144.
- P. Kampe, N. Herrmann, A. Wesner, C. Ruhmlieb and J. Albert, Catalyst and Parameter Optimization Study for Slurry-Phase Methanol Synthesis Using Ni-Doped Indium-Based Catalysts, ACS Sustain. Chem. Eng., 2023, 11(39), 14633–14644, DOI:10.1021/acssuschemeng.3c05584.
- X. Jia, K. Sun, J. Wang, C. Shen and C. J. Liu, Selective hydrogenation of CO2 to methanol over Ni/In2O3 catalyst, J. Energy Chem., 2020, 50, 409–415 CrossRef.
- C. Wu, L. Lin, J. Liu, J. Zhang, F. Zhang and T. Zhou, et al., Inverse ZrO2/Cu as a highly efficient methanol synthesis catalyst from CO2 hydrogenation, Nat. Commun., 2020, 11(1), 1–10 CrossRef PubMed , https://www.nature.com/articles/s41467-020-19634-8.
- M. Meng, J. Li, H. Zou, J. Zheng, T. A. S. Wu and T. I. S. Chan, et al., Methanol Synthesis at a Wide Range of H2/CO2 Ratios over a Rh-In Bimetallic Catalyst, Angew. Chem., 2020, 132(37), 16173–16180, DOI:10.1002/ange.202000841.
- B. G. Schieweck, P. Jürling-Will and J. Klankermayer, Structurally Versatile Ligand System for the Ruthenium Catalyzed One-Pot Hydrogenation of CO2 to Methanol, ACS Catal., 2020, 10(6), 3890–3894, DOI:10.1021/acscatal.9b04977.
- M. Roiaz, L. Falivene, C. Rameshan, L. Cavallo, S. M. Kozlov and G. Rupprechter, Roughening of Copper (100) at Elevated CO Pressure: Cu Adatom and Cluster Formation Enable CO Dissociation, J. Phys. Chem. C, 2019, 123(13), 8112–8121 CrossRef CAS PubMed.
- B. Eren, D. Zherebetskyy, L. L. Patera, C. H. Wu, H. Bluhm and C. Africh, et al., Activation of Cu(111) surface by decomposition into nanoclusters driven by CO adsorption, Science, 2016, 351(6272), 475–478, DOI:10.1126/science.aad8868.
- P. Amann, B. Klötzer, D. Degerman, N. Köpfle, T. Götsch and P. Lömker, et al., The state of zinc in methanol synthesis over a Zn/ZnO/Cu(211) model catalyst, Science, 2022, 376(6593), 603–608, DOI:10.1126/science.abj7747.
- V. Schott, H. Oberhofer, A. Birkner, M. Xu, Y. Wang and M. Muhler, et al., Chemical Activity of Thin Oxide Layers: Strong Interactions with the Support Yield a New Thin-Film Phase of ZnO, Angew. Chem., Int. Ed., 2013, 52(45), 11925–11929, DOI:10.1002/anie.201302315.
- F. Liao, X. P. Wu, J. Zheng, M. M. J. Li, A. Kroner and Z. Zeng, et al., A promising low pressure methanol synthesis route from CO2 hydrogenation over Pd@Zn core–shell catalysts, Green Chem., 2017, 19(1), 270–280 RSC.
- X. Liu, H. Wang and J. Lu, Recent progress in understanding the nature of active sites for methanol synthesis over Cu/ZnO catalysts, J. Catal., 2024, 436, 115561 CrossRef CAS.
- Y. Li, Y. Wang, X. Zhang and Z. Mi, Thermodynamic analysis of autothermal steam and CO2 reforming of methane, Int. J. Hydrogen Energy, 2008, 33(10), 2507–2514 CrossRef CAS.
- K. Anic, A. Wolfbeisser, H. Li, C. Rameshan, K. Föttinger, J. Bernardi and G. Rupprechter, Surface spectroscopy on UHV-grown and technological Ni-ZrO2 reforming catalysts: From UHV to operando conditions, Top. Catal., 2016, 59, 1614–1627, DOI:10.1007/s11244-016-0678-8.
- A. Beck, M. A. Newton, L. G. A. van de Water and J. A. van Bokhoven, The Enigma of Methanol Synthesis by Cu/ZnO/Al2O3-Based Catalysts, Chem. Rev., 2024, 124(8), 4543–4678, DOI:10.1021/acs.chemrev.3c00148.
- Y. F. Zhao, Y. Yang, C. Mims, C. H. F. Peden, J. Li and D. Mei, Insight into methanol synthesis from CO2 hydrogenation on Cu(1 1 1): Complex reaction network and the effects of H2O, J. Catal., 2011, 281(2), 199–211 CrossRef CAS.
- X. Nie, X. Jiang, H. Wang, W. Luo, M. J. Janik and Y. Chen, et al., Mechanistic Understanding of Alloy Effect and Water Promotion for Pd-Cu Bimetallic Catalysts in CO2 Hydrogenation to Methanol, ACS Catal., 2018, 8(6), 4873–4892 CrossRef CAS.
- Z. Liu, A. Rittermeier, M. Becker, K. Kähler, E. Löffler and M. Muhler, High-pressure CO adsorption on Cu-based catalysts: Zn-induced formation of strongly bound CO monitored by ATR-IR spectroscopy, Langmuir, 2011, 27(8), 4728–4733 CrossRef CAS.
- P. Biegger, A. H. Felder and M. Lehner, Methanisierung von CO2 als chemischer Energiespeicher, Proc 10th Minisymp Verfahrenstechnik, 2014, pp. 83–86 Search PubMed.
- H. Bahruji, M. Bowker, G. Hutchings, N. Dimitratos, P. Wells and E. Gibson, et al., Pd/ZnO catalysts for direct CO2 hydrogenation to methanol, J. Catal., 2016, 343, 133–146 CrossRef CAS.
- Z. Zhang, S. Cheng, W. Liu, B. Chen, X. Gao and P. Wang, et al., Unraveling the regulation of Mn in Cu-ZnOx formation during methanol synthesis from syngas over Cu/ZnO/Al2O3-Mn catalysts, Appl. Catal., B, 2023, 338, 122985 CrossRef CAS.
- T. Zou, T. P. Araújo, F. Krumeich, C. Mondelli and J. Pérez-Ramírez, ZnO-Promoted Inverse ZrO2-Cu Catalysts for CO2-Based Methanol Synthesis under Mild Conditions, ACS Sustain. Chem. Eng., 2022, 10(1), 81–90, DOI:10.1021/acssuschemeng.1c04751.
- C. Wang, Y. Fang, G. Liang, X. Lv, H. Duan and Y. Li, et al., Mechanistic study of Cu-Ni bimetallic catalysts supported by graphene derivatives for hydrogenation of CO2 to methanol, J. CO2 Util., 2021, 49, 101542 CrossRef CAS.
- J. Yu, M. Yang, J. Zhang, Q. Ge, A. Zimina and T. Pruessmann, et al., Stabilizing Cu+ in Cu/SiO2 catalysts with a shattuckite-like structure boosts CO2 hydrogenation into methanol, ACS Catal., 2020, 10(24), 14694–14706, DOI:10.1021/acscatal.0c04371.
- X. Dong, H. B. Zhang, G. D. Lin, Y. Z. Yuan and K. R. Tsai, Highly active CNT-promoted Cu-ZnO-Al2O3 catalyst for methanol synthesis from H2/CO/CO2, Catal. Lett., 2003, 85(3–4), 237–246, DOI:10.1023/A:1022158116871.
- L. Pandit, A. Boubnov, G. Behrendt, B. Mockenhaupt, C. Chowdhury and J. Jelic, et al., Unravelling the Zn-Cu Interaction during Activation of a Zn-promoted Cu/MgO Model Methanol Catalyst, ChemCatChem, 2021, 13(19), 4120–4132, DOI:10.1002/cctc.202100692.
- P. S. Murthy, W. Liang, Y. Jiang and J. Huang, Cu-Based Nanocatalysts for CO2 Hydrogenation to Methanol, Energy Fuels, 2021, 35(10), 8558–8584, DOI:10.1021/acs.energyfuels.1c00625.
- H. Bahruji, M. Bowker, G. Hutchings, N. Dimitratos, P. Wells and E. Gibson, et al., Pd/ZnO catalysts for direct CO2 hydrogenation to methanol, J. Catal., 2016, 343, 133–146 CrossRef CAS.
- M. Zabilskiy, V. L. Sushkevich, M. A. Newton, F. Krumeich, M. Nachtegaal and J. A. Bokhoven van, Mechanistic Study of Carbon Dioxide Hydrogenation over Pd/ZnO-Based Catalysts: The Role of Palladium–Zinc Alloy in Selective Methanol Synthesis, Angew. Chem., 2021, 133(31), 17190–17196, DOI:10.1002/ange.202103087.
- K. Siriworarat, V. Deerattrakul, P. Dittanet and P. Kongkachuichay, Production of methanol from carbon dioxide using palladium-copper-zinc loaded on MCM-41: Comparison of catalysts synthesized from flame spray pyrolysis and sol-gel method using silica source from rice husk ash, J. Cleaner Prod., 2017, 142, 1234–1243 CrossRef CAS.
- J. Díez-Ramírez, J. A. Díaz, P. Sánchez and F. Dorado, Optimization of the Pd/Cu ratio in Pd-Cu-Zn/SiC catalysts for the CO2 hydrogenation to methanol at atmospheric pressure, J. CO2 Util., 2017, 22, 71–80 CrossRef.
- N. Barrabes, D. Cornado, K. Föttinger, A. Dafinov, J. Llorca, F. Medina and G. Rupprechter, Hydrodechlorination of trichloroethylene on noble metal promoted Cu-hydrotalcite-derived catalysts, J. Catal., 2009, 263(2), 239–246 CrossRef CAS.
- B. T. Meshesha, N. Barrabés, F. Medina and J. E. Sueiras, Polyol mediated synthesis & characterization of Cu nanoparticles: Effect of 1-hexadecylamine as stabilizing agent. in 1st WSEAS International Conference on Nanotechnology, 2009, pp. 87–91 Search PubMed.
- B. T. Meshesha, N. Barrabés, J. Llorca, A. Dafinov, F. Medina and K. Föttinger, PdCu alloy nanoparticles on alumina as selective catalysts for trichloroethylene hydrodechlorination to ethylene, Appl. Catal., A, 2013, 453, 130–141 CrossRef CAS.
- J. L. Li and T. Inui, Characterization of precursors of methanol synthesis catalysts, copper/zinc/aluminum oxides, precipitated at different pHs and temperatures, Appl. Catal., A, 1996, 137(1), 105–117 CrossRef CAS.
- B. Eren, Z. Liu, D. Stacchiola, G. A. Somorjai and M. Salmeron, Structural Changes of Cu(110) and Cu(110)-(2 × 1)-O Surfaces under Carbon Monoxide in the Torr Pressure Range Studied with Scanning Tunneling Microscopy and Infrared Reflection Absorption Spectroscopy, J. Phys. Chem. C, 2016, 120(15), 8227–8231, DOI:10.1021/acs.jpcc.6b02143.
- T. Qiu, J. G. Yang, X. J. Bai and Y. L. Wang, The preparation of synthetic graphite materials with hierarchical pores from lignite by one-step impregnation and their characterization as dye absorbents, RSC Adv., 2019, 9(22), 12737–12746 RSC , https://pubs.rsc.org/en/content/articlehtml/2019/ra/c9ra00343f.
- M. Mauro, V. Cipolletti, M. Galimberti, P. Longo and G. Guerra, Chemically reduced graphite oxide with improved shape anisotropy, J. Phys. Chem. C, 2012, 116(46), 24809–24813, DOI:10.1021/jp307112k.
- J. B. Lopes Martins, E. Longo, O. D. Rodríguez Salmon, V. A. A. Espinoza and C. A. Taft, The interaction of H2, CO, CO2, H2O and NH3 on ZnO surfaces: An Oniom Study, Chem. Phys. Lett., 2004, 400(4–6), 481–486 CrossRef.
- C. Rameshan, W. Stadlmayr, C. Weilach, S. Penner, H. Lorenz and M. Hävecker, et al., Subsurface-Controlled CO2 Selectivity of PdZn Near-Surface Alloys in H2 Generation by Methanol Steam Reforming, Angew. Chem., Int. Ed., 2010, 49(18), 3224–3227, DOI:10.1002/anie.200905815.
- C. Weilach, S. M. Kozlov, H. H. Holzapfel, K. Föttinger, K. M. Neyman and G. Rupprechter, Geometric arrangement of components in bimetallic PdZn/Pd(111) surfaces modified by CO adsorption: A combined study by density functional calculations, polarization-modulated infrared reflection absorption spectroscopy, and temperature-programmed desorption, J. Phys. Chem. C, 2012, 116(35), 18768–18778, DOI:10.1021/jp304556s.
- H. H. Holzapfel, A. Wolfbeisser, C. Rameshan, C. Weilach and G. Rupprechter, PdZn surface alloys as models of methanol steam reforming catalysts: Molecular studies by LEED, XPS, TPD and PM-IRAS, Top. Catal., 2014, 57(14), 1218–1228, DOI:10.1007/s11244-014-0295-3.
- V. H. Sandoval and C. E. Gigola, Characterization of Pd and Pd-Pb/α-Al2O3 catalysts. A TPR-TPD study, Appl. Catal., A, 1996, 148(1), 81–96 CrossRef CAS.
- P. A. Redhead, Thermal desorption of gases, Vacuum, 1962, 12(4), 203–211 CrossRef CAS.
- H. Chen, H. Cui, Y. Lv, P. Liu, F. Hao and W. Xiong, et al., CO2 hydrogenation to methanol over Cu/ZnO/ZrO2 catalysts: Effects of ZnO morphology and oxygen vacancy, Fuel, 2022, 314, 123035 CrossRef CAS.
- H. V. Thang and G. Pacchioni, Oxygen Vacancy in Wurtzite ZnO and Metal-Supported ZnO/M(111) Bilayer Films (M = Cu, Ag and Au), J. Phys. Chem. C, 2018, 122(36), 20880–20887, DOI:10.1021/acs.jpcc.8b06474.
- S. M. Fehr, K. Nguyen and I. Krossing, Realistic Operando-DRIFTS Studies on Cu/ZnO Catalysts for CO2 Hydrogenation to Methanol – Direct Observation of Mono-ionized Defect Sites and Implications for Reaction Intermediates, ChemCatChem, 2022, 14(3), e202101500, DOI:10.1002/cctc.202101500.
- K. M. Johansen, F. Tuomisto, I. Makkonen and L. Vines, Formation of Zn- and O- vacancy clusters in ZnO through deuterium annealing, Mater. Sci. Semicond. Process., 2017, 69, 23–27 CrossRef CAS.
- X. Wei, W. Su, Y. Shi, J. Wang, P. Lv and X. Song, et al., Cu0 at the Cu/ZnO interface efficiently accelerate CO2 hydrogenation to methanol over Cu/ZnO/C–P catalysts, Int. J. Hydrogen Energy, 2024, 58, 128–136 CrossRef CAS.
- L. Zhao, L. Zhang, Z. Wu, C. Huang, K. Chen and H. Wang, et al., Size Effect of Cu Particles on Interface Formation in Cu/ZnO Catalysts for Methanol Synthesis, Catalysts, 2023, 13(8), 1190 CrossRef CAS , https://www.mdpi.com/2073-4344/13/8/1190/htm.
- B. Rahmatmand, M. R. Rahimpour and P. Keshavarz, Introducing a novel process to enhance the syngas conversion to methanol over Cu/ZnO/Al2O3 catalyst, Fuel Process. Technol., 2019, 193, 159–179 CrossRef CAS.
- H. Lei, R. Nie, G. Wu and Z. Hou, Hydrogenation of CO2 to CH3OH over Cu/ZnO catalysts with different ZnO morphology, Fuel, 2015, 154, 161–166 CrossRef CAS.
- C. Han, Y. Gao, L. Qin, Y. Cao, S. Wang and J. Li, Modulating electronic structure and exposed surface area of Cu-based catalysts by Pd doping for enhanced CO2 hydrogenation to methanol, Sep. Purif. Technol., 2025, 354, 128852 CrossRef CAS.
- K. P. Reddy, D. Kim, S. Hong, K. J. Kim, R. Ryoo and J. Y. Park, Tuning CO2 Hydrogenation Selectivity through Reaction-Driven Restructuring on Cu-Ni Bimetal Catalysts, ACS Appl. Mater. Interfaces, 2022, 15(7), 9373–9381, DOI:10.1021/acsami.2c20832.
- K. Föttinger, R. Schlögl and G. Rupprechter, The mechanism of carbonate formation on Pd–Al2O3 catalysts, Chem. Commun., 2008, 3(3), 320–322 RSC.
- X. K. Wu, G. J. Xia, Z. Huang, D. K. Rai, H. Zhao and J. Zhang, et al., Mechanistic insight into the catalytically active phase of CO2 hydrogenation on Cu/ZnO catalyst, Appl. Surf. Sci., 2020, 525, 146481 CrossRef CAS.
- J. Xu, X. Su, X. Liu, X. Pan, G. Pei and Y. Huang, et al., Methanol synthesis from CO2 and H2 over Pd/ZnO/Al2O3: Catalyst structure dependence of methanol selectivity, Appl. Catal., A, 2016, 514, 51–59 CrossRef CAS.
- M. Zabilskiy, V. L. Sushkevich, D. Palagin, M. A. Newton, F. Krumeich and J. A. van Bokhoven, The unique interplay between copper and zinc during catalytic carbon dioxide hydrogenation to methanol, Nat. Commun., 2020, 11(1), 1–8 CrossRef , https://www.nature.com/articles/s41467-020-16342-1.
- O. A. Ojelade, S. F. Zaman, M. A. Daous, A. A. Al-Zahrani, A. S. Malik and H. Driss, et al., Optimizing Pd:Zn molar ratio in PdZn/CeO2 for CO2 hydrogenation to methanol, Appl. Catal., A, 2019, 584, 117185 CrossRef CAS.
- N. J. Azhari, D. Erika, S. Mardiana, T. Ilmi, M. L. Gunawan and I. G. B. N. Makertihartha, et al., Methanol synthesis from CO2: A mechanistic overview, Results Eng., 2022, 16, 100711 CrossRef CAS.
- L. C. Grabow and M. Mavrikakis, Mechanism of methanol synthesis on cu through CO2 and CO hydrogenation, ACS Catal., 2011, 1(4), 365–384, DOI:10.1021/cs200055d.
- A. Mravak, S. Vajda and V. Bonačić-Koutecký, Mechanism of Catalytic CO2 Hydrogenation to Methane and Methanol Using a Bimetallic Cu3Pd Cluster at a Zirconia Support, J. Phys. Chem. C, 2022, 126(43), 18306–18312, DOI:10.1021/acs.jpcc.2c04921.
Footnotes |
| † Electronic supplementary information (ESI) available: Fig. S1 to S17, Tables S1 to S2 and Supplementary Note 1. See DOI: https://doi.org/10.1039/d4su00339j |
| ‡ These authors contributed equally. |
| This journal is © The Royal Society of Chemistry 2024 |