Synthesis and soft crystal structure-induced broad emission of (NH3C6H12NH3)InBr5·2H2O†
Shuva
Biswas‡
a,
Arnab
Mandal‡
a,
Diptikanta
Swain
 b and
Kanishka
Biswas
 *a
*a
aNew Chemistry Unit, International Centre for Materials Science and School of Advanced Materials, Jawaharlal Nehru Centre for Advanced Scientific Research (JNCASR), Jakkur P. O., Bangalore 560064, India. E-mail: kanishka@jncasr.ac.in
bInstitute of Chemical Technology-IndianOil Odisha Campus, Bhubaneswar 751013, India
First published on 6th June 2024
Abstract
We report a simple synthesis of a new lead-free zero-dimensional (0D) hybrid halide compound, (5P1)InBr5·2H2O [(5P1) = NH3C6H12NH3], which hosts isolated and distorted octahedra of [InBr5(H2O)]2−, surrounded by bulky asymmetric organic cations [(5P1)2+] and H2O molecules. The hybrid crystals exhibit broad self trapped excitonic (STE) emission due to strong anharmonic soft structure.
Three-dimensional (3D) lead (Pb) halide perovskites have achieved remarkable advances in solar cells and other optoelectronic applications in recent years.1–3 However, the stability issues of 3D perovskite halides and toxicity due to presence of Pb have limited their practical applications.4 Therefore, low-dimensional Pb-free organic–inorganic hybrid halides have become a propitious alternative as a relatively stable luminescent material.5,6 Reducing dimensionality by disconnecting metal halide octahedra progressively softens the crystal lattice.7 For instance, zero-dimensional (0D) organic–inorganic hybrid halides possess localized polyhedra, making the lattice remarkably soft.8 Significant anharmonicity of a soft lattice, coupled with strong electron–phonon coupling, often leads to the formation of self-trapped excitonic (STE) state through transient local lattice distortion upon photoexcitation.9–11 Furthermore, in 0D metal halides, emission from the STE state is solely dependent on the inorganic luminescent building block.10,12
0D hybrid halides are generally classified based on the s2, d5 and d10 electronic configurations of their central metal cation.6 The stereochemical expression of the ns2 lone pair in the central cation (Pb2+, Sn2+, Bi3+, Sb3+etc.) prompts the polyhedral distortion to occur within the structure.13 For example, a recent report on a Bi/Sb-based halide, namely (C8NH12)4Bi0.57Sb0.43Br7·H2O with distorted polyhedra, showcases a broadband STE emission ranging from 400 to 850 nm.14 Conversely, d5 metal cation (e.g. Mn2+) based 0D hybrid halides are known for their typical narrow band emission.15 However, (C4H9NH3)2MnI4 shows dual-emissive PL having emission peaks with different intensities.16 0D hybrid halides with d10 metal systems (Ag+ and Cu+) are also a fascinating class of luminescent hybrid halides due to their multiple excited states and diverse structural topologies.17,18 More recently, there have been reports of stable indium (In)-based 0D halides, such as all-inorganic Cs2InBr5·H2O,19 hybrid (C4H14N2)2In2Br10.20 and (PMA)3InBr6,21 that demonstrate promising luminescence properties. Moreover, recent report shows Sb3+ doping into all-inorganic Cs2InBr5·H2O leads to further increament of bright emissions.22,23
Herein, we have synthesized a new 0D organic–inorganic hybrid halide, (5P1)InBr5·2H2O (5P1 = 1,5-diammonium-2-methylpentane), utilizing a simple acid precipitation technique. This halide showcases a temperature-dependent structural phase transition and broad STE emission. Strong electron–phonon coupling within the lattice, as validated from temperature-dependent PL studies, explains the underlying mechanism of the broad and intense STE emission. Furthermore, Raman spectroscopy and low-temperature heat capacity (Cp) measurement unveil the existence of low-energy optical phonon modes, suggesting the presence of a soft lattice. Sound velocity measurement implies low values of elastic moduli, indicating extreme softness of the 0D hybrid halide lattice and strong anharmonicity. Strong electron–phonon coupling originating from the soft lattice and anharmonicity trigger broad STE emission from (5P1)InBr5·2H2O.
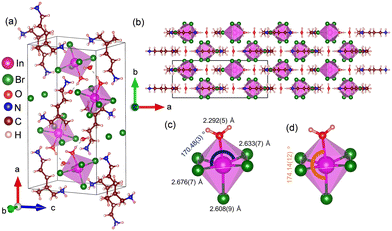
(5P1)InBr5·2H2O was synthesized using the acid precipitation method by dissolving precursors (metal salt and organic ligand) in HCl with heat treatment to obtain a clear saturated solution. The resulting solution was allowed to cool down slowly for the formation of colourless single crystals (Methods section, ESI†). The hybrid halide compound crystallizes in an orthorhombic system (space group Pnma) at room temperature with lattice parameters a = 20.264(3) Å, b = 7.9353(11) Å, c = 11.0226(13) Å and α = β = γ = 90° (Table S1, ESI† and Fig. 1), as determined using single-crystal X-ray diffraction (SCXRD). As illustrated in Fig. 1a and b, (5P1)InBr5·2H2O consists of isolated [InBr5(H2O)]2− inorganic octahedral units, which are well separated from each other by large (5P1)2+ organic cations and lattice H2O molecules, forming a typical 0D hybrid halide structure. The long distance of 7.85(8) Å between two nearest octahedral units eliminates the possibility of any electronic interaction between them. Each lattice H2O interacts with the coordinated H2O of an [InBr5(H2O)]2− octahedron through hydrogen bonding (H-bonding) interactions having O–H⋯O distance of around 1.72 Å. N–H⋯Br hydrogen bond lengths (2.73 to 2.84 Å) also indicate an interaction between organic and inorganic sublattices (Fig. S1a and Table S2, ESI†). Isolated octahedra are distorted due to indium (In) atoms each being off-centered, arising from shorter In–O bond lengths [2.292(5) Å] compared to that of In–Br bonds [2.608(9)–2.676(7) Å] (Fig. 1c and d). Owing to the distortion, equatorial ∠Br–In–Br [170.48(3)°] and axial ∠Br–In–O [174.14(12)°] deviate from the ideal value of 180° (Fig. 1c and d).
Measurements of Cp as a function of temperature at low temperatures and SCXRD refinement at 127 K (Fig. S2, ESI†) indicate that (5P1)InBr5·2H2O undergoes a structural phase transition from orthorhombic Pnma to monoclinic P21/n at around 247 K (Fig. S2 and Table S1, ESI†), which is further confirmed by a low-temperature PXRD analysis (Fig. S3a, ESI†). The H-bond length also varies with the change in temperature (Fig. S1b and Table S2, ESI†). The octahedral distortion throughout the temperature range is plausibly arising from the coordination of H2O molecule with Indium (In) center within the [InBr5(H2O)]2− octahedron (Fig. 1 and Fig. S2a and b, ESI†). The degrees of distortion of [InBr5(H2O)]2− octahedra were calculated from two elongation factors, which define the extent of variations in bond length and bond angle, respectively (eqn (S1) and (S2), ESI†).24 The relatively high values of these factors for room-temperature and low-temperature structures of (5P1)InBr5·2H2O indicate a high degree of distortion in the compound (Table S3, ESI†). Fig. S4a of ESI† presents the powder X-ray diffraction (PXRD) pattern of (5P1)InBr5·2H2O at room temperature, which matches the simulated pattern from SCXRD analysis, suggesting phase purity. The ambient stability of (5P1)InBr5·2H2O was affirmed by analysing PXRD patterns of as-synthesized samples and those aged for a few days (Fig. S3b, ESI†). Thermogravimetric analysis (TGA) data, provided in Fig. S4b of ESI,† show an ∼5% drop in weight at 73 °C followed by decomposition starting at around 300 °C. The initial weight loss at 73 °C corresponds to the loss of coordinated and lattice H2O molecules. X-Ray photoelectron spectroscopy (XPS) data at In 3d and Br 3d levels reveal the presence of +3 and −1 as the only oxidation states for In and Br, respectively (Fig. S5a and b, ESI†). Field emission scanning electron microscopy (FESEM) analysis ensures the composition and elemental homogeneity of (5P1)InBr5·2H2O (Fig. S6 and S7 ESI†).
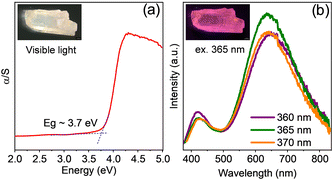
Optical property investigations of (5P1)InBr5·2H2O, carried out by taking UV-visible diffuse reflectance and PL spectroscopy measurements, show an optical bandgap of ∼3.7 eV (Fig. 2a). The PL spectrum acquired at room temperature depicts the existence of two emission peaks, centred at 423 and 637 nm (see Fig. 2b), termed as fundamental emission (FE) and self-trapped excitonic (STE) emission, respectively. The wavelengths of both the emissions are independent of excitation wavelength (λex) although the intensities of the peaks reached a maximum at λex of ∼365 nm. The bulk crystal emits bright pink light (inset, Fig. 2b and Fig. S8a, ESI†) under 365 nm UV radiation. The peak maximum at ∼363 nm in the photoluminescence excitation (PLE) spectrum (Fig. S8b, ESI†) matches the λex corresponding to the maximum-intensity emission peak. (5P1)InBr5·2H2O demonstrates a promising photoluminescence quantum yield (PLQY) of 21.4% under 365 nm excitation at room temperature.
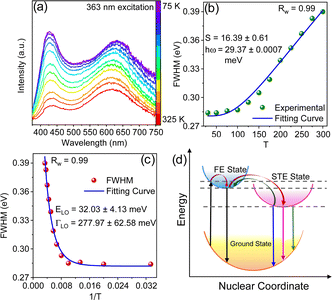
Temperature-dependent (75–325 K) PL experiment was conducted to explore the underlying mechanism for the broad emission of (5P1)InBr5·2H2O. The low-temperature PL spectra reveal the presence of two emission peaks (FE and STE) at different ranges of wavelengths, with descending peak intensities upon increasing temperature as depicted in Fig. 3a. This relationship between peak intensity and temperature is attributed to the enhancement of nonradiative recombination and coupling with phonons. The STE peak undergoes a blue shift with increasing temperature up to ∼ 250 K followed by a slight red shift with further increase in temperature (Fig. S9a, ESI†). The peak shift of the STE emission with temperature can be elucidated with eqn (S4), ESI,† by considering the competing effects of thermal expansion (ATE) and electron–phonon interactions (AEP). The predominant contribution of thermal expansion results in a gradual blue shift of the PL peak position with increasing temperature up to 250 K and subsequently a lowering of peak energy with further increase in temperature due to the dominance of electron–phonon interactions. To gain better insight, temperature-dependent PL results were subjected to fitting to obtain physical parameters including the exciton binding energy (Eb), Huang–Rhys factor (S) and electron–phonon coupling coefficient. Fitting the plot in Fig. S9b (ESI†), with the following equation.25
 | (1) |
 | (2) |
To gain a comprehensive understanding of individual phonon contribution to the significant electron–phonon coupling, a plot of FWHM vs. 1/T of the STE peak was fitted using the Rudin model as shown in the following equation28
 | (3) |
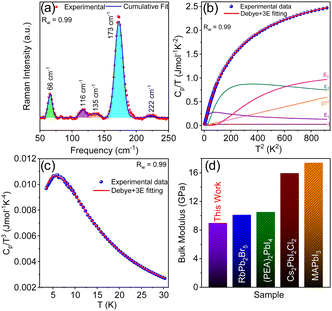
STE emission is a consequence of transient lattice distortion upon photoexcitation, where the excitation-induced lattice deformation typically evolves from the soft crystal structure. (5P1)InBr5·2H2O possesses an exceedingly soft structure and substantial electron–phonon coupling. The low-frequency Raman modes (66, 116, 135, 173 and 222 cm−1) of (5P1)InBr5·2H2O (Fig. 4a) are attributed to low-energy optical phonon modes (non-correlated vibrations of weakly bonded atoms), which are directly contributing to form the soft lattice. Furthermore, low temperature (2–30 K) heat capacity (Cp) measurement provides additional insight into the lattice dynamics of (5P1)InBr5·2H2O, which indicates that the measured temperature variation of Cp (Fig. 4b) can be precisely described by incorporating three Einstein oscillator modes in the Debye–Einstein model (eqn S5, ESI†).29 These modes have characteristic temperatures of ΘE1 = 23 K (∼16 cm−1), ΘE2 = 49 K (∼34 cm−1), and ΘE3 = 99 K (∼68 cm−1) (Table S4, ESI†). Of these Einstein modes, ΘE3 (∼68 cm−1) matches well with one of the low-frequency Raman modes (∼66 cm−1). The plot of Cp/T3vs. T (Fig. 4c) exhibits a boson-like peak at ∼7 K, suggesting the presence of excess low-energy optical phonon density of states.
 | ||
| Fig. 4 (a) Room-temperature Raman spectrum of (5P1)InBr5·2H2O. (b) Debye–Einstein fit of a plot of Cp/T vs. T2 for (5P1)InBr5·2H2O with individual contributions from Debye (β), electronic (γ), and three Einstein modes (E1, E2 and E3). (c) Plot of Cp/T3vs. T, showing a boson-like peak feature at 7 K, fitted by a combined Debye–Einstein model. (d) Comparison of bulk modulus (B) of (5P1)InBr5·2H2O with those of other hybrid and all-inorganic metal halides, namely RbPb2Br5,11 (PEA)2PbI4,30 Cs2PbI2Cl2,31 and MAPbI3.30 | ||
The 0D hybrid halide, due to its chemical bonding hierarchy (Fig. 1 and Fig. S2, ESI†), displays a significant amount of anharmonicity, which endows the lattice with substantial softness. A high Grüneisen parameter (γ) (measure of anharmonicity) value of 2.25, calculated from eqn (S7) of ESI† using experimental sound velocity data, attests to strong anharmonicity in the lattice. Our measurements show transverse (νt) and longitudinal (νt) sound velocities of 1035 and 2237 ms−1 respectively, and a mean sound velocity estimated to be 1166 ms−1, which is remarkably low. The extent of softness of the crystal is characterized from bulk modulus (B) and shear modulus (G), estimated from sound velocity values (see Methods section, ESI†).11 Our measurements show values of G and B much lower than those of all-inorganic and other hybrid halide systems (Fig. 4d and Fig. S10, ESI†).11,30,31 The low value of the Debye temperature, ΘD (146 K), calculated from sound velocity measurement nearly matches the ΘD (138 K) obtained from Debye–Einstein fitting of Cp data (Fig. 4b). The low ΘD provides concrete proof of softness in this 0D hybrid lattice of (5P1)InBr5·2H2O, which facilitates STE emissions upon photoexcitation.
In summary, we have synthesized a new 0D hybrid halide, (5P1)InBr5·2H2O, which displays bright pink emission due to the presence of broad STE as well as band-to-band emission peaks. The origin of the STE emission was attributed to the softness of the crystal structure, mediated by distortion-induced large anharmonicity. Low-energy optical phonon modes, tracked with Raman spectroscopy and low-temperature heat capacity measurement, confirm the presence of low-frequency vibration of weakly bonded atoms, resulting in low values of elastic moduli for the compound. Furthermore, PL measurements taken at various temperatures reveal elevated electron–phonon coupling of the soft lattice, ultimately promoting STE emission upon photoexcitation.
K. B. acknowledges support from the Swarna-Jayanti fellowship, Science and Engineering Research Board (SERB) (SB/SJF/2019-20/06), DST, India. SB acknowledges JNCASR for fellowship support. A. M. acknowledges the support from SERB National Postdoctoral Fellowship (PDF/2023/001396). KB acknowledges Abhishake Mondal, IISc for low-temperature PXRD measurement.
Data availability
The data supporting this article have been included as part of the ESI.†Conflicts of interest
There are no conflicts to declare.Notes and references
- NREL. Best Research-Cell Efficiency Chart, Photovoltaic Research, NREL; 2021. Available at: https://www.nrel.gov/pv/cell-efficiency.html.
- M. V. Kovalenko, et al. , Science, 2017, 358, 745–750 CrossRef CAS PubMed.
- Y. Bekenstein, et al. , J. Am. Chem. Soc., 2015, 137, 16008–16011 CrossRef CAS PubMed.
- Q. A. Akkerman, et al. , Nat. Mater., 2018, 17, 394–405 CrossRef CAS PubMed.
- W. Ning and F. Gao, Adv. Mater., 2019, 31, 1900326 CrossRef PubMed.
- M. Li and Z. Xia, Chem. Soc. Rev., 2021, 50, 2626–2662 RSC.
- P. Acharyya, et al. , Nat. Commun., 2022, 13, 5053 CrossRef CAS PubMed.
- L. Zhou, et al. , Adv. Opt. Mater., 2021, 9, 2100544 CrossRef CAS.
- J. E. Thomaz, et al. , J. Am. Chem. Soc., 2020, 142, 16622–16631 CrossRef CAS PubMed.
- B. M. Benin, et al. , Angew. Chem., Int. Ed., 2018, 57, 11329–11333 CrossRef CAS PubMed.
- J. Pradhan, et al. , Chem. Sci., 2022, 13, 9952–9959 RSC.
- V. Morad, et al. , J. Am. Chem. Soc., 2019, 141, 9764–9768 CrossRef CAS PubMed.
- I. Maria, et al. , J. Am. Chem. Soc., 2023, 145, 9292–9303 CrossRef CAS PubMed.
- R. Zhang, et al. , Angew. Chem., Int. Ed., 2019, 58, 2725–2729 CrossRef CAS PubMed.
- L.-J. Xu, et al. , Nat. Commun., 2020, 11, 4329 CrossRef CAS PubMed.
- X. Jiang, et al. , ChemSusChem, 2019, 12, 5228–5232 CrossRef CAS PubMed.
- X. Yuan, et al. , Nanoscale, 2012, 4, 1968–1971 RSC.
- J. Dědeček and B. Wichterlová, Phys. Chem. Chem. Phys., 1999, 1, 629–637 RSC.
- L. Zhou, et al. , Angew. Chem., Int. Ed., 2019, 58, 5277–5281 CrossRef CAS PubMed.
- L. Zhou, et al. , Angew. Chem., Int. Ed., 2019, 58, 15435–15440 CrossRef CAS PubMed.
- D. Chen, et al. , Inorg. Chem., 2019, 58, 15602–15609 CrossRef CAS PubMed.
- A. S. Kshirsagar, et al. , J. Phys. Chem. C, 2021, 125, 27671–27677 CrossRef CAS.
- Y. Jing, et al. , Chem. Mater., 2020, 32, 5327–5334 CrossRef CAS.
- A. Mandal, et al. , Chem. Sci., 2023, 14, 9770–9779 RSC.
- A. Mandal, et al. , J. Phys. Chem. Lett., 2022, 13, 9103–9113 CrossRef CAS PubMed.
- H. Yang, et al. , Chem. Mater., 2017, 29, 8978–8982 CrossRef CAS.
- M. Baranowski and P. Plochocka, Adv. Energy Mater., 2020, 10, 1903659 CrossRef CAS.
- S. Rudin, et al. , Phys. Rev. B: Condens. Matter Mater. Phys., 1990, 42, 11218–11231 CrossRef CAS PubMed.
- J. Pradhan, et al. , Chem. Mater., 2024, 36, 3405–3416 CrossRef CAS.
- S. Rathore, et al. , J. Alloys Compd., 2023, 936, 168328 CrossRef CAS.
- P. Acharyya, et al. , J. Am. Chem. Soc., 2020, 142, 15595–15603 CrossRef CAS PubMed.
Footnotes |
| † Electronic supplementary information (ESI) available. CCDC2348109 and 2348112. For ESI and crystallographic data in CIF or other electronic format see DOI: https://doi.org/10.1039/d4cc01822b |
| ‡ S. B. and A. M. contributed equally. |
| This journal is © The Royal Society of Chemistry 2024 |


