A surface-enhanced electrochemiluminescence sensor based on Au-SiO2 core–shell nanocomposites doped with Ru(bpy)32+ for the ultrasensitive detection of prostate-specific antigen in human serum
Daifang
Wang
a,
Jin
Zhou
a,
Longhua
Guo
 *b,
Bin
Qiu
 c and
Zhenyu
Lin
 *c
*c
aFujian Vocational College of Bioengineering, Fuzhou, Fujian Province 350002, China
bCollege of Biological, Chemical Sciences and Engineering, Jiaxing University, Jiaxing, 314001, Zhejiang Province, China. E-mail: guolh@fzu.edu.cn; Fax: +86 59122866135; Tel: +86 59122866141
cMinistry of Education Key Laboratory for Analytical Science of Food Safety and Biology, Fujian Provincial Key Laboratory of Analysis and Detection for Food Safety, College of Chemistry, Fuzhou University, Fuzhou, Fujian Province 350116, China. E-mail: zylin@fzu.edu.cn
First published on 6th November 2019
Abstract
This study reports a surface-enhanced electrochemiluminescence (SEECL) sensor for the ultrasensitive detection of prostate-specific antigen (PSA) in human serum. First, we prepared the Au-SiO2 core–shell nanocomposites doped with Ru(bpy)32+ (Au@SiO2-Ru) as the ECL signal generation and amplification element of the SEECL sensor. Ru(bpy)32+ could emit ECL under the excitation of an electrochemical reaction, and generate the local surface plasmon resonance (LSPR) electromagnetic field from the gold nanoparticle (AuNP) core. The produced LSPR then effectively enhanced the ECL signals. This sensing strategy was utilized for the detection of PSA, which can be absorbed on the electrode surface by the reaction between PSA and monoclonal antibodies. When polyclonal antibody-modified Au@SiO2-Ru was added, the PSA-double-antibody sandwich structure was formed on the electrode surface and thus, the Au@SiO2-Ru were quantitatively immobilized on the electrode surface. The results show that this kind of SEECL sensor has good selectivity toward PSA. Notably, the minimum detection concentration reached 7 × 10⁻⁷ ng mL−1 under the optimum experimental conditions, which is much better than most of the previously reported approaches for the detection of PSA in serum.
1. Introduction
With the increasing attention of human beings to their own diseases, rapid and sensitive clinical diagnosis techniques are required. Currently, traditional electrochemiluminescence (ECL) technology is unable to detect trace amounts of biomolecules. Therefore, the development of a reliable and high-sensitivity ECL biosensor is the main research focus for the ECL technique in clinical diagnosis.1,2 At present, various ECL biosensors have been reported. Some were prepared by using biomolecules as the media for quantitatively controlling the ECL reagent or co-reactants on the electrode surface.3,4 Other ECL biosensors were achieved by the interaction between the target biomolecules and the co-reactants of the ECL reagent.5–7Regardless of the method chosen for preparing ECL biosensors, the improvement of the sensitivity of the ECL biosensor is a key point for application. In order to improve the sensitivity of the ECL biosensor, many researchers have used metal nanomaterials as signal amplification elements. These studies mainly focused on the superior surface effect enrichment and the electrochemical activity of metallic nanomaterials,8–11 but only a few sensors were designed based on the local surface plasmon resonance (LSPR) enhancement effect of noble metal nanomaterials.12–14 In our previous study,15 we found that the LSPR of gold nanoparticles can effectively enhance the ECL emission of Ru(bpy)32+, and the concept of surface-enhanced electrochemiluminescence (SEECL) was put forward for the first time. We then successfully fabricated a SEECL biosensor for CEA detection.16 The results showed that this kind of SEECL biosensor has an ultra-sensitive response to CEA levels.
In this work, we designed a novel strategy for the ultra-sensitive detection of prostate-specific antigen (PSA) in serum based on SEECL. PSA is an acidic glycoprotein secreted by prostatic epithelial cells.17–19 Its content in serum is often used for the diagnosis of prostate cancer and its related diseases.20,21 Increased levels of PSA in serum indicate an increased risk of prostate-related diseases in men,22,23 and changes in serum PSA levels can also reflect the therapeutic effect of prostate cancer patients, which requires the high sensitivity detection of PSA.24–26
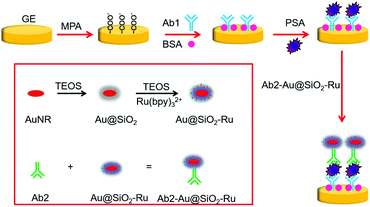
The principle of the proposed SEECL sensor is shown in Scheme 1. Firstly, we synthesized the Au-SiO2 core–shell composite nano-materials doped with Ru(bpy)32+ (Au@SiO2-Ru), and modified polyclonal antibody (Ab2) on the surface of Au@SiO2-Ru for specifically recognizing PSA. At the same time, we modified monoclonal antibodies (Ab1) on the surface of the gold electrode. In the presence of PSA, the double-antibody sandwich structure was formed by the immune reaction between PSA and the antibodies, so that the Au@SiO2-Ru could be quantitatively immobilized on the electrode surface. As we previously reported,15 the Au@SiO2-Ru composite nanomaterials not only retained the ECL activity of Ru(bpy)32+ to generate signals in ECL testing, but also had the LSPR effect of the gold nucleus to enhance the ECL signal. Therefore, the Au@SiO2-Ru composite nanomaterials combine the functions of signal generation and amplification, which greatly improve the sensitivity of the SEECL sensor. As a result, the ultra-sensitive detection of PSA is achieved.
2. Materials and methods
2.1. Apparatus and reagents
The UV-vis absorption spectra were obtained on a Shimadzu UV-3600 UV-vis-NIR photo spectrometer (PerkinElmer Co., USA). The ECL measurements were recorded by an ultra-weak luminescence analyzer (BPCL-1-TIC) at room temperature, with 1000 V voltage of the PMT. A CHI 660D electrochemical workstation (Shanghai CHI instruments Co., China) was used for recording the electrochemical measurements. All experiments were carried out with a conventional three-electrode system: a Pt wire served as the counter electrode, a Ag/AgCl electrode was used as the reference electrode, and the working electrode was the modified gold electrode (GE, ϕ = 2 mm).PSA antigen standard samples and their antibodies are products of Abnova Biotech Co., Ltd. Prostate-specific antigen standard protein (No. KLK3 human recombinant protein) was dissolved in 0.05 M pH 8.0 Tris-HCl buffer solution containing 10 mM reduced glutathione. KLK3 mouse monoclonal antibody (Ab1) and rabbit-derived polyclonal antibody (Ab2) of KLK3 were prepared with 0.01 M pH 7.4 PBS buffer solution. The antigen and antibody reserves were stored in the refrigerator at 4 °C. Bovine serum albumin (BSA), thrombin, trypsin and lysozyme were purchased from Shanghai Bioengineering Technology Co. Ltd. Tris(2,2′-bipyridyl) dichlororuthenium(II) hexahydrate (Ru(bpy)3Cl2·6H2O) was purchased from Sigma-Aldrich. Hydrogen tetrachloroaurate tetrahydrate (HAuCl4·4H2O), and cetyltrimethyl ammonium bromide (CTAB), tri-n-propylamine (TPrA), L-ascorbic acid (VC) and other reactants were obtained from Sinopharm Chemical Reagent Co. Ltd (Shanghai, China). All reagents were of analytical grade and were used as received. Millipore ultrapure water (resistivity >18.2 MΩ cm) was used throughout the experiment.
2.2. Preparation of AuNR
2.3. Preparation of Ab2-Au@SiO2-Ru
![[thin space (1/6-em)]](https://www.rsc.org/images/entities/char_2009.gif) :
:![[thin space (1/6-em)]](https://www.rsc.org/images/entities/char_2009.gif) 1000 Ab2-PBS solution at 4 °C for 24 hours in a dark place. After centrifugation (5000 rpm, 5 min), the supernatant Ab2 was removed, and the deposits were dissolved in 200 μL of 0.01 M pH 7.4 PBS buffer solution. The Ab2-Au@SiO2-Ru should be stored at 4 °C in a refrigerator.
1000 Ab2-PBS solution at 4 °C for 24 hours in a dark place. After centrifugation (5000 rpm, 5 min), the supernatant Ab2 was removed, and the deposits were dissolved in 200 μL of 0.01 M pH 7.4 PBS buffer solution. The Ab2-Au@SiO2-Ru should be stored at 4 °C in a refrigerator.
2.4. Fabrication of the SEECL sensor
2.5. ECL detection
A 5.0 mL cylinder quartz beaker was used as a reaction tank and the modified electrode was dipped into 1 mM TPA 0.1 M pH 7.4 PBS solution for ECL testing. The potential range was −0.5 V to 1.5 V with the sweep rate of 0.1 V s−1.3. Results and discussion
3.1. LSPR of AuNR
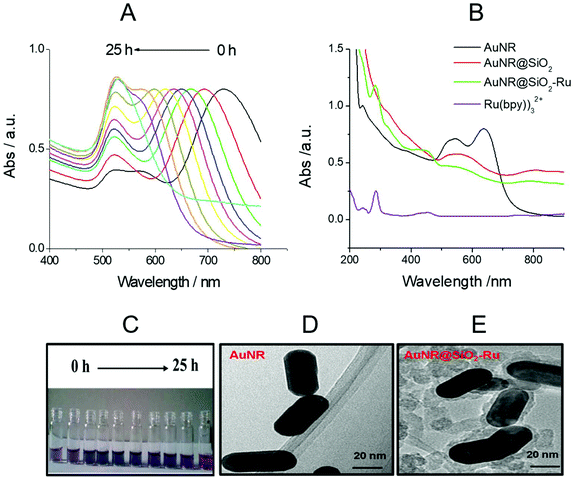
LSPR is a unique optical physical phenomenon of precious metal nanomaterials, which can be investigated by UV-vis absorption spectra. The AuNR have transverse and longitudinal LSPR absorption peaks. In general, the transverse LSPR absorption peaks are located at about 520 nm, while the longitudinal LSPR absorption peaks vary in the wavelength range from 520 nm to 1000 nm with different length-diameter ratios of AuNR.28 With the increase in oil bath time and the oxidation degree of AuNR growth solution added, the longitudinal LSPR absorption peak gradually shifted from 750 nm to 520 nm (as shown in Fig. 1(A)). The corresponding solution color also gradually changed from brown to pink (as shown in Fig. 1(C)).As shown in Fig. 1(B), as the interface environment of the precious metal nano-materials changed, the LSRP absorption peak also changed accordingly.29 The surface refractive index of AuNR became larger and the LSPR absorption peak obviously red-shifted after coating with SiO2. The spectrum of Ru(bpy)32+ (with the concentration is 2.0 μM) is displayed in Fig. 1(B). There were two characteristic absorption peaks of Ru(bpy)32+ at 280 nm and 460 nm,30 respectively, and the same two absorption peaks also appeared in the spectrum of Au@SiO2-Ru (green curve in Fig. 1(B)), indicating the existence of Ru(bpy)32+ in Au@SiO2-Ru. Moreover, the TEM diagrams (see Fig. 1(D) and (E)) further illustrated that the surface of the AuNR was successfully coated with a 8 nm thick layer of SiO2.
3.2. Characterization of modified electrodes
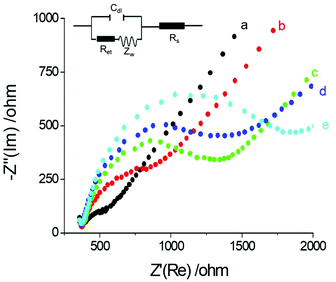
Electrochemical Impedance spectroscopy (EIS) is an effective interfacial analysis technique for studying the features of electrode surfaces modified with bio-molecules.31–34 Nyquist plots of EIS with different electrode modifications are displayed in Fig. 2. The semicircle diameter obtained from the Nyquist plots of EIS represents the interfacial resistance at the electrode surface. Compared with the bare GE (curve a), the resistance obviously increased after the electrode was modified with antibody and proteins (curve b and curve c) because the antibody and proteins hindered electron transfer from the electrode. With the addition of PSA, the antigen–antibody structure was formed on the electrode surface. Thus, interfacial resistance further increased by thickening the bio-film on the electrode surface (curve d). When the electrode was modified with Ab2-Au@SiO2-Ru, maximum resistance was observed (curve e). The remarkable increase in resistance could be induced by the formation of the antibody–antigen sandwich structure and the hydrophobicity of the composite nanoparticles.3.3. The effect of the gold nucleus on ECL enhancement
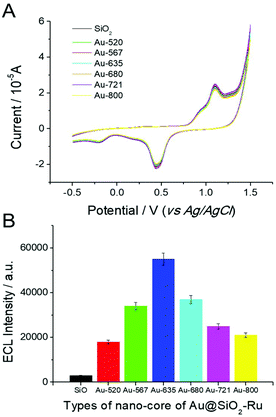
The LSPR of noble metal nanomaterials is closely related to their morphology and size. In order to investigate the effect of the Au nucleus on the ECL enhancement, several different gold nanoparticles were selected as the crystal cores of Au@SiO2-Ru composite nanomaterials (shown in Fig. 3). These include (1) the spherical gold nanoparticles with LSPR absorption peak at 520 nm (Au-520); (2) the elliptical gold nanoparticles with LSPR absorption peak of 567 nm (Au-567); (3) four different aspect ratios of gold nanorods with the longitudinal LSPR absorption peaks at 635 nm (Au-635), 680 nm (Au-680), 721 nm (Au-721) and 800 nm (Au-800), respectively. We also selected SiO2 nanoparticles with a particle size of 30 nm as the crystal core to prepare SiO2-Ru(bpy)32+ composite nanomaterials (SiO2-Ru) by the same method. This was used for the control experiments for SEECL testing.The ECL test results of the SEECL sensors prepared using different crystal cores are shown in Fig. 4(B). Under the same experimental conditions and similar surface state of the modified electrodes (as shown in Fig. 4(A)), the Au@SiO2-Ru modified electrode had a stronger ECL signal than the SiO2-Ru modified electrode. On changing the Au nucleus from spherical to rod-shaped, the ECL signals increased rapidly; this is due to a change in the LSPR of the gold nucleus. The AuNPs have only one LSPR peak at ∼520 nm, while the AuNRs have two LSPR absorption peaks, namely, the transverse and longitudinal peaks. The transverse absorption peak of gold nanorods is generally located at ∼520 nm, and the longitudinal absorption peaks change in the range 520 nm–800 nm with the different aspect ratios of nanorods.
The induced electromagnetic field produced by the co-generation of two LSPR absorption bands in AuNR is more beneficial for exciting Ru(bpy)32+. In particular, when the longitudinal LSPR absorption peak of AuNR reached 635 nm, the absorption spectra overlapped with the ECL emission spectra (λem = 630 nm) of Ru(bpy)32+. In this situation, the LSPR of AuNR was more easily induced by the excited-state Ru(bpy)32+, thus the LSPR induced electromagnetic field was more efficient in enhancing the quantum yield of the ground-state Ru(bpy)32+. Moreover, Fig. 4(B) also indicates that with the increase of the longitudinal absorption peak wavelength of AuNR from 635 nm to 800 nm, the ECL signal of the sensor gradually decreased. When the LSPR absorption peak of AuNRs reached 820 nm, the ECL signal was similar to that of AuNPs.
3.4. Detection of PSA
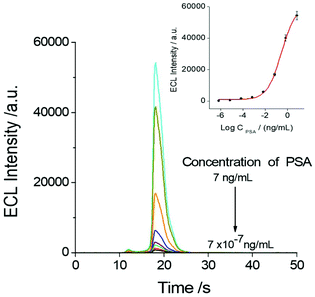
The relationship between the ECL response of the sensor and the PSA test concentration was investigated as shown in Fig. 5. It indicated that the concentration of PSA in the system has a direct effect on the ECL response of the SEECL sensor, and the minimum response concentration of PSA can reach 7 × 10⁻⁷ ng mL−1, which is significantly lower than that of other analytical methods.9,35,363.5. The selectivity of the SEECL sensor
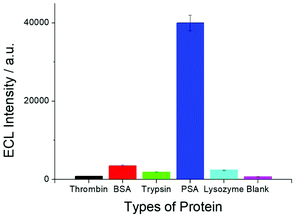
In order to test the selectivity of the SEECL sensor to PSA, four different proteins were detected in this paper. These four proteins were bovine serum albumin (BSA), thrombin, trypsin and lysozyme. The selected concentration of these four proteins was 70 ng mL−1, which was 100 times higher than that of PSA. Fig. 6 shows the response of SEECL sensors to various proteins. The results show that only negligible responses were observed for the four interfering proteins, while a significant response was generated in the presence of PSA. These results indicate that the SEECL sensor designed in this work has good selectivity toward PSA.3.6. Reproducibility and stability of the SEECL sensor
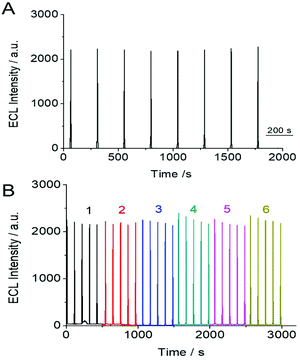
The stability and reproducibility of the SEECL sensor were also investigated. The stability of the SEECL sensor was evaluated by repeatedly measuring the ECL signal of the same SEECL sensor under the same experimental conditions. The reproducibility was obtained by collecting the ECL detection data of different SEECL sensors prepared in different batches. According to the ECL detection results in Fig. 7, the relative standard deviation (RSD) of the ECL response value of the same SEECL sensor was 4.09% (see Fig. 7(A)), while the RSD of ECL response values measured by different batches of SEECL sensors produced by the same method was 5.25% (see Fig. 7(B)).4. Conclusions
In summary, we have demonstrated a SEECL sensor for the ultrasensitive detection of PSA in serum. With the specific reaction between antigen and antibody, the PSA in serum was captured by the Ab1 modified electrode, and then the double-antibody structure was formed in the presence of Ab2-Au@SiO2-Ru; this outlines the preparation of SEECL sensor. The more PSA is captured, the more Au@SiO2-Ru composite nanomaterials are fixed on the surface of the electrode. Therefore, the PSA content can be determined directly by measuring the ECL signal of the modified electrode. Our investigation revealed that the LSPR produced by the AuNR core of Au@SiO2-Ru greatly improved the detection sensitivity of the sensor, and the minimum concentration of PSA was 7 × 10⁻⁷ ng mL−1 under optimal conditions could be achieved. Moreover, the selective experimental results indicated the proposed SEECL sensor can be used for the selective detection of PSA. This method provides a reference for the specific detection of other proteins and antigens.Conflicts of interest
There are no conflicts to declare.Acknowledgements
This work was supported by the National Natural Science Foundation of China (21675028, 21507041), Nature Sciences Funding of Fujian Province (2018J01682), STS Key Project of Fujian Province (2017T3007), the Cooperative Project of Production and Study in University of Fujian Province (2018Y4007), the Natural Science Foundation of Fujian Province (2017J05020), the Science and Technology Project of Fujian Education Department (JAT160764), and the Program for New Century Excellent Talents in Fujian Province University.References
- B. Wang, Y.-X. Dong, Y.-L. Wang, J.-T. Cao, S.-H. Ma and Y.-M. Liu, Sens. Actuators, B, 2018, 254, 159–165 CrossRef CAS.
- Y.-X. Dong, J.-T. Cao, Y.-M. Liu and S.-H. Ma, Biosens. Bioelectron., 2017, 91, 246–252 CrossRef CAS.
- Y. Nie, P. Zhang, H. Wang, Y. Zhuo, Y. Q. Chai and R. Yuan, Anal. Chem., 2017, 89(23), 12821–12827 CrossRef CAS.
- L. Zheng, C. Fang, J. Yan, H. Li and Y. Tu, Sci. Rep., 2017, 7, 11199 CrossRef.
- S. Chandra, M. Mayer and A. J. Baeumner, Talanta, 2017, 168, 126–129 CrossRef CAS.
- M.-S. Wu, N. Xu, J. Qiao, J. Chen and L.-S. Jin, Analyst, 2019, 144, 4633–4638 RSC.
- Y. Chi, Z. Chen, Y. Chen, Y. Dong and X. You, ChemElectroChem, 2017, 4, 1783–1789 CrossRef.
- Q. Li, C. Kang, K. Li, A. Chen, W. Zhang and Y.-S. Zhao, Sci. China: Chem., 2017, 60, 642–648 CrossRef CAS.
- H. W. Shi, W. Zhao, Z. Liu, X. C. Liu, M. S. Wu, J. J. Xu and H. Y. Chen, Talanta, 2016, 154, 169–174 CrossRef CAS.
- X. Li, Y. Wang, L. Shi, H. Ma, Y. Zhang, B. Du, D. Wu and Q. Wei, Biosens. Bioelectron., 2017, 96, 113 CrossRef CAS.
- J. Chen, L. Guo, B. Qiu, Z. Lin and T. Wang, Mater. Chem. Front., 2018, 2, 835–860 RSC.
- B. Wang, X. Zhong, Y. Chai and R. Yuan, Sens. Actuators, B, 2017, 245, 247–255 CrossRef CAS.
- C. Zhang, Y. Fan, H. Zhang, S. Chen and R. Yuan, Anal. Bioanal. Chem., 2018, 411, 905–913 CrossRef.
- X. Ma, S. He, B. Qiu, F. Luo, L. Guo and Z. Lin, ACS Sens., 2019, 4, 782–791 CrossRef CAS.
- D. Wang, L. Guo, H. Rong, B. Qiu, Z. Lin and G. Chen, Sci. Rep., 2015, 5, 7954 CrossRef CAS.
- D. Wang, Y. Li, Z. Lin, B. Qiu and L. Guo, Anal. Chem., 2015, 87, 5966–5972 CrossRef CAS.
- U. H. Stenman, J. Leinonen, W. M. Zhang and P. Finne, Semin. Cancer Biol., 1999, 9, 83 CrossRef CAS PubMed.
- A. M. El-Shirbiny, Adv. Clin. Chem., 1994, 31, 99–133 CAS.
- X. Jiang, S. Cheng, W. Chen, L. Wang, F. Shi and C. Zhu, Anal. Biochem., 2012, 424, 1–7 CrossRef CAS.
- M. Sasaki, S. Ishidoya, A. Ito, H. Saito, S. Yamada, K. Mitsuzuka, Y. Kaiho, D. Shibuya, T. Yamaguchi and Y. Arai, Urology, 2014, 84, 1163–1167 CrossRef.
- G. L. Andriole, B. David, O. W. Brawley, G. Leonard, M. Michael, M. Francesco, P. Curtis, T. L. J. Tammela, T. Claudio and T. Donald, J. Urol., 2011, 185, 126–131 CrossRef CAS.
- X. Ma, Y. Lin, L. Guo, B. Qiu, G. Chen, H.-h. Yang and Z. Lin, Biosens. Bioelectron., 2017, 87, 122–128 CrossRef CAS.
- X. Ma, Z. Chen, P. Kannan, Z. Lin, B. Qiu and L. Guo, Anal. Chem., 2016, 88, 3227–3234 CrossRef CAS PubMed.
- H. M. Nguyen, R. L. Vessella, C. Morrissey, L. G. Brown, I. M. Coleman, C. S. Higano, E. A. Mostaghel, X. Zhang, L. D. True and H. M. Lam, Prostate, 2017, 77, 654–671 CrossRef CAS.
- E. J. Small, R. S. Lance, T. A. Gardner, L. I. Karsh, L. Fong, C. McCoy, T. DeVries, N. A. Sheikh, D. GuhaThakurta and N. Chang, Clin. Cancer Res., 2015, 21, 3862–3869 CrossRef CAS.
- S. Negoita, E. J. Feuer, A. Mariotto, K. A. Cronin, V. I. Petkov, S. K. Hussey, V. Benard, S. J. Henley, R. N. Anderson and S. Fedewa, Cancer, 2018, 124, 2801–2814 CrossRef.
- G. Frens, Nat. Phys. Sci., 1973, 241, 20–22 CrossRef CAS.
- T. Ming, L. Zhao, Z. Yang, H. Chen, L. Sun, J. Wang and C. Yan, Nano Lett., 2009, 9, 3896–3903 CrossRef CAS.
- L. Guo, G. Chen and D. Kim, Anal. Chem., 2010, 82, 5147–5153 CrossRef CAS.
- S. Zanarini, E. Rampazzo, L. Ciana, M. Marcaccio, E. Marzocchi, M. Montalti, F. Paolucci and L. Prodi, J. Am. Chem. Soc., 2009, 131, 2260–2267 CrossRef CAS.
- S. Gupta, P. K. Kilpatrick, E. Melvin and O. D. Velev, Lab Chip, 2012, 12, 4279–4286 RSC.
- J. TANG, D. Tang, B. Su, Q. Li, B. Qiu and G. Chen, Analyst, 2011, 136, 3869–3871 RSC.
- E. Spain, S. Carrara, K. Adamson, H. Ma, R. O'Kennedy, L. De Cola and R. J. Forster, ACS Omega, 2018, 3, 17116–17124 CrossRef CAS.
- H. Huang and J. J. Zhu, Biosens. Bioelectron., 2009, 25, 927–930 CrossRef CAS.
- D. M. Rissin, C. W. Kan, T. G. Campbell, S. C. Howes, D. R. Fournier, S. Linan, P. Tomasz, P. P. Patel, C. Lei and A. J. Rivnak, Nat. Biotechnol., 2010, 28, 595–599 CrossRef CAS.
- J. Zhou, N. Gan, T. Li, F. Hu, X. Li, L. Wang and L. Zheng, Biosens. Bioelectron., 2014, 54, 199–206 CrossRef CAS.
| This journal is © The Royal Society of Chemistry 2020 |

