 Open Access Article
Porous carbons derived from waste printing paper for high rate performance supercapacitors in alkaline, acidic and neutral electrolytes
Dandan Liu†
,
Yesheng Wang†,
Zhipeng Qiu,
Yanyan Li,
Li Wang,
Yi Zhao* and
Jin Zhou *
*
School of Chemistry and Chemical Engineering, Shandong University of Technology, P. R. China. E-mail: zhaoyi@sdut.edu.cn; zhoujin@sdut.edu.cn
First published on 22nd January 2018
Abstract
Renewable biomass as a precursor in the preparation of sustainable carbon materials for supercapacitors has gained much attention due to its huge reserves and being economical. In this paper, we used waste printing paper as the precursor to prepare highly porous carbons via a combined method of pre-carbonation and KOH activation. The prepared carbon materials exhibit huge specific surface areas and good conductivities as high as 2616.1 m2 g−1 and 198.8 mS cm−1, respectively. They were used as the electrode materials of supercapacitors in the most common aqueous electrolytes, including 6 M KOH, 1 M H2SO4, and 1 M Na2SO4, and showed excellent capacitive performance in all the investigated electrolytes, such as very high specific capacitances (e.g. 385.0, 370.1, and 317.7 F g−1 in KOH, H2SO4 and Na2SO4 electrolyte at 0.2 A g−1, respectively), outstanding rate capabilities (e.g. 198 F g−1 at 60 A g−1 in H2SO4), high energy densities (e.g. 21.9 W h kg−1 in Na2SO4), high power capability (at 28![[thin space (1/6-em)]](https://www.rsc.org/images/entities/char_2009.gif) 000 W kg−1, remains at 5.83 W h kg−1 in Na2SO4), and good recyclability (about 94% retention after 10
000 W kg−1, remains at 5.83 W h kg−1 in Na2SO4), and good recyclability (about 94% retention after 10![[thin space (1/6-em)]](https://www.rsc.org/images/entities/char_2009.gif) 000 cycles).
000 cycles).
1. Introduction
As a new type of energy storage device, the supercapacitor has attracted wide attention because of its irreplaceable advantages, such as high power capability, excellent recyclability, and superior safety.1–3 In some designs that require high power and efficiency, engineers have begun using supercapacitors to replace conventional batteries. According to their energy storage mechanism, supercapacitors are divided into electrochemical double layer (EDL) capacitors and pseudocapacitors, in which the charge is stored by a dielectric layer on the electrode–electrolyte interface and the rapid reversible chemical sorption or oxidation–reduction reaction, respectively.The electrode material is the most important constituent part of the supercapacitor, which significantly determines the performance of this device. Developing high-performance electrode materials is the focus of supercapacitor research.4,5 There have been many electrode materials developed for supercapacitors, which can be simply grouped into several types: carbon materials,6 transition metal oxide,7 conductive polymer,8 and composite materials.9 Owing to their low cost, environmental friendliness, rich source, and long cycle life, carbon materials, mainly porous carbon materials, have been the most reported electrode materials,10–13 and those have also been applied to commercial capacitors.14 But nowadays lots of porous carbon electrode materials were prepared from fuel-based precursors, such as coal,15 petroleum coke,16 asphalt17 and chemical synthetic polymers,18 which is not only an excessive consumption of non-renewable petrochemical resources but is difficult to be activated. Finding the renewable precursors to make sustainable carbon materials with high capacitance has been an urgent thing at the moment. Biomass materials are renewable, easily available and very cheap, and have received extensive attention as sustainable precursors for porous carbon materials.19,20 In recent years, a large amount of biomass waste are used as carbon source to prepare carbon electrode materials for supercapacitors, such as waste coffee beans,21 waste tea-leaves,22 rice husk and beet sugar,23 potato starch,24 human hair,25 animal bone,26 endothelium corneum gigeriae galli,27 shrimp shells,28 shiitake mushroom,29 peanut shell,30 biochar,31 and so on.
As everyone knows, printing papers are widely used in daily life, and then there will be a large number of waste printed papers produced. The ubiquitous waste printed paper is made up of cellulose and hemicellulose and is a good candidate of carbon precursors. For example, Puthusseri et al. have prepared high surface area carbons with hierarchical porosity by a hydrothermal treatment followed by controlled pyrolysis of waste paper. These waste paper derived carbons showed excellent performance in all-solid-state supercapacitor with ionic liquid polymer gel electrolyte.32 It is considered that the characteristic fibrous structure of printing paper seems to be much favored to the fast diffusion of electrolyte ions, possibly leading to high rate performance in supercapacitors. In general, carbon precursors are activated by physical or chemical methods, which deliver high specific surface area and much-developed porosity, giving a good capacitive performance as an electrode material of supercapacitors.33,34 KOH,35 NaOH,36 H3PO4,37 and ZnCl2 (ref. 38) are the most commonly used activating agents in chemical activation, among which KOH has been proved to be most efficient on developing porosity.39 Direct activating the printing paper by KOH will lead a strong decomposition of cellulose and hemicellulose, thus resulting in the destruction of its fiber structure as well as a very low carbon yield (<5%).
In this paper, we choose the waste printing paper as the precursors to prepare highly porous carbons via a two-step method combined with pre-carbonation and post-activation of KOH. The prepared carbon materials exhibit huge specific surface areas and good conductivities. They were also used as electrode materials of supercapacitors in the most common aqueous electrolytes, including 6 M KOH, 1 M H2SO4, and 1 M Na2SO4, and showed excellent capacitive performance.
2. Experimental
2.1 Preparation of waste printing paper-based carbons (WPPCs)
Waste printing paper is collected from our office. All the chemical agents, including KOH, HCl, polytetrafluoroethylene (PTFE) emulsion etc. are bought from Sinopharm Chemical Reagent. The waste printing paper-based carbons are prepared via a combination method of pre-carbonization and post-KOH activation. Firstly, waste printing papers are cut into small slices and then was carbonized at 500 °C for 2 h under an N2 atmosphere in a horizontal tube furnace. The obtained black powder was then mixed with different weight of KOH, and the mixture is placed in a tubular resistance furnace, followed by heating to 800 °C for 2 h at a rate of 3 °C min−1 under N2 protection to make the porous carbon materials. After cooling to room temperature, the obtained black powder are washed with 1 M HCl solution to eliminate any KOH residuals and then was thoroughly washed with deionized water until to neutral. Finally, the carbons are obtained after drying at 100 °C in the air and are denoted as WPPC-x, in which WPPC and x stand for waste printing paper-based carbon and the weight ratio of KOH/carbon.2.2 Electrode preparation and electrochemical measurements
For the preparation of working electrodes, the active materials were firstly mixed with PTFE binder in a weight ratio of 95![[thin space (1/6-em)]](https://www.rsc.org/images/entities/char_2009.gif) :
:![[thin space (1/6-em)]](https://www.rsc.org/images/entities/char_2009.gif) 5, and then 2 mg of the mixture was spread over the collectors evenly and pressed under 10 MPa to form a slice, and then drying at 100 °C to constant weight. In the KOH electrolyte, nickel foam was used as the collector, while titanium mesh was used in H2SO4 and Na2SO4 electrolyte. In this paper, the two-electrode system was used to test the performance of the prepared carbon as electrode materials of supercapacitors. The electrochemical tests, including cyclic voltammetry (CV), galvanostatic charge/discharge (GCD) tests are carried on a CHI660C electrochemical testing station (Chenhua Instruments Co. Ltd. Shanghai). The cyclic galvanostatic charge/discharge experiments were carried out on an automatic galvanostatic charge/discharge device (Land CT 2001A, Wuhan, China).
5, and then 2 mg of the mixture was spread over the collectors evenly and pressed under 10 MPa to form a slice, and then drying at 100 °C to constant weight. In the KOH electrolyte, nickel foam was used as the collector, while titanium mesh was used in H2SO4 and Na2SO4 electrolyte. In this paper, the two-electrode system was used to test the performance of the prepared carbon as electrode materials of supercapacitors. The electrochemical tests, including cyclic voltammetry (CV), galvanostatic charge/discharge (GCD) tests are carried on a CHI660C electrochemical testing station (Chenhua Instruments Co. Ltd. Shanghai). The cyclic galvanostatic charge/discharge experiments were carried out on an automatic galvanostatic charge/discharge device (Land CT 2001A, Wuhan, China).
The specific capacitance was calculated from:
 | (1) |
Energy densities (E) and power densities (P) could be calculated from the galvanostatic charge/discharge test using the equations of
 | (2) |
 | (3) |
2.3 Materials characterizations
Scanning electron microscope (SEM, Sirion 200 FEI Netherlands) and transmission electron microscope (TEM, JEM2100, JEOL and Japan) are used to determine the microstructure of the prepared samples. The surface chemistries of the samples were characterized by X-ray photoelectron spectroscopy (XPS, Escalab 250, USA). The element compositions of the carbons were also characterized by energy dispersive spectroscopy (EDS, INCA Energy spectrometer, Netherlands). The Raman spectrometer used here is LabRAM HR800 from JY Horiba. Specific surface area and pore size distribution (PSD) of WPPCs were determined by nitrogen sorption test on the ASAP 2020system (Micromeritics USA). Brunauer–Emmett–Teller (BET) surface area (SBET) was calculated from the N2 adsorption isotherm data within the relative pressure (p/p0) of 0.05–0.25. And the total pore volume (VT) is estimated with respect to the amount of adsorption at a pressure of 0.995. The micropore volume (Vmicro) was calculated by the t-plot method, and the mesopore volume (Vmeso) was determined by subtracting the micropore volume from the total pore volume. The plots of pore size distribution (PSD) were obtained from the adsorption isotherms based on the non-linear density functional theory (NLDFT) and a slit-shaped pore model.3. Results and discussion
3.1 Textural characterizations
Fig. 1 displays the micromorphologies of the printing paper, pre-carbonized materials and the investigated WPPCs observed by SEM and TEM. The typical structure of the fibrous network is observed for the printing papers, and those small particles filling the gaps of the fibrous network are the additives, such as optical brighteners, inorganic salts, etc. (Fig. 1a). Under high-resolution of SEM observation, it could be seen that the surface of the paper fiber is rough because the paper fiber is composed of lots of thin bio-polymer fibers (Fig. 1b). After a treatment of pre-carbonization, the fiber structure still remains, and lots of curved carbon layers with a smooth surface are observed (Fig. 1c and d). The thickness of the carbon layers is about 150 nm. After the KOH activation, the fiber structure is destroyed, and as the degree of activation increases, the more destructive the fiber structure is. However, it can be seen that the fiber structure of waste printed paper is not completely destroyed when the KOH/carbon precursor ratio is less than or equal to 3. As shown in Fig. 1e–h, the prepared WPPC-2 and WPPC-3 exhibit a similar micromorphology to the pre-carbonized sample. It is believed that this wrinkled and thin structure of the carbon materials is very positive for the diffusion of electrolyte ions, and will result in good rate capabilities. When the activation ratio reaches 4, the morphology of the material is much different from that of other samples; it can be seen from the Fig. 1i that the fibrous structure was almost completely destroyed. Furthermore, the wrinkled structure has disappeared, and lots debris are observed on the carbon surface, as shown in Fig. 1j. These facts may be due to the high degree of activation by excess KOH. Under TEM observations, lots of worm-like micropores are found in the carbon frameworks (Fig. 1k and l). It is well known that the presence of these micropores could offer high specific surface areas for the formation of EDL capacitance.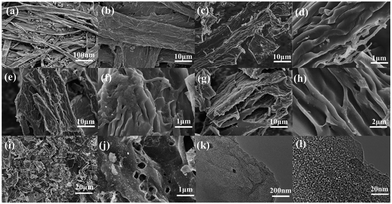 | ||
| Fig. 1 SEM images of (a and b) the printing paper, (c and d) pre-carbonized materials, (e and f) WPPC-2, (g and h) WPPC-3, and (i and j) WPPC-4 (g); TEM images of (k and l) WPPC-2. | ||
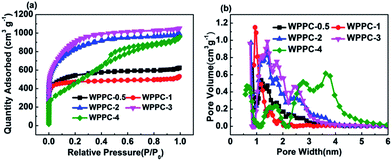
In order to determine the pore texture of the WPPCs, we performed N2 adsorption/desorption measurements. Fig. 2a shows the N2 adsorption/desorption isotherms of the WPPCs. According to the IUPAC classification, the isotherms of WPPCs gradually vary from type I to type IV, indicating a systematic change of the porosity. At very low relative pressure (p/p0 < 0.02), all of the samples exhibit a high adsorption capacity, indicating that a lot of micropores existed in all the samples. As the weight ratio of KOH/carbon precursor increases, the knee of the isotherm widens, indicating a broadening of micropore size. The slight positive slope in the range p/p0 = 0.2–1, showed in the isotherms of the carbon samples except for WPPC-4, indicates that the contents of mesopores are relatively low. It can be observed in Fig. 2a that the WPPC-4 exhibits type IV isotherm which is much different from the others, indicating that this carbon is mesoporous. The results provide insight into the amount of KOH plays an important role in the creation of microporous structures in WPPCs at high temperature. The systematic widening of the porosities is further confirmed by the PSD plots shown in Fig. 2b. More information about the specific surface area and pore volume of WPPCs is given in Table 1. It can be seen that the WPPCs have very high BET surface areas ranging from 1326.4 m2 g−1 to 2616.1 m2 g−1 and large pore volumes ranging from 0.72 cm3 g−1 to 1.4 cm3 g−1. Roughly, as the weight ratio of KOH/carbon precursor increases, the BET surface area firstly increases and then significantly decreases, as well as the micropore pore volume, while the mesopore volume dramatically increases when the weight ratio of KOH/carbon precursor increase to 4. These facts indicate that the KOH activation firstly mainly developed micropores and then widen the microporosity with even a shift to mesoporosity as the weight ratio of KOH/carbon precursor increases.
| Samples | SBET/m2 g−1 | Smicro/m2 g−1 | Vtotal/cm3 g−1 | Vmicro/cm3 g−1 | Vmeso/cm3 g−1 | Conductivity/mS cm−1 |
|---|---|---|---|---|---|---|
| WPPC-0.5 | 1418.8 | 1293.8 | 0.74 | 0.68 | 0.09 | 73.36 |
| WPPC-1 | 1326.4 | 1231.8 | 0.72 | 0.62 | 0.08 | 129.03 |
| WPPC-2 | 2468.9 | 1947.3 | 1.34 | 0.97 | 0.37 | 144.5 |
| WPPC-3 | 2616.1 | 2181.8 | 1.40 | 1.09 | 0.32 | 198.8 |
| WPPC-4 | 2077.1 | 1150.8 | 1.35 | 0.53 | 0.82 | 144.5 |
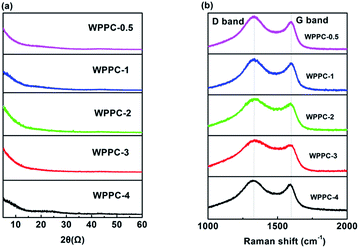
XRD patterns and Raman spectra of the WPPCs are presented in Fig. 3. For all of these samples, there is no discernible peak observed on the XRD patterns (Fig. 3a). As can be seen from Fig. 3b, the Raman spectra of the samples exhibit two characteristic peaks, one is the D peak at the 1340 cm−1, and the other is the G peak at the 1589 cm−1, which are typical peaks of amorphous carbon materials.40 Commonly, the intensity ratio of D/G peak used to reflect the lattice defects and the order of carbon materials. The ID/IG values are calculated to be 1.17, 1.14, 1.13, 1.32 and 1.08 for the prepared carbons with the increasing order of KOH/carbon precursor. The results of XRD and Raman tests indicated that the structure of the prepared carbons is amorphous.41 However, these carbons show good conductivities up to 198.8 mS cm−1 for WPPC-3, as shown in Table 1, which may be related to the structure of wrinkled carbon layers.
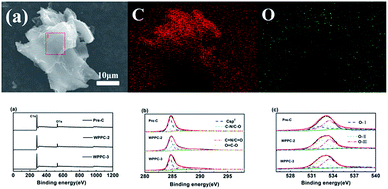
In order to determine the surface element compositions of WPPCs and their existing valence states, EDS and XPS measurements are performed. As we can view in Fig. 4a, the elements are mainly C and O, and no other impurities found in the WPPCs. The oxygen contents are determined to be 10.23 at%, 9.57 at%, and 9.03 at% for pre-C, WPPC-2, and WPPC-3 by XPS measurement, respectively. We also determine the atom binding states of the prepared WPPCs by using the high-resolution XPS. C1s scans show four peaks at around 284.7, 286.7, 287.8 and 289 eV corresponding to C![[double bond, length as m-dash]](https://www.rsc.org/images/entities/char_e001.gif) C/C–C in sp2-hybridized domains, C–O (epoxy, hydroxyl), C
C/C–C in sp2-hybridized domains, C–O (epoxy, hydroxyl), C![[double bond, length as m-dash]](https://www.rsc.org/images/entities/char_e001.gif) O (carbonyl), and O
O (carbonyl), and O![[double bond, length as m-dash]](https://www.rsc.org/images/entities/char_e001.gif) C–O (carboxyl) groups, respectively. O1s scans show three peaks at 531.1, 532.4 and 533.4 eV, pointing out the existence of quinine (O-I), phenol groups (O-II) and carboxyl group (O-III), respectively. These oxygen-containing functional groups on the carbon surface would modify the polarity of the surface of the prepared carbons, further promotes the wettability between carbon surface and electrolyte. Additionally, these heteroatoms usually introduce pseudo-capacitance via fast redox reaction of specific electro-active groups, such as C
C–O (carboxyl) groups, respectively. O1s scans show three peaks at 531.1, 532.4 and 533.4 eV, pointing out the existence of quinine (O-I), phenol groups (O-II) and carboxyl group (O-III), respectively. These oxygen-containing functional groups on the carbon surface would modify the polarity of the surface of the prepared carbons, further promotes the wettability between carbon surface and electrolyte. Additionally, these heteroatoms usually introduce pseudo-capacitance via fast redox reaction of specific electro-active groups, such as C![[double bond, length as m-dash]](https://www.rsc.org/images/entities/char_e001.gif) O, C–OH, etc.42,43
O, C–OH, etc.42,43
3.2 Electrochemical performance in aqueous electrolytes
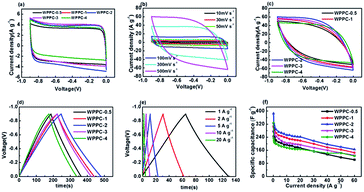
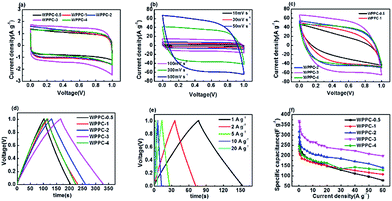
Electrochemical testing of the WPPCs was firstly performed in 6 M KOH electrolyte, the most common electrolyte for supercapacitors (Fig. 5). As showed in Fig. 5a, all the CV curves obtained at 30 mV s−1 are symmetrically rectangular, indicating that electrode reactions have high reversibility with a main storage charge mode of EDL in the KOH electrolyte. As the scanning rate increases, the CV curves of the WPPC-2 exhibit a slight deviation from the typical rectangular shape, indicating a few decrease in capacitance (Fig. 5b). In comparison, the CV curves of WPPC-2 at 30 mV s−1 and 500 V s−1 are constituted by the larger area with the greater response current, a reflection of higher specific capacitance because of its larger specific surface area (Fig. 5a and c). As shown in Fig. 5c, the GCD curves are highly symmetrical and linear at the current density of 0.3 A g−1, further confirming the main nature of EDL capacitance and good reversibility of charge/discharge process. We further performed the charge/discharge test in the range of 0.2 A g−1 to 60 A g−1. As shown in Fig. 5d, the specific capacitance gradually decreases with the increase of the current density, which is common for porous carbon electrode materials. This is because the larger the charge current density is, the shorter the charging time of the capacitor, due to the presence of aperture limit, the electrolyte ion can not completely diffuse into the pores of various materials, leading to the reduction of the effective surface area which decreased the specific capacitance. It could be found that WPPC-2 exhibits the highest specific capacitance among the prepared WPPCs carbons in the range of 0.2–60 A g−1, as high as 385.0 F g−1 and 165.3 F g−1 at 0.2 A g−1 and 60 A g−1, respectively.We further investigated the capacitive performance of the WPPCs in 1 M H2SO4 electrolyte, which is shown in Fig. 6. As shown in Fig. 6a, the shapes of all the curves are quasi-rectangular with good symmetry, and there is no obvious redox peak observed, indicating that the electrode reaction has the excellent reversibility in the H2SO4 electrolyte, and the WPPCs have good capacitive characteristics with the charge stored in the form of EDL. As shown in Fig. 6b, all the CV curves of the WPPC-3 obtained in a wide range of 10–500 mV s−1 exhibit a quasi-rectangular shape, and the responding current density roughly increases in proportion to the scanning rate, indicating that this carbon possesses good rate capability. From Fig. 6a and c, it could be concluded that the WPPC-3 possesses the highest capacitance, followed by the WPPC-2, which is contrary to the order in the KOH electrolyte. This may be related to the matching between the porosity and the size of electrolyte ions which will be discussed next. The GCD tests are used to measure the specific capacitance of the WPPCs. From Fig. 6d and e, it can be seen that all the charge/discharge curves show the typical features of an isosceles triangle, a reflection of the high coulombic efficiency. The specific capacitances of the WPPCs are calculated from the galvanostatic discharge time, and the functional relationship between the specific capacitance and charge/discharge current density is shown in Fig. 6f. Clearly, the WPPC-3 carbon exhibits the highest specific capacitance in the range of 0.2 to 60 A g−1. At the current density of 0.2 A g−1, WPPC-3 shows a capacitance as high as 370.1 F g−1, much higher than that of WPPC-0.5, WPPC-1, WPPC-2, and WPPC-4 which is 289.1, 230.2, 317.7 and 244.8 F g−1, respectively. At a high current density up to 60 A g−1, the WPPC-3 still gives a remarkable capacitance up to 198 F g−1, further confirming the good rate capability of this carbon.
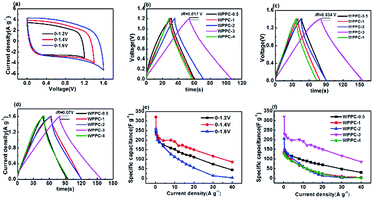
As we all know, the energy densities of supercapacitor are proportional to the square of voltage window of supercapacitors. The operating voltage of supercapacitors based on aqueous electrolyte can only reach about 1 V because water will decompose at a higher voltage. The neutral Na2SO4 electrolyte has been very promising due to its advantages such as the high operation voltage (>1.0 V) and being environmentally friendly. Therefore, we further evaluated the application of the WPPCs in 1 M Na2SO4 electrolyte. As shown in Fig. 7a, the CV curves measured in the voltages of 0–1.2, 0–1.4, and 0–1.6 V confirm a typical EDL capacitive behavior. However, as the scanning voltage range increases, the responding current at the high potential significantly increases indicating that some oxygen evolution reactions of water occur. We further performed on the GCD test at the voltage range same as the CV test (Fig. 7b–d). Apparently, the charge/discharge plots show isosceles triangle-liked shape, but the coulombic efficiency decreases with the increase of the voltage range, e.g. 98%, 94%, 92% for WPPC-3 at 0–1.2 V, 0–1.4 V, and 0–1.6 V, respectively. Furthermore, the iR drop also increases with the increase of voltage range as shown in Fig. 7b–d. Combined the results of CV and GCD measurements, it could be concluded that some irreversible chemical reactions, including the decomposition of electrolyte and oxidation of carbon materials, occur at the high potential, leading to the increase of resistance for the investigated carbons. The specific capacitances of WPPC-3 as a function of charge/discharge current density are shown in Fig. 7e. It could be seen that this carbon possesses better capacitive performance in the range of 0–1.4 V, including a very high specific capacitance of 321.7 F g−1 at 0.2 A g−1, and 116.6 F g−1 at 30 A g−1. It should be noted that the specific capacitance dramatically declines with the increase of current density at the high voltage of 0–1.6 V, which is due to the larger resistance of WPPC-3 resulted from the oxidation of the carbon at the higher work voltage as discussed above. Finally, all the samples are tested at the voltage of 0–1.4 V. As shown in Fig. 7f, the WPPC-3 carbon exhibits much higher capacitances than the others in the Na2SO4 electrolyte.
As investigated above, the waste paper derived carbon materials exhibit very high specific capacitance in the aqueous electrolytes. This should be mainly attributed to their high developed porosity with the high accessible surface area because of the main storage charge mode of EDL in the aqueous electrolytes. However, the contribution of oxygen-containing groups should be also noticed since the prepared carbons possess high oxygen content, such as 9.57 at% and 9.03 at% for WPPC-2 and WPPC-3, respectively. It is widely known that the oxygen-containing groups could introduce additional pseudocapacitance into the whole capacitance of carbon materials. In the case of KOH electrolyte, a redox mechanism for a carbonyl or quinone-type group has been proposed as42
| –CxO + e− + K+ ⇔ –Cx–OK | (4) |
In the case of H2SO4, the redox mechanism could be expressed as:43
–C![[double bond, length as m-dash]](https://www.rsc.org/images/entities/char_e001.gif) O + H+ + e ⇔ –C–OH O + H+ + e ⇔ –C–OH
| (5) |
However, in the case of Na2SO4, Young Joon Oh reported that the oxygenated groups are not involved in the pseudocapacitive faradaic reaction.43 Moreover, the hydrophilic oxygen species could promote the wettability of carbon pore surface to the aqueous electrolytes, facilitating the diffusion of electrolyte ions.
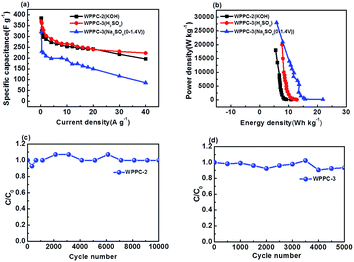
As shown in Fig. 8, WPPC-2 exhibits the best electrochemical performance in the KOH electrolyte, while WPPC-3 is best in H2SO4 and Na2SO4 electrolytes (Fig. 8a). This is because that the specific capacitance of the supercapacitor is related to the pore structure of electrode material and its matching degree of electrolyte in size. The hydrated ions in the KOH (K+: 3.31 Å, OH−: 3.00 Å) are smaller than those in H2SO4 (H+: 2.82 Å, SO42−: 3.79 Å) and Na2SO4 (Na+: 3.58 Å) electrolyte, that means the pore size well matching to the KOH electrolyte is smaller. As we discussed above, the pore size of the WPPCs gradually increases as the KOH dosage increases. Compared with WPPC-3, WPPC-2 possesses similar specific surface area, but smaller micropores. It has been accepted that the smaller micropores play a positive role in the capacitive performance because the ions are much closer to the carbon surface in these pores.50–56 Therefore, in KOH electrolyte, the WPPC-2 shows higher capacitance than WPPC-3. On the other hand, due to the facts that the specific surface area of WPPC-3 is bigger than WPPC-2, and the ions of H2SO4 and Na2SO4 (mainly SO42−) require a larger pore size, there are more electrolyte ion into the WPPC-3 material and get better capacitance.
Ragone plots of the WPPCs are displayed in Fig. 8b, which are used to characterize the energy and power characteristics of the electrode materials. The energy density of supercapacitors is directly proportional to the specific capacitance value, and is proportional to the square of the operating voltage, as shown in the formula of E = 1/2CV2. Therefore, the WPPC-3 exhibits the maximum energy density of 21.9 W h kg−1 at a power density of 140 W kg−1 in the Na2SO4 electrolyte. Generally, the energy and power limitations are more obvious at higher charge/discharge rates, which are related to the complex impedance and diffusion paths in the pore structure. At higher discharge currents, only part of the pore structure can be immersed by electrolyte ions, while at relatively low current densities, both the inner and the outer pore structures of the material can store the charge. At a high power density of 28![[thin space (1/6-em)]](https://www.rsc.org/images/entities/char_2009.gif) 000 W kg−1, the energy density is still up to 5.83 W h kg−1. In the H2SO4 electrolyte, the WPPC-3 shows a maximum energy density of 12.85 W h kg−1 at the power density of 100 W kg−1, and still remain 7.75 W h kg−1 when the power density increases to 20
000 W kg−1, the energy density is still up to 5.83 W h kg−1. In the H2SO4 electrolyte, the WPPC-3 shows a maximum energy density of 12.85 W h kg−1 at the power density of 100 W kg−1, and still remain 7.75 W h kg−1 when the power density increases to 20![[thin space (1/6-em)]](https://www.rsc.org/images/entities/char_2009.gif) 000 W kg−1. The cycle life is also an important requirement for supercapacitors. The long-term cyclic stability of the capacitance performance of WPPC-2 and WPPC-3 was evaluated by using a galvanometer charge/discharge test at a current density of 5 A g−1 in KOH electrolyte and H2SO4 electrolyte, respectively (Fig. 8c and d). It can be seen that these carbons exhibit good cyclic charge and discharge performance. The specific capacitance of WPPC-2 slightly drops 7.0% from 333.33 to 311.11 F g−1, still more than 93.0% after 10
000 W kg−1. The cycle life is also an important requirement for supercapacitors. The long-term cyclic stability of the capacitance performance of WPPC-2 and WPPC-3 was evaluated by using a galvanometer charge/discharge test at a current density of 5 A g−1 in KOH electrolyte and H2SO4 electrolyte, respectively (Fig. 8c and d). It can be seen that these carbons exhibit good cyclic charge and discharge performance. The specific capacitance of WPPC-2 slightly drops 7.0% from 333.33 to 311.11 F g−1, still more than 93.0% after 10![[thin space (1/6-em)]](https://www.rsc.org/images/entities/char_2009.gif) 000 cycles, and the WPPC-3 remains about 94% of the initial cycle.
000 cycles, and the WPPC-3 remains about 94% of the initial cycle.
Finally, we compared the capacitive performance of WPPCs with other biomass-based carbon materials ever reported. As shown in Table 2, the specific capacitances of printing paper-based carbons prepared here are much higher than that of carbon materials derived from lots of biomass, such as shrimp shells,28 peanut shell,30 sunflower seed,57 waste paper,58 lignocellulose,59 cassava peel,44 coffee endocarp,60 etc., further confirming the excellent performance of the WPPCs prepared here.
| Biomass | Activating agent | Capacitance/F g−1 | Electrolyte | Ref. |
|---|---|---|---|---|
| WPPC-2 | KOH | 385 | 6 M KOH | This work |
| WPPC-3 | KOH | 370 | 1 M H2SO4 | This work |
| Cassava peel | KNO3 | 264 | 1 M H2SO4 | 44 |
| Shrimp shells | H3PO4 | 260 | 6 M KOH | 28 |
| Coffee endocarp | KOH | 176 | 1 M H2SO4 | 21 |
| Willow catkins | KOH | 279 | 6 M KOH | 45 |
| Peanut shell | ZnCl2 | 245 | 6 M KOH | 30 |
| Animal bone | KNO3 | 185 | 7 M KOH | 26 |
| Shiitake mushroom | H3PO4 | 206 | 6 M KOH | 29 |
| Broussonetia papyrifera | KOH | 320 | 6 M KOH | 20 |
| Biomorphic cotton | NaOH | 221 | 3 M KOH | 46 |
| Pine cone | KOH | 137 | 1 M Na2SO4 | 47 |
| Potato waste residue | ZnCl2 | 255 | 2 M KOH | 48 |
| Lignin gel | KOH | 91 | 6 M KOH | 49 |
| CO2 | 102 |
4. Conclusions
In summary, the waste printing papers have been successfully converted into porous carbon electrode materials via a combination method of pre-carbonization and KOH-activation treatment. After activation, the prepared samples have a large specific surface area, which lays the foundation for the high performance of supercapacitors. On the other hand, the fiber structure of waste printing paper also plays an positive role in obtaining high rate performance for the application in supercapacitors. The specific capacitance can achieve to 385.0, 370.1, 317.7 F g−1 in KOH, H2SO4 and Na2SO4 electrolyte at 0.2 A g−1, respectively. In H2SO4 electrolyte, the WPPC-3 still possesses a very high capacitance of 198 F g−1 at 60 A g−1. And in the Na2SO4 electrolyte, WPPCs shows a much higher working voltage of 1.4 V, thus WPPC-3 exhibit the maximum energy density of 21.9 W h kg−1 at a power density of 140 W kg−1. The electrochemical results also prove that the capacitive performance is primarily determined by the pore structure and its matching with electrolyte ions. Considering its widespread existence, waste printing paper will be a rich carbon source for the preparation of carbon electrode materials. And the results reported here show that the waste printing paper based activated carbons can be a good candidate for high-performance electrode materials of supercapacitors.Conflicts of interest
There are no conflicts to declare.Acknowledgements
We are grateful for the financial support by National Natural Science Foundation of China (NSFC21576158 and 21576159), the Young Talents Joint Fund of Shandong Province (ZR2017JL014), and SDUT & Zibo City Integration Development Project (2016ZBXC112).Notes and references
- Z. Lin, D. Sun, Q. Huang, J. Yang, M. W. Barsoum and X. Yan, J. Mater. Chem. A, 2015, 3, 14096–14100 CAS.
- L. Hao, X. Li and L. Zhi, Adv. Mater., 2013, 25, 3899–3904 CrossRef CAS PubMed.
- H. Tang, S. Zhuang, Z. Bao, C. Lao and Y. Mei, ChemElectroChem, 2016, 3, 871–876 CrossRef CAS.
- Q. H. Yang and H. M. Cheng, Elsevier, 2006, 12, 323–359 Search PubMed.
- J. Shao, M. Song, G. Wu, Y. Zhou, J. Wan, X. Ren and F. Ma, Energy Storage Materials, 2018, 13, 57–65 CrossRef.
- W. Xing, C. C. Huang, S. P. Zhuo, X. Yuan, G. Q. Wang, D. Hulicova-Jurcakova, Z. F. Yan and G. Q. Lu, Carbon, 2009, 47, 1715–1722 CrossRef CAS.
- Q. Lv, K. Chi, Y. Zhang, F. Xiao, J. Xiao, S. Wang and K. P. Loh, J. Mater. Chem. A, 2017, 5, 2759–2767 CAS.
- M. O. Yanik, E. A. Yigit, Y. E. Akansu and E. Sahmetlioglu, Energy, 2017, 138, 883–889 CrossRef CAS.
- J. Zhou, Z. Zhang, W. Xing, J. Yu, G. Han, W. Si and S. Zhuo, Electrochim. Acta, 2015, 153, 68–75 CrossRef CAS.
- X. Y. Chen, C. Chen, Z. J. Zhang, D. H. Xie, X. Deng and J. W. Liu, J. Power Sources, 2013, 230, 50–58 CrossRef CAS.
- J. Yan, Q. Wang, C. Lin, T. Wei and Z. Fan, Adv. Energy Mater., 2015, 4, 1294–1305 Search PubMed.
- Y. Yan, B. Li, W. Guo, H. Pang and H. Xue, J. Power Sources, 2016, 329, 148–169 CrossRef CAS.
- M. Zhou, F. Pu, Z. Wang and S. Guan, Carbon, 2014, 68, 185–194 CrossRef CAS.
- G. Lota, T. A. Centeno, E. Frackowiak and F. Stoeckli, Electrochim. Acta, 2008, 53, 2210–2216 CrossRef CAS.
- Z. Peng, Z. Guo, W. Chu and M. Wei, RSC Adv., 2016, 6, 42019–42028 RSC.
- M.-H. Tan, P. Li, J.-T. Zheng, T. Noritatsu and M.-B. Wu, New Carbon Mater., 2016, 31, 343–351 CrossRef.
- W. Zhang, Z.-H. Huang, Z. Guo, C. Li and F. Kang, Mater. Lett., 2010, 64, 1868–1870 CrossRef CAS.
- X. Wu, V. L. Chabot, B. K. Kim, A. Yu, R. M. Berry and K. C. Tam, Electrochim. Acta, 2014, 138, 139–147 CrossRef CAS.
- Z. Li, L. Yang, H. Cao, Y. Chang, K. Tang, Z. Cao, J. Chang, Y. Cao, W. Wang, M. Gao, C. Liu, D. Liu, H. Zhao, Y. Zhang and M. Li, Carbohydr. Polym., 2017, 175, 223–230 CrossRef CAS PubMed.
- T. Wei, X. Wei, Y. Gao and H. Li, Electrochim. Acta, 2015, 169, 186–194 CrossRef CAS.
- T. E. Rufford, D. Hulicova-Jurcakova, Z. Zhu and G. Q. Lu, Electrochem. Commun., 2008, 10, 1594–1597 CrossRef CAS.
- C. Peng, X.-B. Yan, R.-T. Wang, J.-W. Lang, Y.-J. Ou and Q.-J. Xue, Electrochim. Acta, 2013, 87, 401–408 CrossRef CAS.
- S. Kumagai, M. Sato and D. Tashima, Electrochim. Acta, 2013, 114, 617–626 CrossRef CAS.
- S. Zhao, C.-Y. Wang, M.-M. Chen, J. Wang and Z.-Q. Shi, J. Phys. Chem. Solids, 2009, 70, 1256–1260 CrossRef CAS.
- W. Si, J. Zhou, S. Zhang, S. Li, W. Xing and S. Zhuo, Electrochim. Acta, 2013, 107, 397–405 CrossRef CAS.
- W. Huang, H. Zhang, Y. Huang, W. Wang and S. Wei, Carbon, 2011, 49, 838–843 CrossRef CAS.
- X. Hong, K. S. Hui, Z. Zeng, K. N. Hui, L. Zhang, M. Mo and M. Li, Electrochim. Acta, 2014, 130, 464–469 CrossRef CAS.
- J. Qu, C. Geng, S. Lv, G. Shao, S. Ma and M. Wu, Electrochim. Acta, 2015, 176, 982–988 CrossRef CAS.
- P. Cheng, S. Gao, P. Zang, X. Yang, Y. Bai, H. Xu, Z. Liu and Z. Lei, Carbon, 2015, 93, 315–324 CrossRef CAS.
- X. He, P. Ling, J. Qiu, M. Yu, X. Zhang, C. Yu and M. Zheng, J. Power Sources, 2013, 240, 109–113 CrossRef CAS.
- Z. Qiu, Y. Wang, X. Bi, T. Zhou, J. Zhou, J. Zhao, Z. Miao, W. Yi, P. Fu and S. Zhuo, J. Power Sources, 2018, 376, 82–90 CrossRef CAS.
- D. Puthusseri, V. Aravindan, B. Anothumakkool, S. Kurungot, S. Madhavi and S. Ogale, Small, 2014, 10, 4395–4402 CAS.
- J. Zhou, T. Zhu, W. Xing, Z. Li, H. Shen and S. Zhuo, Electrochim. Acta, 2015, 160, 152–159 CrossRef CAS.
- O. Ioannidou and A. Zabaniotou, Renewable Sustainable Energy Rev., 2007, 11, 1966–2005 CrossRef CAS.
- G. Wang, Z. Ling, C. Li, Q. Dong, B. Qian and J. Qiu, Electrochem. Commun., 2013, 31, 31–34 CrossRef CAS.
- B. Xu, Y. Chen, G. Wei, G. Cao, H. Zhang and Y. Yang, Mater. Chem. Phys., 2010, 124, 504–509 CrossRef CAS.
- H. Deng, G. Zhang, X. Xu, G. Tao and J. Dai, J. Hazard. Mater., 2010, 182, 217–224 CrossRef CAS PubMed.
- H. Sayğılı and F. Güzel, J. Cleaner Prod., 2016, 113, 995–1004 CrossRef.
- J. Ludwinowicz and M. Jaroniec, Carbon, 2015, 94, 673–679 CrossRef CAS.
- S.-H. Park, S.-M. Bak, K.-H. Kim, J.-P. Jegal, S.-I. Lee, J. Lee and K.-B. Kim, J. Mater. Chem., 2011, 21, 680–686 RSC.
- S. Urbonaite, L. Hälldahl and G. Svensson, Carbon, 2008, 46, 1942–1947 CrossRef CAS.
- G. Sun, D. Long, X. Liu, W. Qiao, L. Zhan, X. Liang and L. Ling, J. Electroanal. Chem., 2011, 659, 161–167 CrossRef CAS.
- Y. J. Oh, J. J. Yoo, Y. I. Kim, J. K. Yoon, H. N. Yoon, J.-H. Kim and S. B. Park, Electrochim. Acta, 2014, 116, 118–128 CrossRef CAS.
- A. E. Ismanto, S. Wang, F. E. Soetaredjo and S. Ismadji, Bioresour. Technol., 2010, 101, 3534–3540 CrossRef CAS PubMed.
- K. Wang, N. Zhao, S. Lei, R. Yan, X. Tian, J. Wang, Y. Song, D. Xu, Q. Guo and L. Liu, Electrochim. Acta, 2015, 166, 1–11 CrossRef CAS.
- Y. Liu, Z. Shi, Y. Gao, W. An, Z. Cao and J. Liu, ACS Appl. Mater. Interfaces, 2016, 8, 28283–28290 CAS.
- A. Bello, N. Manyala, F. Barzegar, A. A. Khaleed, D. Y. Momodu and J. K. Dangbegnon, RSC Adv., 2016, 6, 1800–1809 RSC.
- G. Ma, Q. Yang, K. Sun, H. Peng, F. Ran, X. Zhao and Z. Lei, Bioresour. Technol., 2015, 197, 137–142 CrossRef CAS PubMed.
- D. Saha, Y. Li, Z. Bi, J. Chen, J. K. Keum, D. K. Hensley, H. A. Grappe, H. M. Meyer 3rd, S. Dai, M. P. Paranthaman and A. K. Naskar, Langmuir, 2014, 30, 900–910 CrossRef CAS PubMed.
- J. Chmiola, G. Yushin, Y. Gogotsi, C. Portet, P. Simon and P. L. Taberna, Science, 2006, 313, 1760–1763 CrossRef CAS PubMed.
- L. Borchardt, M. Oschatz and S. Kaskel, Mater. Horiz., 2014, 1, 157–168 RSC.
- B. Xu, S. Hou, H. Duan, G. Cao, M. Chu and Y. Yang, J. Power Sources, 2013, 228, 193–197 CrossRef CAS.
- Y. Zhao, M. Liu, L. Gan, X. Ma, D. Zhu, Z. Xu and L. Chen, Energy Fuels, 2014, 28, 1561–1568 CrossRef CAS.
- Y. Zhao, M. Liu, X. Deng, L. Miao, P. K. Tripathi, X. Ma, D. Zhu, Z. Xu, Z. Hao and L. Gan, Electrochim. Acta, 2015, 153, 448–455 CrossRef CAS.
- T. Thomberg, T. Tooming, T. Romann, R. Palm, A. Jänes and E. Lust, J. Electrochem. Soc., 2013, 160, A1834–A1841 CrossRef CAS.
- E. Raymundo-Piñero, K. Kierzek, J. Machnikowski and F. Béguin, Carbon, 2006, 44, 2498–2507 CrossRef.
- X. Li, W. Xing, S. Zhuo, J. Zhou, F. Li, S. Z. Qiao and G. Q. Lu, Bioresour. Technol., 2011, 102, 1118–1123 CrossRef CAS PubMed.
- D. Kalpana, S. Cho, S. Lee, Y. Lee, R. Misra and N. Renganathan, J. Power Sources, 2009, 190, 587–591 CrossRef CAS.
- P. González-García, T. A. Centeno, E. Urones-Garrote, D. Ávila-Brande and L. C. Otero-Díaz, Appl. Surf. Sci., 2013, 265, 731–737 CrossRef.
- J. M. Nabais, J. G. Teixeira and I. Almeida, Bioresour. Technol., 2011, 102, 2781–2787 CrossRef PubMed.
Footnote |
| † These authors did same contribution to this work. |
| This journal is © The Royal Society of Chemistry 2018 |

