Au nanoparticles confined in self-assembled Zn(II) metal–organic cubane cages for light-driven conversion of furfural to 2-methyl furan in biofuel production†
Sahil
Thakur
 ab,
Jyoti
Rohilla
a,
Keshav
Kumar
 a,
Raghubir
Singh
*b,
Varinder
Kaur
 *a and
Raman
Kamboj
b
aDepartment of Chemistry, Panjab University, Sector-14, Chandigarh-160014, India. E-mail: var_ka04@yahoo.co.in; var_ka04@pu.ac.in
bDepartment of Chemistry, DAV College, Sector 10, Chandigarh-160011, India. E-mail: raghubirsingh@davchd.ac.in; raghu_chem2006@yahoo.com
First published on 12th December 2023
Abstract
A polyoxometalate Zn(II) cubane cage with intrinsic confined spaces constructed by the self-assembly of tetrametallic cubane clusters was obtained and utilized as a skeletal support for the encapsulation of gold nanoparticles. AuNP-encapsulated Zn(II) cubane cages (ZnCC@AuNPs) were characterized using FTIR, TGA, BET, SEM, TEM, XPS, and PXRD analysis. The catalytic activity of ZnCC@AuNPs for the hydrogenation of furfural to 2-methyl furan, which is an active precursor for biofuel production, was investigated. The anchored AuNPs generate Au–H species under visible light and catalyse the reaction in 2-propanol at 60 °C, yielding >99% of the product in just 1.5 h. The reaction kinetics and mechanism were confirmed by in situ ATR-IR and DFT studies. The parameter optimization suggested exceptional chemical stability and reusability of ZnCC@AuNPs as a catalyst without any agglomeration even after several cycles of use. These intriguing features are suitable for developing sustainably viable catalysts for the biomass refinery industry.
1. Introduction
The self-assembly of metal–organic cages produces porous frameworks that can serve as molecular containers in supramolecular catalysis.1 These cages can tune the reactivity of molecules by encapsulating the reacting species inside the cavities or by confining the catalytic sites. In particular, in metal–organic cubane cages, the rigidity and strength provided by the organic pillars make them versatile frameworks that can withstand harsh conditions and provide interactive sites for holding various species.2 This type of metal–organic cage has been reported in the past for catalysing particular reactions like silyl(bis)amido ligand [{Ph2Si(NAr*)2Zn(HMDS)}−{Na(THF)6}+] (Ar* = 2,6-diisopropylphenyl) for enolate formation,3 Zn cage {[Zn4(TBSC)(μ4-OH)]4-(5-Me-im-1,3-BDC)+8Cl−8}(DMF)10(CH3OH)15(H2O)23 for CO2 conversion reactions,4 [{Cu12(TMBTA)8(DMA)4(H2O)8}·8H2O·X] (where TMBTA is (2,4,6-trimethylbenzene)-1,3,5-triacetic acid) for the aerobic oxidation of benzyl alcohol to benzaldehyde,5 and Cu3L2 copper cage for A3-coupling reaction to generate propargylamines.6 The catalytic activity of these cages can be enhanced by combining them with metal nanoparticles, which have exposed surfaces for generating active species and intermediates. The physicochemical features of metal nanoparticles are different from their parent forms and are incompatible with standard encapsulation procedures. Furthermore, unique surface properties, high surface energy, and a tendency to agglomerate in the solution phase make encapsulation a strenuous task.7,8 However, limited reports are available on the encapsulation of metal nanoparticles in metal–organic cages due to the non-compatibility of the cavity size.Plasmonic nanoparticles like Au, Ag, and Pt have emerged as promising materials due to their surface plasmon resonance effect and ability to harness visible light.9 Cu nanoparticles also exhibit a plasmon resonance effect but they are not as pronounced as noble metals. Moreover, controlling the size and dispersion of copper nanoparticles is comparatively difficult due to their high reactivity. They are more susceptible to oxidation and their stability in aqueous systems is an important concern, especially in air or oxygen-rich environments.10 Gold nanoparticles can act as catalysts in various oxidation and reduction reactions due to their unique electronic structures. However, they require suitable support to work heterogeneously11 as they undergo agglomeration and show decreased catalytic activity.12 Earlier, some COFs, derived by reacting phenothiazine-based trialdehyde with 1,2-cyclohexanediamine13 and benzene-1,3,5-tricarbaldehyde with 1,2-cyclohexanediamine,14 and MOFs like Sn–Na MOF15 and UiO-66 MOF16 and multiwalled carbon nanotubes17 have been reported as supports for holding noble metal nanoparticles. Self-assembled cages, macrocycles, polymers, and various other supramolecular structures derived from metallo-ligands constitute a prominent class with confined cavities inside the molecular frameworks and interactive functional sites.18 Among these, the development of Zn(II) based cages has expanded the applications of inorganic molecules due to their versatile stereochemical properties, capability to form complexes with numerous ligands and catalytic potential.19 Therefore, Zn(II) cubane cages can be considered as suitable structures to sustain gold nanoparticles for stabilization and improve catalytic efficiency.
Herein, we report a self-assembled Zn(II) metal–organic cubane cage embedded with Au nanoparticles for the selective conversion of furfural to 2-methyl furan. 2-Methyl furan is essential for many scientific and industrial processes such as the synthesis of organic compounds, formation of biofuels, and production of flavours and fragrances.20 The selective hydrogenation of biomass-derived furfural can produce 2-methyl furan as one of the constituents of various value-added products (like furfuryl alcohol and cyclopentanone). The increasing biofuel demand owing to the depletion of fossil fuels has prompted the upgradation of renewable biomass into chemicals and biofuels for a sustainable future and lignocellulosic biomass can provide affordable and sustainable alternatives.21 In the past, a variety of catalysts, including CuRe/Al2O3, Cu2.5ZnAl-600, CuFe2O4, iridium/carbon, Cu–Fe, Cu/ZnO, and Cu–Co/Al2O3, have been employed for the catalytic hydrogenation of furfural to 2-methylfuran but under harsh conditions and challenging protocols.22–29 Moreover, the yield of 2-methylfuran is usually low because of the formation of various by-products such as tetrahydrofurfuryl alcohol and furan derivatives. However, the developed Zn(II)-based cubane-like oxo-cluster with small-sized pockets on self-assembly occupied by gold nanoparticles (AuNPs) provides excellent outputs for converting the biomass into 2-methylfuran in the present work. The catalytic hydrogenation of biomass-derived furfural to 2-methylfuran can be achieved in 1.5 h under mild reaction conditions by using 2-propanol. This is better than the classical hydrogenation methods where the direct addition of H2 gas is required in the presence of a hydrogenation catalyst. The developed ZnCC@AuNPs composite is a pioneering example of gold nanoparticles supported within a metal cage, proving its practical application in biofuel production for the first time.
2. Experimental
2.1 Materials and methods
The compounds were synthesized using the Schlenk technique. 5-Bromo-2-hydroxybenzaldehyde, ethanol amine and furfural were procured from Aldrich, USA. Sodium borohydride, sodium hydroxide, triethylamine, zinc nitrate hexahydrate, and gold chloride trihydrate were procured from SRL, India, in high purity. The solvents methanol, 2-propanol, and toluene (Finar, India) were dried using standard procedures. The reduced Schiff base (rSB) was synthesized using the procedure reported in our previous report.302.2 Instrumentation
The FT-IR spectra, solution-phase NMR spectra (comprising 1H and 13C NMR spectra), and mass spectrometry measurements were conducted using the following instruments: BRUKER alpha Eco-ATR spectrometer, BRUKER AVANCE 500-NMR spectrometer, and VG Analytical (70-S) spectrometer, which was equipped with an ESI source operating at a capillary voltage of 2500 V. The crystallographic data for the single crystal of the compound were collected at 165 K using a Rigaku XTA Lab SuperNova with Mo Kα radiation (λ = 0.71073). The crystal structure was solved using Olex2 software, utilizing the intrinsic phasing method of the ShelXT structure solution program. Subsequently, the structure was refined using the least-squares method, which was integrated into the ShelXL refinement package.31,32 For structural optimization and frequency calculations, density functional theory (DFT) was employed using Gaussian 16 software.33 Becke's three-parameter hybrid correlation functional B3LYP was applied, along with the 6-31+G(d,p) and LanL2DZ basis set, for the geometry optimization process.34 A Waters 2998 System, which consisted of a photodiode array detector and a binary HPLC pump with a Supelco Analytical C18 column (25 cm × 4.6 mm × 5 μm) was utilized for the analysis.2.3 Synthetic procedures
Yield (crystals): 32.34% (3.20 g, 2.62 mmol). FT-IR (KBr) cm−1: 3432 (N–H), 2900–2750 (CH2), 1586, 1472 (C–C), 1282 (C–N), 1180 (C–O), 641 (C–Br), 548 (Zn–O). 1H-NMR (500 MHz, DMSO-d6): δ (ppm) 2.78 (8H, broad singlet, H8), 3.62 (8H, broad singlet, H9), 3.80 (8H, s, H7), 4.15 (4H, s, –NH), 6.48 (4H, broad singlet, H2), 7.11 (8H, broad singlet, H3, H5); ESI-MS (m/z): 647.49 [M/2 + H]+.
2.4 Product analysis
The product was analysed for the formation of 2-methyl furan by HPLC-PDA system using an isocratic method with ACN![[thin space (1/6-em)]](https://www.rsc.org/images/entities/char_2009.gif) :
:![[thin space (1/6-em)]](https://www.rsc.org/images/entities/char_2009.gif) MeOH/75
MeOH/75![[thin space (1/6-em)]](https://www.rsc.org/images/entities/char_2009.gif) :
:![[thin space (1/6-em)]](https://www.rsc.org/images/entities/char_2009.gif) 25 (%) as the solvent flowing at a rate of 0.8 mL min−1. The following equations were employed to calculate the selectivity (%) of 2-methyl furan and the conversion (%) of furfural:
25 (%) as the solvent flowing at a rate of 0.8 mL min−1. The following equations were employed to calculate the selectivity (%) of 2-methyl furan and the conversion (%) of furfural:In these equations, C2-MF and CTotal
![[thin space (1/6-em)]](https://www.rsc.org/images/entities/char_2009.gif) products represent the concentrations of 2-methylfuran and total products, respectively, at a specific reaction time (t). CFur° denotes the initial concentration of furfural before the reaction.
products represent the concentrations of 2-methylfuran and total products, respectively, at a specific reaction time (t). CFur° denotes the initial concentration of furfural before the reaction.
3. Results and discussion
3.1 Synthesis and characterization of the Zn(II) cubane cage
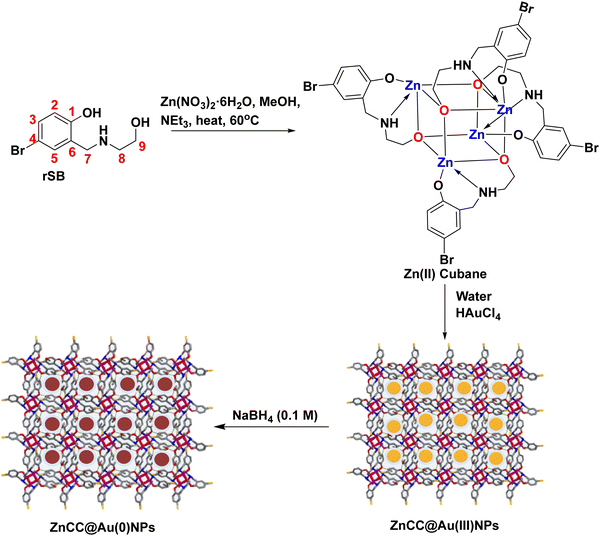
A tridentate ligand (rSB) was synthesized by the Schiff base condensation of 5-bromosalicaldehyde and ethanolamine followed by reduction using NaBH4 in methanol. The reaction of rSB with zinc nitrate hexahydrate in the presence of triethylamine (as a base) in methanol yielded a Zn(II) cage consisting of Zn4O4 cubanes with coordinated ligand pendants as side bridges (Scheme 1).The Zn(II) cubane cage was characterized using FTIR, 1H NMR, and ESI-MS. The FT-IR spectrum of rSB showed a strong band at 3413 cm−1 due to N–H stretching and a broad band in the region 3300–2960 cm−1 due to O–H stretching. However, the band in the region 3470–3400 cm−1 due to N–H stretching was broadened in the case of Zn(II) cubane, and the O–H stretch disappeared showing coordination of the ligand via NH and deprotonated –OH. Besides, a strong band at 624 cm−1 and a weak band at 479 cm−1 were observed due to C–Br stretching and Zn–O stretching, respectively. The 1H-NMR spectrum of rSB in DMSO-d6 showed the appearance of a singlet at 3.80 ppm due to the –CH2 protons (H7). The NH proton appearing at 5.92 ppm merged with the signal of the alcoholic OH. In Zn cubane, triplets of H8 and H9 merged into a broad singlet at 2.78 and 3.62 ppm, respectively. The NH signal was seen as a singlet at 4.15 ppm and aromatic signals showing doublet (H2), doublet of doublet (H3) and doublet (H5) in rSB were transformed into singlets at 6.48 ppm for H2 and 7.11 ppm for H3 and H5. The ESI-MS for Zn cubane exhibited a [M/2 + H]+ peak at m/z 647.49 (see ESI,† Fig. S1–S3).
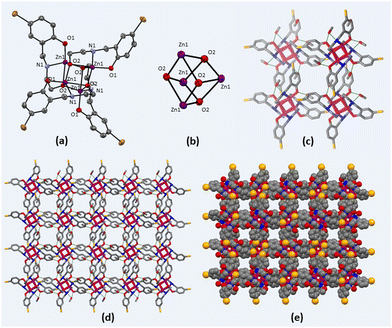
Zn(II) cubane was obtained in crystalline form by cooling the reaction mixture. The structure of Zn(II) cubane was elucidated by single-crystal X-ray diffraction. Table S1 (ESI†) provides a summary of the crystallographic data and structure refinement parameters, while Table S2 (ESI†) presents selected measurements of the bond lengths and bond angles. The Zn(II) cubane crystallized in the tetragonal space group I41/a. It consists of a distorted cubane-like cavity formed by joining the Zn and O atoms of four asymmetric units on the alternate corners of the cube. Each Zn atom was coordinated to five atoms by a nitrogen atom, aryl oxygen, and alkoxide oxygen atom of one ligand and alkoxide oxygen donors of two other ligands. Overall, the Zn(II) atoms showed distorted trigonal bipyramidal geometry, where all four ligands were coordinated in μ3-η1:η1:η3 bridging mode with alkoxide oxygen coordinated in η3 mode with Zn(II) centres. The Zn–N, Zn–O1 and Zn–O2 bond lengths were in the usual ranges of 1.479, 1.965 and 2.428 Å, respectively (Fig. 1). The Zn(II) cubane was crystallized as a methanol solvate, which created hydrogen-bonded self-assembly with other cubane units generating voids ranging from 1.6 to 1.8 nm. This type of hydrogen-bonded cage is produced by the solvation of building blocks due to the prevalent force of hydrogen bonds.1
3.2 Synthesis and characterization of ZnCC@AuNPs
The encapsulation of nanoparticles is important for catalytic applications because it enhances surface activity and stability and prevents aggregation. However, the encapsulation of gold nanoparticles in a protective Zn(II) cage is challenging as it requires Au-supportive interactions. Further, the generation of the appropriate cavity for encapsulation depends upon the geometry of the cage, the arrangement of metal ions and the choice of ligands. Schiff base ligands serve as excellent supporting molecules for such materials because they can be derived with the desired number of functionalities through a highly efficient and straightforward synthesis.35,36 Reduced Schiff bases are more flexible than Schiff base complexes due to the absence of π-conjugation, which may allow them to attain any geometry.37 Here, the flexibility and multidenticity of the ligand led to the construction of the Zn(II) cubane cage with a small-sized A-type cavity. The cubane units self-assembled to form a framework equipped with B-type cavities. The appropriate size of the B-type cavities facilitated the encapsulation of Au nanoparticles. To gain insight into the size, shape, composition, encapsulation, and surface properties of ZnCC@AuNPs, various studies like FTIR, TGA, 1H NMR, BET, SEM, TEM, XPS, and PXRD analyses were conducted.The FT-IR spectrum of ZnCC@AuNPs was found to be similar to that of Zn(II) cubane showing a strong vibrational band in the region 3500–3200 cm−1 for N–H stretching and O–H stretching. Additional bands consisting of strong split vibrational bands centred at 1600 and 1637 cm−1 due to C![[double bond, length as m-dash]](https://www.rsc.org/images/entities/char_e001.gif) C stretching, a strong band at 621 cm−1 due to C–Br and a weak band at 480 cm−1 due to Zn–O stretching were also observed in the region similar to that of Zn(II) cubane (Fig. 2a). Two weak vibrational bands were also observed at 1474 cm−1 and 1386 cm−1 for C–H bending and C–N stretching, respectively, for both Zn(II) cubane and ZnCC@AuNPs. This revealed that the incorporation of AuNPs barely changed the structural framework and chemical composition of Zn(II) cubane.
C stretching, a strong band at 621 cm−1 due to C–Br and a weak band at 480 cm−1 due to Zn–O stretching were also observed in the region similar to that of Zn(II) cubane (Fig. 2a). Two weak vibrational bands were also observed at 1474 cm−1 and 1386 cm−1 for C–H bending and C–N stretching, respectively, for both Zn(II) cubane and ZnCC@AuNPs. This revealed that the incorporation of AuNPs barely changed the structural framework and chemical composition of Zn(II) cubane.
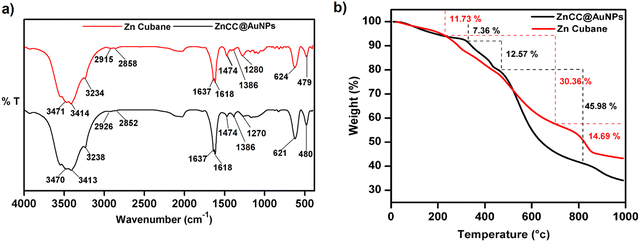 | ||
| Fig. 2 (a) A comparison of FT-IR spectra of Zn(II) cubane and ZnCC@AuNPs. (b) TGA thermogram of Zn(II) cubane and ZnCC@AuNPs. | ||
The thermal stabilities of Zn(II) cubane and ZnCC@AuNPs were studied using thermogravimetric analysis (Fig. 2b). Weight losses of 11.73% and 7.36% were observed in the first step in the thermograms of Zn(II) cubane and ZnCC@AuNPs, respectively, up to 200 °C, which is generally due to the loss of absorbed water or solvent (methanol). Weight losses of 30.36% and 45.98% were observed in the second step when the temperature was increased from 200 to 800 °C, which may be attributed to the decomposition of the organic framework of Zn(II) cubane and ZnCC@AuNPs, respectively. The third weight loss of 14.69% can be related to the formation of the metal residue ZnO when the temperature was increased above 800 °C.
The 1H NMR spectra of Zn(II) cubane and ZnCC@AuNPs were compared. The 1H NMR spectrum of Zn(II) cubane showed a significant shift in the N–H proton and broadening of alkyl and aromatic protons due to the complexation of Zn(II) with the ligand. The broadening may be attributed to the limited mobility with rapid spin relaxation of skeletal protons in the complex.38,39 The 1H NMR spectra of ZnCC@AuNPs showed a shift in the N–H proton signal from 4.15 ppm to 3.81 ppm, thus validating the increase in the electron density due to the binding of AuNPs. Although this suggested the presence of AuNPs inside the cage skeleton, the solvent effect cannot be ignored at the same time (see ESI,† Fig. S4).
Nitrogen gas adsorption–desorption isotherms were used to study the adsorption properties of Zn(II) cubane and ZnCC@AuNPs. The BET and the BJH models were used to compute the specific surface area and pore size distribution of Zn(II) cubane and ZnCC@AuNPs. The adsorption–desorption isotherms exhibited an H3 hysteresis loop suggesting the porous nature of the material. The surface area and pore volume of the Zn(II) cubane were calculated to be 19.107 m2 g−1 and 4.390 cm3 g−1, respectively. However, after the incorporation of gold, the surface area and pore volume decreased to 2.321 m2 g−1 and 0.5066 cm3 g−1, respectively (see ESI,† Fig. S5a and b). The N2 sorption isotherm of ZnCC@AuNPs exhibited a gradual decrease in both surface area and pore volume, suggesting the blockage of cavities due to the encapsulation of Au nanoparticles in the vacant spaces. The BJH results of Zn(II) cubane and ZnCC@AuNPs showed main peaks at 7.14 nm and 3.65 nm, respectively, for the pore size (see ESI,† Fig. S5c and d). The significant reduction in the pore size of the Zn(II) cubane also confirmed the occupancy of cavities by the Au nanoparticles.
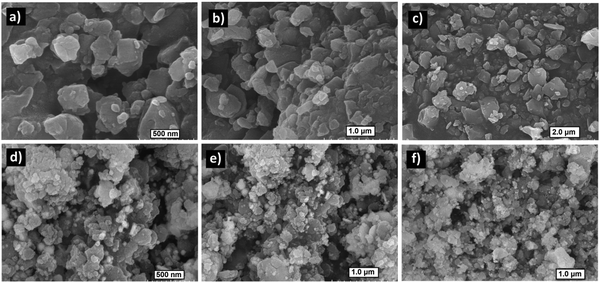
Field emission scanning electron microscopy (FE-SEM) images of Zn(II) cubane revealed a flaky material exhibiting a rough morphology (Fig. 3a–c). However, the infusion of spherical particles was visible in the flakes of ZnCC@AuNPs, confirming the presence of Au nanoparticles (Fig. 3d–f). However, Au nanoparticles were observed over the surface of the flakes, which may be attributed to the agglomeration of larger particles (>1.60 nm) during sample preparation, preventing their entry into the pores. The elemental mapping confirmed that the composition of the cubane cage consisted of C, H, N, Br, and Zn in the Zn(II) cubane and the inclusion of Au in the ZnCC@AuNPs cage. This revealed a symmetrical distribution of each composite on the surface of Zn(II) cubane and ZnCC@AuNPs (see ESI,† Fig. S6).
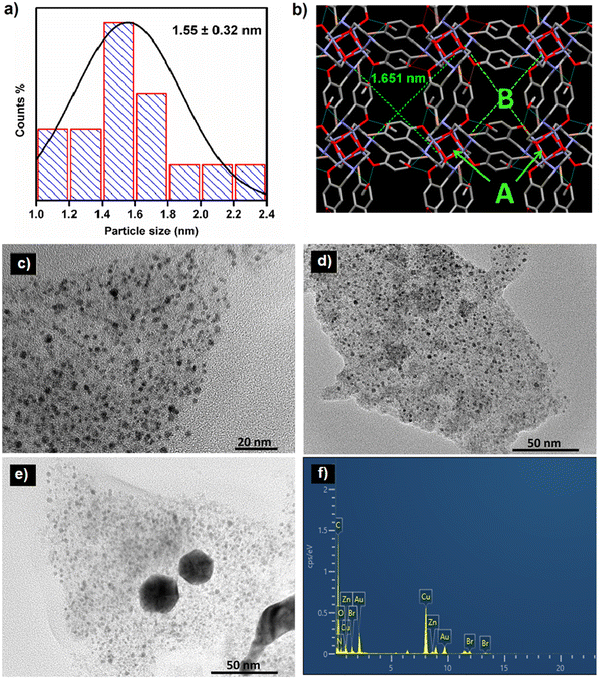
The size and morphology of the synthesized ZnCC@AuNPs were studied by transmission electron microscopy (TEM). The size distribution calculated from the TEM images revealed the formation of Au nanoparticles with an average particle diameter of 1.55 nm (Fig. 4a). The single-crystal X-ray diffraction data revealed the presence of Zn(II) cubane units with cavity ‘A’ of length 0.3 nm. These units further unite to form self-assembly that creates voids ‘B’ with a length of 1.651 nm. It can be inferred from the size distribution studies that only void B can provide appropriate space to accommodate Au nanoparticles and the spaces inside the cubane units (cavity A) are not approachable for particles of 1.55 nm in diameter (Fig. 4b).14 The dynamic light scattering (DLS) study supported the formation of Au nanoparticles in a narrow size distribution range with a mean particle size of 1.2 nm (see ESI,† Fig. S7).
The mass loading % of HAuCl4 was optimized by varying the concentration of HAuCl4. This resulted in the formation of nanoparticles with a size range of 1.4–2.1 nm and 20–25 nm for concentrations of 16.48 mM and 25.0 mM, respectively (Fig. 4c and d). The increase in the concentration of HAuCl4 resulted in increased particle size due to the production of quasi-spherical nanoparticles with a much larger size distribution of 20–25 nm (Fig. 4e). Energy dispersive X-ray analysis (EDAX) measurements of ZnCC@AuNPs were carried out to illustrate the presence of Au nanoparticles in the Zn(II) cubane. The EDAX spectrum shows the coexistence of C, N, O, Br, Zn and Au in the material (Fig. 4f).
X-ray photoelectron spectroscopy (XPS) studies of ZnCC@AuNPs revealed the presence of Au in the zero oxidation state as designated by its characteristic binding energy values of 87.7 eV and 83.9 eV corresponding to two distinct spin–orbit pairs 4f5/2 and 4f7/2, respectively (Fig. 5a). The peak area ratio for spin–orbit pairs Au(0) 4f5/2![[thin space (1/6-em)]](https://www.rsc.org/images/entities/char_2009.gif) :
:![[thin space (1/6-em)]](https://www.rsc.org/images/entities/char_2009.gif) 4f7/2 is 1
4f7/2 is 1![[thin space (1/6-em)]](https://www.rsc.org/images/entities/char_2009.gif) :
:![[thin space (1/6-em)]](https://www.rsc.org/images/entities/char_2009.gif) 0.5. Also, there is one weak spin–orbit pair at 89.9 eV and 84.4 eV corresponding to the Au(III) state. The peak area ratio for spin–orbit pairs Au(III) 4f5/2, 4f7/2 is 0.32 and 0.16 compared to Au(0) 4f5/2. The Zn 2p in Zn cubane and ZnCC@AuNPs showed intense peaks at binding energies of around 1045 eV and 1021 eV corresponding to two distinct spin–orbit pairs 2p1/2 and 2p3/2, respectively (Fig. 5b and c). Additionally, the XPS spectra of C 1s, O 1s, Br 3d and N 1s of Zn(II) cubane and ZnCC@AuNPs were found as expected (given in the ESI†) (see Fig. S8 and S9).
0.5. Also, there is one weak spin–orbit pair at 89.9 eV and 84.4 eV corresponding to the Au(III) state. The peak area ratio for spin–orbit pairs Au(III) 4f5/2, 4f7/2 is 0.32 and 0.16 compared to Au(0) 4f5/2. The Zn 2p in Zn cubane and ZnCC@AuNPs showed intense peaks at binding energies of around 1045 eV and 1021 eV corresponding to two distinct spin–orbit pairs 2p1/2 and 2p3/2, respectively (Fig. 5b and c). Additionally, the XPS spectra of C 1s, O 1s, Br 3d and N 1s of Zn(II) cubane and ZnCC@AuNPs were found as expected (given in the ESI†) (see Fig. S8 and S9).
PXRD analysis of Zn(II) cubane was performed to determine the purity and crystallinity of the bulk material. The PXRD pattern of the Zn(II) cubane obtained experimentally showed similarity with the predicted pattern obtained from Mercury 3.8, demonstrating the rational crystalline phase purity of the bulk sample (see ESI,† Fig. S10a). Similarly, the ZnCC@AuNPs showed strong diffraction peaks at 38.14° and 44.29°, which correspond to the (111) and (200) lattice planes, respectively. These lattice planes are typical of Au with a face-centred cubic (fcc) structure (see ESI,† Fig. S10b).
The UV absorption spectrum of ZnCC@AuNPs exhibited a new band centred at 530 nm due to localized surface plasmon resonance (LSPR) (see ESI,† Fig. S11b). A Tauc plot was employed to determine the band gap energy of ZnCC@AuNPs, using the relationship (αhν)2 = hν − Eg, where α and Eg represent the absorption coefficient and the energy gap of the semiconductor, respectively. The resulting linear fit of (αhν)2versus photon energy (hν) provided the band gap values of 1.93 and 3.17 eV for ZnCC@AuNPs due to AuNPs and Zn(II), respectively (Fig. 6a). To understand the enhanced photocatalytic activity of ZnCC@AuNPs compared to that of Zn(II) cubane, electrochemical impedance spectroscopy (EIS) was conducted. The Nyquist plot revealed a significantly smaller arc for ZnCC@AuNPs than for Zn(II) cubane, indicating a lower charge-transfer resistance and faster interfacial charge-transfer rate (Fig. 6b). Photoluminescence investigations demonstrated a similar characteristic band for Zn(II) cubane and ZnCC@AuNPs. However, the emission band intensity centred at 450 nm was notably lower for ZnCC@AuNPs, suggesting reduced electron/hole pair recombination and superior photocatalytic activity (Fig. 6c). The unique optical properties of gold nanoparticles, specifically the surface plasmon effect in gold-doped materials, contribute to their interaction with fluorescence.40 Comparable photoluminescence responses were observed for Au–ZnO nanocomposites with ZnO nanorods.41 The association of Zn(II) cubane with Au ions in ZnCC@AuNPs resulted in improved LSPR, enhanced charge transfer, and consequently superior photocatalytic efficiency.
3.3 Catalytic conversion of furfural
The conversion of furfural to 2-methylfuran is an important reaction in the biofuel industry. The selectivity and yield of the reaction depend on different variables like the effect of the metal, catalyst loading, reaction temperature and solvent. The solvent plays a unique catalytic role in the hydrogenation of furfural which cannot be ignored because the reaction is in the liquid phase. Previous reports confirmed that nonpolar solvents (i.e. toluene) lower the rate of the hydrogenation reaction and water renders the decarbonylation of furfural alcohol to 2-methylfuran. Therefore, the use of polar solvents like methanol (MeOH), ethanol (EtOH) and isopropanol (i-PrOH) is a wise selection as they donate hydrogen for furfural hydrogenation. In addition, the hydrogenation of furfural to 2-methylfuran in the presence of toluene and water was not catalysed by the developed ZnCC@AuNP catalyst (Table 1). However, 100% conversion of furfural was observed in i-PrOH followed by 30% in methanol and 28% in ethanol. The variation in the catalyst amount from 5 mg to 12 mg suggested that 10 mg of ZnCC@AuNPs was sufficient for 100% conversion of the chosen amounts of furfural (1.0 g, 10.40 mmol) into 2-methylfuran. By decreasing the amount of ZnCC@AuNPs from 10 mg to 5 mg, the conversion rate decreases from 100% to 64%. It can be inferred that the lower amounts of ZnCC@AuNPs could not generate sufficient H+ for the complete hydrogenation of furfural to 2-methylfuran.| S. no. | Catalyst amount (mg) | Solvent | Temperature (°C) | Time (min) | Conversion (%) | Selectivity (%) | |
|---|---|---|---|---|---|---|---|
| 2-MF | FR | ||||||
| Reaction conditions: visible light, furfural (10.40 mmol), NaOH (2.07 mmol), solvent (15 mL).a Reaction conditions: dark, furfural (10.40 mmol), NaOH (2.07 mmol), solvent (15 mL). *2-MF = 2-methyl furan, FR = furan, i-PrOH = 2-propanol, H2O = water, Tol = toluene, MeOH = methanol, EtOH = ethanol, NR = no result. | |||||||
| 1. | 0 | i-PrOH | 60 | 90 | 36 | >99 | — |
| 2. | 5 | i-PrOH | 60 | 90 | 64 | >99 | — |
| 3. | 8 | i-PrOH | 60 | 90 | 94 | >99 | — |
| 4. | 10 | i-PrOH | 30 | 60 | 62 | >99 | — |
| 5. | 10 | i-PrOH | 60 | 60 | 100 | 97 | — |
| 6. | 10 | i-PrOH | 60 | 90 | 100 | >99 | — |
| 7. | 12 | i-PrOH | 60 | 120 | 100 | 98.40 | 1.59 |
| 8. | 10 | i-PrOH | 100 | 120 | 100 | 97.90 | 2.10 |
| 9. | 10 | i-PrOH | 120 | 120 | 100 | 97.30 | 2.70 |
| 10. | 10 | i-PrOH | 150 | 120 | 100 | 97.10 | 2.90 |
| 11. | 12 | i-PrOH | 150 | 120 | 100 | 96.90 | 3.10 |
| 12. | 10 | H2O | 60 | 90 | 0 | NR | — |
| 13. | 10 | Tol | 60 | 90 | 0 | NR | — |
| 14. | 10 | MeOH | 60 | 90 | 30 | > 99 | — |
| 15. | 10 | EtOH | 60 | 90 | 28 | >99 | — |
| 16. | 10 | i-PrOH | 60 | 90 | 40a | >99 | — |
The impact of temperature on the hydrogenation process was examined within a temperature range of 30 °C to 150 °C while keeping the other reaction conditions the same. The temperature change resulted in variations in the product yield due to the formation of two products 2-methylfuran and furan. When the reaction was carried out at 60 °C, 100% conversion of furfural with >99% of 2-methylfuran was achieved. However, by increasing both the amount of catalyst and the temperature, the furan yield increased from 1.59% to 3.10% (see ESI,† Fig. S12). This increase can be attributed to the increase in the surface area of gold, which facilitates the decarbonylation process. These findings indicate that the hydrogenation of the aldehyde group proceeded effectively under relatively mild conditions with 60 °C being identified as the optimal temperature. Further, the reaction was carried out in the dark in the presence of ZnCC@AuNPs under identical reaction conditions and only the conversion of 40% 2-methyl furan was detected. A summary of the results is presented in Table 1. The formation of 2-methylfuran was analyzed using 1H and 13C NMR spectroscopy (see ESI,† Fig. S13 and S14), as well as the HPLC-PDA method where a peak was detected at a retention time of 3.42 min (see ESI,† Fig. S15). A time-scaled UV-visible spectrophotometric experiment (0–90 min) was performed to monitor the progress of the catalytic transformation reaction under the optimized conditions (see ESI,† Fig. S16). The intensity of the absorption band at 274 nm corresponding to furfural showed a significant decrease with time, indicating the consumption of furfural during the conversion. Consequently, a new absorption band appeared at 326 nm, indicating the formation of 2-methylfuran. Table S3 (ESI†) summarises a literature review of several catalysts employed in the catalytic hydrogenation of furfural to 2-methylfuran. The prepared ZnCC@AuNP catalyst gprovided the mildest reaction conditions for the complete conversion of furfural into 2-methylfuran.
3.4 Heterogeneity, recyclability studies and leaching tests
The reusability of ZnCC@AuNPs as a catalyst for the hydrogenation of furfural to 2-methylfuran was examined under optimized conditions. After each reaction cycle, the recovered catalyst powder was washed with ethanol and then dried. The selectivity of the catalyst for the formation of 2-methyl furan was maintained for up to five consecutive reaction runs (see ESI,† Fig. S17). However, the catalytic hydrogenation activity gradually decreased, with a decrease in the conversion % from 99.9% to 88.6% in the fifth run. This decrease is due to a minor loss of the catalyst during the recovery procedure, i.e. separation and washing processes. A loss of 1.6 mg was observed over five catalytic cycles, which reduced the conversion.3.5 Mechanism
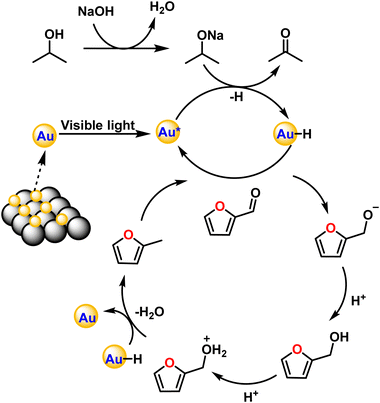
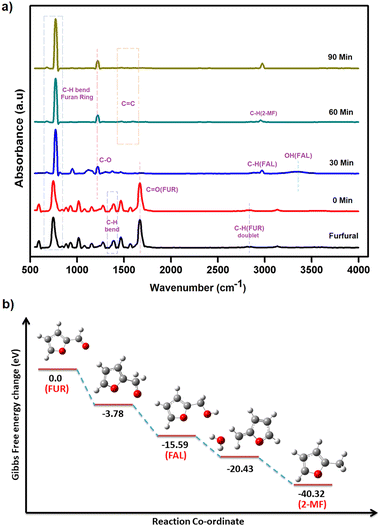
The exact route of catalysis was investigated based on literature reports, in situ ATR-IR kinetic studies, and computational studies. First, NaOH abstracts hydrogen from 2-propanol to form sodium isopropoxide. Consecutively, light is absorbed by AuNPs due surface plasmon resonance effect which excites electrons from the valence band to the conduction band. This electron transfers to isopropoxide, which loses H− and results in the formation of Au–H species leaving acetone as an oxidized product.42 The surface hydride is transferred to furfural yielding furfuryl alcohol as an intermediate after the supply of H+ ions. Further, the transfer of hydrides leads to the formation of 2-methyl furan and water as a side product (Fig. 7). The C–C bond cleavage is usually observed as a side reaction during the hydrogenation of furfural and the decarbonylation reaction is frequently observed as a side reaction on the surface of metal catalysts. Decarbonylation involves adsorption of species on the metal surface, where both the furan ring and the formyl group strongly interact with the metal atoms resulting in the formation of furan and the side product carbon monoxide.ATR-IR spectra were recorded in situ during the catalytic hydrogenation of furfural under optimized conditions at regular intervals of 30 min. The IR spectrum of furfural exhibited a strong absorption band at 1690 cm−1 due to the carbonyl group (C![[double bond, length as m-dash]](https://www.rsc.org/images/entities/char_e001.gif) O). The split bands at 2812 and 2855 cm−1 due to C–H stretching and C–H bending at 1392 cm−1 are characteristic vibrations of the aldehyde group. The bands at 1464 and 1566 cm−1 are ascribed to the C
O). The split bands at 2812 and 2855 cm−1 due to C–H stretching and C–H bending at 1392 cm−1 are characteristic vibrations of the aldehyde group. The bands at 1464 and 1566 cm−1 are ascribed to the C![[double bond, length as m-dash]](https://www.rsc.org/images/entities/char_e001.gif) C bond and that at 743 cm−1 to the C–H bond of the furan ring. At 0 min, after the addition of i-PrOH and the catalyst, there was no change in the observed spectrum of furfural. After 30 min, the C
C bond and that at 743 cm−1 to the C–H bond of the furan ring. At 0 min, after the addition of i-PrOH and the catalyst, there was no change in the observed spectrum of furfural. After 30 min, the C![[double bond, length as m-dash]](https://www.rsc.org/images/entities/char_e001.gif) O band (at 1690 cm−1) and two double C–H bands (at 2812 and 2855 cm−1) disappeared while new bands at 2966 and 3344 cm−1 appeared for C–H stretching and O–H, respectively, confirming the presence of furfuryl alcohol (FAL). Also, the intensity of the C
O band (at 1690 cm−1) and two double C–H bands (at 2812 and 2855 cm−1) disappeared while new bands at 2966 and 3344 cm−1 appeared for C–H stretching and O–H, respectively, confirming the presence of furfuryl alcohol (FAL). Also, the intensity of the C![[double bond, length as m-dash]](https://www.rsc.org/images/entities/char_e001.gif) C stretching vibrations (at 1464 and 1566 cm−1) of furfural weakened due to the loss of conjugation between C
C stretching vibrations (at 1464 and 1566 cm−1) of furfural weakened due to the loss of conjugation between C![[double bond, length as m-dash]](https://www.rsc.org/images/entities/char_e001.gif) O and C
O and C![[double bond, length as m-dash]](https://www.rsc.org/images/entities/char_e001.gif) C. After 60 min, the O–H band disappeared completely and only three bands, i.e. furan ring C–H bending at 773 cm−1, C–O stretching at 1218 cm−1 and C–H stretching at 2923 cm−1 were observed, confirming the formation of 2-methylfuran (2-MF). After 90 min, the C–H band was predominant, which clearly explains the complete conversion of furfural to 2-methylfuran (Fig. 8a).
C. After 60 min, the O–H band disappeared completely and only three bands, i.e. furan ring C–H bending at 773 cm−1, C–O stretching at 1218 cm−1 and C–H stretching at 2923 cm−1 were observed, confirming the formation of 2-methylfuran (2-MF). After 90 min, the C–H band was predominant, which clearly explains the complete conversion of furfural to 2-methylfuran (Fig. 8a).
DFT studies were performed according to a plausible mechanism from the literature reports and ATR-IR studies. It is inferred that the Au–H bond transfers hydride to furfural, ultimately resulting in the formation of the intermediate furfuryl alcohol. The hydrogenation of furfural to furfuryl alcohol is an exothermic reaction with a loss of energy equivalent to −15.59 eV (Fig. 8b). It is important to recognize that the conversion of furfuryl alcohol to 2-methylfuran through hydrogenation is an exothermic process, releasing energy of −40.32 eV. The calculated energy loss was significantly lower than that of furfuryl alcohol. This difference was attributed to the inherent stability of the furanic ring structure, which facilitated the breaking of the C–OH bond in furfuryl alcohol, leading to the formation of 2-methylfuran.
4. Conclusion
A hydrogen-bonded Zn4O4 cubane cage assembly that could encapsulate gold nanoparticles was obtained. It catalyzes the hydrogenolysis of bio-mass derived furfural to 2-methylfuran under moderate conditions, which is classified as a value-added product. The ZnCC@AuNP catalyst facilitated the hydrogenation of furfural to 2-methylfuran at 60 °C using 2-propanol as a solvent in just 1.5 h of a reaction time. Under visible light, absorption by AuNPs excited electrons in the conduction band and transferred them to isopropanol. This generated Au–H species on the Au-NP surface and reduced the isopropanol to acetone. High selectivity with a product yield >99% of 2-methyl furan was achieved in the reaction. Furthermore, the ZnCC@AuNP catalyst displayed satisfactory structural stability and catalytic stability during the recycling reaction tests.Conflicts of interest
The authors declare that they have no known competing financial interests or personal relationships that could have appeared to influence the work reported in this paper.Acknowledgements
The authors are grateful to SERB [No. SPG/2021/000445] for providing financial support.References
- R. Saha, B. Mondal and P. S. Mukherjee, Chem. Rev., 2022, 122, 12244–12307 CrossRef CAS PubMed.
- M. Mastalerz, Angew. Chem., Int. Ed., 2010, 49, 5042–5053 CrossRef CAS PubMed.
- P. Mastropierro, Z. Livingstone, S. D. Robertson, A. R. Kennedy and E. Hevia, Organometallics, 2020, 39, 4273–4281 CrossRef CAS.
- C. He, Y.-H. Zou, D.-H. Si, Z.-A. Chen, T.-F. Liu, R. Cao and Y.-B. Huang, Nat. Commun., 2023, 14, 3317 CrossRef CAS PubMed.
- M. Paul, N. Adarsh and P. Dastidar, Cryst. Growth Des., 2014, 14, 1331–1337 CrossRef CAS.
- G.-J. Chen, C.-Q. Chen, X.-T. Li, H.-C. Ma and Y.-B. Dong, Chem. Commun., 2018, 54, 11550–11553 RSC.
- A. Aijaz and Q. Xu, J. Phys. Chem. Lett., 2014, 5, 1400–1411 CrossRef CAS PubMed.
- C. Gao, F. Lyu and Y. Yin, Chem. Rev., 2020, 121, 834–881 CrossRef PubMed.
- D. Tsukamoto, Y. Shiraishi, Y. Sugano, S. Ichikawa, S. Tanaka and T. Hirai, J. Am. Chem. Soc., 2012, 134, 6309–6315 CrossRef CAS PubMed.
- C. Barrière, K. Piettre, V. Latour, O. Margeat, C.-O. Turrin, B. Chaudret and P. Fau, J. Mater. Chem., 2012, 22, 2279–2285 RSC.
- M. Sankar, Q. He, R. V. Engel, M. A. Sainna, A. J. Logsdail, A. Roldan, D. J. Willock, N. Agarwal, C. J. Kiely and G. J. Hutchings, Chem. Rev., 2020, 120, 3890–3938 CrossRef CAS PubMed.
- A. Corma and H. Garcia, Chem. Soc. Rev., 2008, 37, 2096–2126 RSC.
- B. Mondal and P. S. Mukherjee, J. Am. Chem. Soc., 2018, 140, 12592–12601 CrossRef CAS PubMed.
- Y. Zhang, Y. Xiong, J. Ge, R. Lin, C. Chen, Q. Peng, D. Wang and Y. Li, Chem. Commun., 2018, 54, 2796–2799 RSC.
- J. Rohilla, S. Thakur, K. Kumar, R. Singh and V. Kaur, ACS Appl. Nano Mater., 2023, 6, 12063–12072 CrossRef CAS.
- L.-W. Chen, Y.-C. Hao, Y. Guo, Q. Zhang, J. Li, W.-Y. Gao, L. Ren, X. Su, L. Hu and N. Zhang, J. Am. Chem. Soc., 2021, 143, 5727–5736 CrossRef CAS PubMed.
- M. Haghshenas, M. Mazloum-Ardakani, Z. Alizadeh, F. Vajhadin and H. Naeimi, Electroanalysis, 2020, 32, 2137–2145 CrossRef CAS.
- J. R. Nitschke, Acc. Chem. Res., 2007, 40, 103–112 CrossRef CAS PubMed.
- P. Jiang and Z. Guo, Coord. Chem. Rev., 2004, 248, 205–229 CrossRef CAS.
- L. Hu, G. Zhao, W. Hao, X. Tang, Y. Sun, L. Lin and S. Liu, RSC Adv., 2012, 2, 11184–11206 RSC.
- J. N. Putro, F. E. Soetaredjo, S.-Y. Lin, Y.-H. Ju and S. Ismadji, RSC Adv., 2016, 6, 46834–46852 RSC.
- K. Zhou, J. Chen, Y. Cheng, Z. Chen, S. Kang, Z. Cai, Y. Xu and J. Wei, ACS Sustainable Chem. Eng., 2020, 8, 16624–16636 CrossRef CAS.
- H. Niu, J. Luo, C. Li, B. Wang and C. Liang, Ind. Eng. Chem. Res., 2019, 58, 6298–6308 CrossRef CAS.
- G. S. More, A. Shivhare, S. P. Kaur, T. D. Kumar and R. Srivastava, Catal. Sci. Technol., 2022, 12, 4857–4870 RSC.
- N. S. Date, A. M. Hengne, K.-W. Huang, R. C. Chikate and C. V. Rode, Green Chem., 2018, 20, 2027–2037 RSC.
- J. Chuseang, R. Nakwachara, M. Kalong, S. Ratchahat, W. Koo-amornpattana, W. Klysubun, P. Khemthong, K. Faungnawakij, S. Assabumrungrat and V. Itthibenchapong, Sustainable Energy Fuels, 2021, 5, 1379–1393 RSC.
- X. Yang, X. Xiang, H. Chen, H. Zheng, Y. W. Li and Y. Zhu, ChemCatChem, 2017, 9, 3023–3030 CrossRef CAS.
- K. Yan and A. Chen, Fuel, 2014, 115, 101–108 CrossRef CAS.
- S. Srivastava, G. Jadeja and J. Parikh, RSC Adv., 2016, 6, 1649–1658 RSC.
- S. Thakur, J. Rohilla, K. Kumar, H. Kumar, R. Singh, V. Kaur, R. Kamboj and R. Kaur, Analyst, 2023, 148, 2582–2593 RSC.
- G. Sheldrick, Acta Crystallogr., Sect. A: Found. Adv., 2015, 71, 3–8 CrossRef PubMed.
- G. Sheldrick, J. Appl. Crystallogr., 2009, 42, 339–341 CrossRef.
- M. J. Frisch, G. Trucks, H. Schlegel, G. Scuseria, M. Robb, J. Cheeseman, G. Scalmani, V. Barone, G. Petersson and H. Nakatsuji, Gaussian 16, Gaussian, Inc., Wallingford CT, 2016 Search PubMed.
- A. D. Becke, J. Chem. Phys., 1993, 98, 5648–5652 CrossRef CAS.
- A. F. Richards, A. Aprile and C. F. Hogan, Dalton Trans., 2012, 41, 8361–8367 RSC.
- J. Singh, S. Thakur, R. Singh and V. Kaur, Food Chem., 2020, 327, 127080 CrossRef CAS PubMed.
- M. Karmakar, S. Roy and S. Chattopadhyay, New J. Chem., 2019, 43, 10093–10102 RSC.
- R. Sharma, G. P. Holland, V. C. Solomon, H. Zimmermann, S. Schiffenhaus, S. A. Amin, D. A. Buttry and J. L. Yarger, J. Phys. Chem. C, 2009, 113, 16387–16393 CrossRef CAS.
- R. McCaffrey, H. Long, Y. Jin, A. Sanders, W. Park and W. Zhang, J. Am. Chem. Soc., 2014, 136, 1782–1785 CrossRef CAS PubMed.
- Z. Mei and L. Tang, Anal. Chem., 2017, 89, 633–639 CrossRef CAS PubMed.
- H. H. Mai and E. Janssens, Microchim. Acta, 2020, 187, 1–11 CrossRef PubMed.
- X. Ke, X. Zhang, J. Zhao, S. Sarina, J. Barry and H. Zhu, Green Chem., 2013, 15, 236–244 RSC.
Footnote |
| † Electronic supplementary information (ESI) available: Characterization data of all compounds, elemental mapping, DLS and XPS spectra, PXRD pattern of Zn(II) cubane and ZnCC@AuNPs, HPLC chromatogram, crystallographic data and structural parameters; crystallographic data comprised in CCDC 2298615. For ESI and crystallographic data in CIF or other electronic format see DOI: https://doi.org/10.1039/d3tc03896c |
| This journal is © The Royal Society of Chemistry 2024 |

