 Open Access Article
Creative Commons Attribution 3.0 Unported Licence
Supramolecular polyelectrolyte complex (SPEC): pH dependent phase transition and exploitation of its carrier properties†
Subharanjan
Biswas
a,
Ethayaraja
Mani
b,
Arobendo
Mondal
c,
Ashwani
Tiwari
c and
Soumyajit
Roy
*a
aEco-Friendly Applied Materials Laboratory, Department of Chemical Sciences, New Campus, IISER-Kolkata, India. E-mail: s.roy@iiserkol.ac.in; roy.soumyajit@googlemail.com; Fax: +91 3325873020; Tel: +91 9007222901
bPolymer Engineering & Colloid Science Group, Department of Chemical Engineering, Indian Institute of Technology – Madras, Chennai – 600036, India
cDepartment of Chemical Sciences, IISER-Kolkata, India
First published on 25th November 2015
Abstract
A supramolecular poly-electrolyte complex (SPEC) comprising poly-electrolyte acrylic acid with supramolecularly complexed guanidium is reported. This complex shows pH responsive phase transitions, which are described and characterized using microscopy, spectroscopy, density functional theory studies and Monte Carlo simulations. The phase behaviour of the SPEC is exploited by loading a dye like perylene and a drug, viz., doxorubicin, and their pH dependent controlled release is demonstrated, owing to the pH dependent phase change of the SPEC.
Introduction
Phase transitions in various model systems1–5 are of interest to materials science to understand various phenomena6 and emergence of new properties in materials.7–10 Hence the choice of a model system is important to exploit such emergence of novel properties in materials. Systems such as soluble polymer–colloid dispersion mixtures show a rich phase behaviour11–17 and may serve as an interesting model system as they provide a window to evidence emergence of new materials at molecular as well as mesoscopic length-scales.18–24 Such polymeric materials have been moulded into materials with nanoscopic morphologies and have been used in nano-lithography, organic photovoltaics, batteries, etc.25 Thus understanding the phase behaviour of soluble polymers and polymer-colloids has received immense importance. Such phase behaviour has also been explained in the light of hard sphere interaction with certain stickiness. A parallel has also been drawn with the phase behaviour of another ubiquitous liquid like water.12 Likewise, inter-polyelectrolyte complexes (IPECs) comprising charged polymeric complexes have been shown to demonstrate interesting behaviour on changing external conditions and associative phenomena due to conformational change at the molecular level.26–31 Very recently using broad band dielectric spectroscopy (BDS) and a nanoelectrode the glassy dynamics of a tiny volume of an isolated polymer chain has been shown to be identical to that observed in the bulk.32 The question arises, is it possible to observe related interesting colloid polymer phase phenomena using a single polyelectrolyte and a supramolecular additive? Do they form supramolecularly organised states or supramolecular polyelectrolyte complexes (SPECs)33–35 that can be switched from polymeric to colloidal state by means of an external trigger like pH?Here, we have studied such a model system comprising polyacrylic acid with a supramolecular cross linker guanidium. This system comprises polymeric strings of polyacrylic acid (abbreviated as PAA from here onwards) with patchy36–38 hydrogen bonding sites on it. In general the sites are inactive or non-sticky and do not show any interesting phase behaviour,39–41 but as soon as we add guanidium (abbreviated as GD in the study) to it and pH42–44 is increased, white turbidity appears in the colourless mixture. On further increment in pH, the turbidity goes on increasing and after a certain pH it forms a gel-block and gets separated from the clear solution. We have found this phenomenon to be totally reversible, as on decreasing the pH, the gel block starts to get dissolved in the solution and totally dissolves when the pH is completely reversed. We have further exploited this reversibility in controlled release of substrates like dyes or drugs.
Now, the errand is to find out the phenomenon behind such reversible phase transition and to correlate this phenomenon with molecular level interaction among PAA and GD. PAA as well as GD comprises numerous hydrogen bonding sites. So, is there any role of supramolecular interaction45–47 in the phase behaviour of our system? Can we envisage formation of supramolecularly structured phases being assembled and disassembled in this system with an external trigger48–54 like the variation of pH?55,56 If so, can such phenomenon be exploited for controlled release of substrates like dyes and drugs? We answer these questions here.
Experimental section
Acrylic acid and sodium hydroxide used in this study are of reagent grade. All other chemicals are of analytical grade. Guanidinium hydrochloride is purchased from Sigma Aldrich, Germany. All other reagents are purchased from Merck, Germany. The reagents are used as obtained without further purification.Synthesis of low molecular weight PAA
60 g of deionized water and 2 g of sodium hydrogen sulfite are added into a reactor and stirred until dissolved. The reactor is then slowly heated in an oil-bath and the temperature is raised to 60 °C. Afterwards, a mixture of 20 g of acrylic acid, 0.2 g of ammonium peroxydisulphate and 20 ml of deionized water is mixed and fed into the reactor by adding the whole mixture drop by drop over 40 minutes. The solution is stirred at 60 °C for another 1.5 hours. Later on, the reactor is cooled and the PAA so obtained is used for further experiments as described in the text.Preparation of PAA–GD composite, cluster and the gel block
The as-prepared PAA is used as the starting material for the synthesis of supramolecularly cross-linked patchy polymeric material. 4 g of low molecular weight PAA is taken in a sample vial; different weight percentages of guanidinium hydrochloride (5% (0.2 g), 10% (0.4 g), 15% (0.6 g), 25% (1.0 g), 35% (1.4 g), 45% (1.8 g), 55% (2.2 g) are added into PAA). The samples are then ultrasonicated until GD completely dissolves in PAA. 7.5 mol l−1 NaOH is added into the solution drop by drop to increase the pH of the sample to get to the first cloud point. After continuous increment of pH, a white gel block is formed by complete phase separation. We then reverse the pH to dissolve the gel block to obtain the liquid phase again. We have used 10% PAA–GD from here onwards as reference for other experiments.Gel permeation chromatography (GPC)
A Consenxus GmbH GPC system was used to measure the molecular weight and molecular weight distribution of the synthesized PAA. PAA at a concentration of 1 mg ml−1 was injected into the system fitted with a RI detector.Study of density functional theory and Monte Carlo simulation
The molecular geometries are optimized at the B3LYP/6-31g level using Gaussian 09 package.57 Details of the results have been explained in the Results and discussion section. Monte Carlo simulation study is also discussed in detail in the Results and discussion section.Spectroscopy and microscopy experiments
UV-Visible spectra are recorded in the range 200–1000 nm with a Shimadzu UV-160A spectrophotometer and evaluated with a program associated with the spectrometer. A LABRAM HR800 Raman spectrometer is employed using the 633 nm line of a He–Ne ion laser as the excitation source to analyse the sample. FTIR spectra reported in this study are recorded with a Perkin Elmer Spectrum RX1 spectrophotometer with HATR (horizontal attenuated total reflectance) facility in the range 4000–500 cm−1. SEM (scanning electron microscopy) and cryo-SEM images are acquired using a Zeiss Sigma microscope. All the gel samples were first dried in vacuum for 2 days prior to SEM experiments. Cryo-SEM was done using samples as they were. TEM (transmission electron microscopy) images are taken with a JEOL JEM 2010 electron microscope. Gel samples were first properly diluted with Milli-Q water and then drop-casted on a 300 mesh TEM grid prior to TEM experiments.Rheological studies
To understand the viscoelastic properties of gels, we have performed rheological experiments on a rheometer (AR-G2, TA Instruments). All the experiments were carried out at 25 °C using 40 mm steel parallel plates with a gap of 1.0 mm. The storage modulus (G′) and the loss modulus (G′′) of the gels were recorded in the linear viscoelastic regime at a shear strain of γ = 2% with angular frequency sweep.Loading and controlled release of perylene-3,4,9,10-tetracarboxylate and doxorubicin hydrochloride by PAA–GD gel phase
5 mg of perylene-3,4,9,10-tetracarboxylate58 (abbreviated as PTC from here onwards) is added to 4 ml of 10% PAA–GD solution. The mixture is ultrasonicated using a Takashi Ultrasonicator until dissolved. PTC loaded PAA–GD is then subjected to pH variation from 4 to 7 till complete phase separation takes place. After that, the gel phase is dissolved by reversal of pH.In the case of doxorubicin hydrochloride (Dox), 2 mg of Dox is mixed with 4 ml of 10% PAA–GD solution and ultrasonicated till it dissolves completely. The pH of the mixture is then varied to get the separated phase and then reversed to initial pH to dissolve the gel phase. Both PAA–GD–PTC and PAA–GD–Dox at different pH have been investigated by confocal microscopy and scanning electron microscopy.
Results and discussion
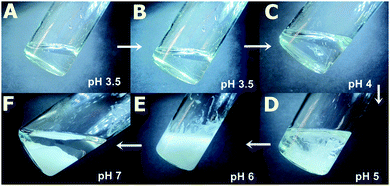
The molecular weight and molecular weight distribution of the synthesized PAA were measured by gel permeation chromatographic (GPC) experiment (see ESI†). The molecular weight of PAA was calculated to be 7000 Da from GPC measurements.We have shown earlier that by using supramolecular interactions it is possible to induce gelation in the PAA network.59 Now we proceed on to the next step using one such supramolecular linkage unit like GD. We explore in this study the effect of change of pH in the supramolecular cross-linking network of PAA–GD and the phase behaviour60 of that particular system on changing pH. For instance, at the beginning of the experiment, there is a clear liquid phase of PAA having pH nearly equal to 3.5 (Fig. 1A). When we add GD to it no significant change in pH occurs, only the medium becomes more viscous (Fig. 1B). Afterwards, we add NaOH solution (7.5 mol l−1) drop-wise. At pH 4, we see the appearance of white cloud and at this point coexistence of liquid as well as cloudy phase is visible (Fig. 1C). As the pH is further elevated, formation of more turbidity is found to occur (Fig. 1D). At a pH nearly equal to 6, maximum turbidity is found (Fig. 1E). Separation of phases takes place thereafter on increasing the pH further. At this stage (pH ∼ 7), a gel completely separates out forming a clear liquid in the supernatant (Fig. 1F).
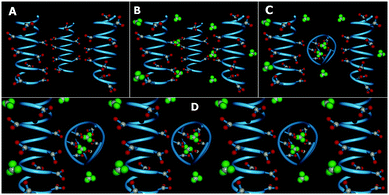
We now construct a simple model to explain the above experimental observations. Our model is that of a patchy polymer. It has patchy triangular blocks representing GD which can be modulated by changing pH (Fig. 2). We now explain the observations based on this model.
Initially, there are small polymeric chains of PAA, well soluble in water to form a viscous solution (Fig. 1A and 2A). Now, to this solution we add GD having 6 dormant hydrogen bonding sites, which can be activated upon increasing the pH by the addition of NaOH. Upon increasing the pH, deprotonation of the PAA network takes place prior to GD, due to its lower pKa value (4.25) with respect to GD (pKa 13.6) which results in supramolecular connection formation between PAA and GD (PAA–GD liquid, Fig. 1B and 2B). Later on, with a further increase in pH, coiling of polymeric chains takes place due to a favorable conformational change in the polymeric network.61 At this stage, a few PAA chains start wrapping up with supramolecularly linked GD inside and form polymer coils leading to the formation of white turbidity which is the PAA–GD cluster phase (Fig. 1C and 2C). Clustering gradually increases with the increase in pH and finally a white gel is formed, which gets separated out from solution (PAA–GD gel phase, Fig. 1F and 2D). At low pH soluble polymeric networks have dominance over clusters which is due to the fact that only few deprotonated PAA and protonated GD are present under this condition. Upon reaching a pH value of around 6, the cluster formation increases significantly. On further increasing the pH to 7, there is a clear phase separation (Fig. 1F and 2D).
This transition is sharply visible as there is a clear phase separation at pH 7. At this point the PAA–GD cluster formation reaches its maximum and those insoluble clusters get separated out as white gel (Fig. 1F and 2D). Formation of the PAA–GD cluster from PAA is verified by FTIR spectroscopic experiments.
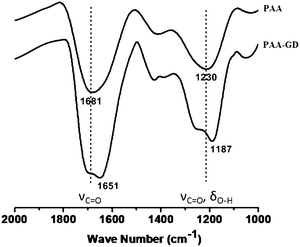
We now investigate the gels by ATR-FTIR spectroscopic experiments (Fig. 3). Distinct differences in spectral signatures are observed between the starting PAA and PAA–GD cluster networks, implying effective supramolecular cross-linking in the latter. The PAA–GD cluster networks show a blue shift in the spectral signature of the carboxylate groups from 1681 cm−1 to 1651 cm−1 implying a stiffening of the corresponding bonds due to hydrogen bonding in the PAA–GD cluster networks (Fig. 3). More precisely, in the case of PAA–GD clusters, an intense peak is observed at 1651 cm−1 while in free PAA this peak is observed at 1681 cm−1. This is due to intermolecular hydrogen bonding of the C![[double bond, length as m-dash]](https://www.rsc.org/images/entities/char_e001.gif) O groups in the PAA with NH– of GD in the cross-linked polymer causing the blue shift in the stretching frequency of the C
O groups in the PAA with NH– of GD in the cross-linked polymer causing the blue shift in the stretching frequency of the C![[double bond, length as m-dash]](https://www.rsc.org/images/entities/char_e001.gif) O bond of PAA in the PAA–GD network. The stretching frequency at 1230 cm−1 corresponding to C–O stretching coupled with O–H bending in the case of pristine PAA is blue shifted to 1187 cm−1 in the PAA cross-linked with GD. The above shifts thereby show the presence of a more rigid hydrogen bonded or supramolecularly connected network in the PAA–GD cross-linked polymeric network. These infrared spectroscopic results indeed prove the formation of a supramolecular network with PAA–GD where GD acts as a supramolecular cross-linker of PAA polymeric chains.
O bond of PAA in the PAA–GD network. The stretching frequency at 1230 cm−1 corresponding to C–O stretching coupled with O–H bending in the case of pristine PAA is blue shifted to 1187 cm−1 in the PAA cross-linked with GD. The above shifts thereby show the presence of a more rigid hydrogen bonded or supramolecularly connected network in the PAA–GD cross-linked polymeric network. These infrared spectroscopic results indeed prove the formation of a supramolecular network with PAA–GD where GD acts as a supramolecular cross-linker of PAA polymeric chains.
Here, it is worth mentioning that supramolecular interaction plays a crucial role in the formation of networks inside the polymer as well. A huge number of free hydrogen bonding sites in both PAA and GD increase the possibility of network formation. When complete phase separation takes place the gel block material is obtained.
We conclude this step to be comprising a polymeric network matrix with coiled up PAA chains encapsulating GD units, glued together by GD units. Now we describe the behaviour of the entire system by a patchy polymer model using Monte Carlo simulations.
Both PAA and GD have been partially deprotonated under the studied experimental conditions. Under these conditions, it is likely that PAA acquires a coiled conformation and the PAA–GD network is formed due to hydrogen bonding. This is shown in Fig. 4A, where the red arrows indicate the attachment of GD to the PAA polymer at random sites.
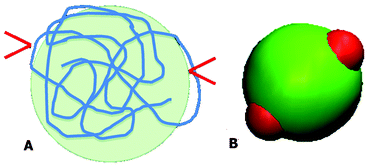 | ||
| Fig. 4 Schematic diagram of the PAA polymer in the coil form with two bound GD (A) and an equivalent patchy model (B). | ||
We have considered such a network of a soft polymer sphere and sticky patches as shown in Fig. 4B. The green balls (here abbreviated as A) represent the squishy polymer region of PAA and the red patches (abbreviated as B) represent the locations of GD. We have also assumed that between two patchy polymer spheres, green–red (A–B) parts interact via hydrogen bonds, red–red (B–B) parts repel due to electrostatic interactions, and green–green (A–A) parts interact with a soft potential model. The overall sum of the inter-polymer potentials is mathematically given as
 | (1) |
 | (2) |
 | (3) |
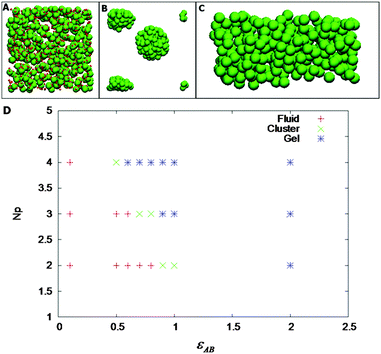
Some parameters have been fixed to a certain value like εAA = 2, εAB = 2, ζAB = 1, ζBB = 0.1, and σB = 0.1. We have studied the effect of number of patches (Np) and εAB, which are related to the amount of GD and strength of hydrogen bonding, respectively. These two parameters can be directly adjusted in the experiments. We have performed NVT Monte Carlo simulations with 500 patchy particles using cubic periodic boundary conditions with Metropolis algorithm. While starting up the simulation, Np, number of patches, has been randomly distributed on the surface of the polymer particle. In the simulation, a particle is randomly chosen and given a translational displacement and rotational displacement using quaternion. The step has been accepted according to the Metropolis acceptance rule: e−(En−Eo)/KBT, where En and Eo are the total potential energies after and before the random move. This is continued until equilibrium is attained.
For a fixed density, we have varied Np and εAB. Fig. 5A–C shows the phase diagram of the patchy model for a volume fraction of 0.105. As shown in Fig. 5D, we have observed that at low values of Np and εAB, the particles are fluid-like. Upon increasing either Np or εAB, we have observed a stable cluster phase (the PAA–GD coiled state). There is a well-defined fluid–cluster boundary, which can be traced either by increasing Np with fixed εAB or vice versa. This implies reversibility in formation of various phases as observed experimentally. Representative snapshots of the fluid (PAA–GD liquid), cluster (PAA–GD phase) and gel phase (phase separated PAA–GD gel) are shown in Fig. 5.
With a simple coarse-grained model, we have shown the fluid–cluster–gel transitions in the simulation, which qualitatively confirms the experimental data (Fig. 5). The simulation results do confirm our hypotheses that there are hydrogen bonding interactions between PAA polymer and GD additive. We make no attempt to quantitatively compare the results between experiments and simulation, as the level of coarse-graining of the PAA polymer is far too unspecific. However, the qualitative agreement between experiments and our calculations is obvious.
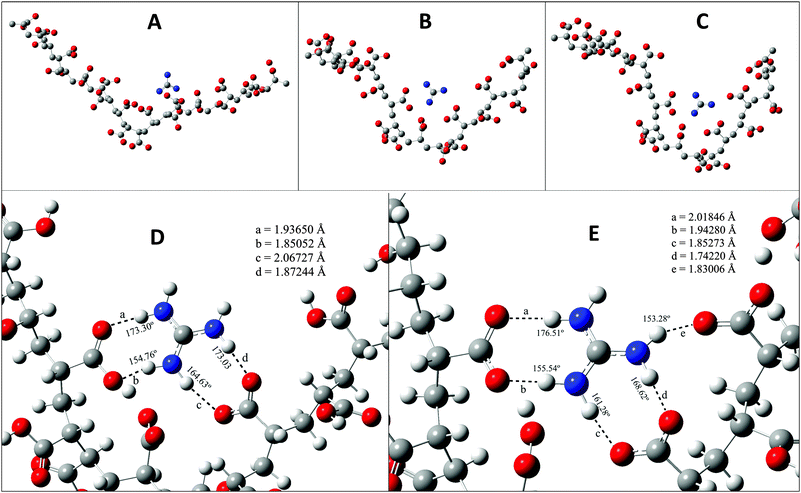
Now we take a closer look at the phase behaviour of our system at the molecular level. To do so we have taken resort to density functional theory (DFT) and here we describe the results obtained by DFT. The monomer of PAA has a carboxylate (–COOH) group which is sensitive to the pH of the solution. When the solution is acidic the –COOH group remains in neutral form, and as the pH increases the number of –COO− ions in solution increases. The protonated GD unit is able to form a hydrogen bond with the –COO− group of PAA. In Fig. 6A, it is shown that the oxygen atoms of the –COO– group form hydrogen bonds with N–H of GD units. It is quite clear that there are many N–H–O hydrogen bonds. As the pH value of the solution increases the –COO− ions start forming. Fig. 6B, D and C, E shows that as the number of –COO− ions increases in the polymer the attraction between the protonated GD and PAA increases. This forces the polymer to get coiled as the PAA–GD cluster. Also upon increasing the pH, the interaction between the PAA and GD increases, which reduces the intermolecular interaction of the polymer with others, with the result that the polymer makes a separate phase of an aggregated cluster, i.e. the PAA–GD gel phase.
From the previous discussion it is clear that the PAA network has free chains and those that are connected via GD units form coils on deprotonation of the PAA network. At the beginning of the experiment, there are free PAA chains (Fig. 1A and 2A). The addition of GD results in supramolecular connection formation between the PAA chains leading to the formation of a network of supramolecular polymeric chains by the mediation of GD (Fig. 1B and 2B). On addition of base, a few of the supramolecular bonding sites of PAA (carboxylic acid groups) as well as of GD (imine and amine groups) get deactivated due to deprotonation. Such deprotonation of PAA and GD results in destruction of some supramolecular cross linking within the PAA–GD liquid network. PAA as well as GD still has some hydrogen bonding sites intact. Those active hydrogen bonding sites of PAA as well as GD help PAA chains to wrap forming a coil with supramolecularly linked GD inside it. In short, PAA–GD cluster formation takes place when a polymeric chain of PAA gets coiled up on an external trigger (here, pH) with cross-linkers (GD) inside it (Fig. 1C and 2C).
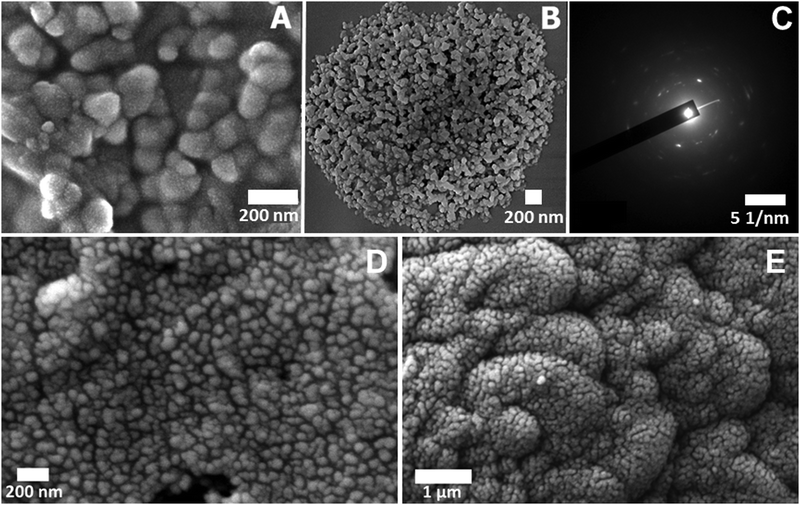
The phase transition phenomenon is also clearly visible from microscopic studies. Network formation at the appearance of cloud point is seen (Fig. 7A). The scanning electron microscopic image at pH 4 of the first cloud point clearly shows the network structure of PAA–GD clusters. Fig. 7B shows phase separation at the final cloud point at pH 7 where the PAA–GD clusters are all assembled together and get separated as PAA–GD gel. This is also evident from cryo-SEM images. Fig. 7D represents the appearance of the cloud point and Fig. 7E is the separated cluster phase.
In the transmission electron microscopic selected area electron diffraction (SAED) pattern, at pH 7, we see a regular diffraction pattern with discrete spots indicating ordered lattice-like structure formation within the phase-separated white gel (PAA–GD gel), just as we observe in a crystalline material. Hence it proves our proposition that a lattice like structure forms as soon as we change the pH of the polymeric system and the separated PAA–GD gel has a regular lattice in its interior structure.
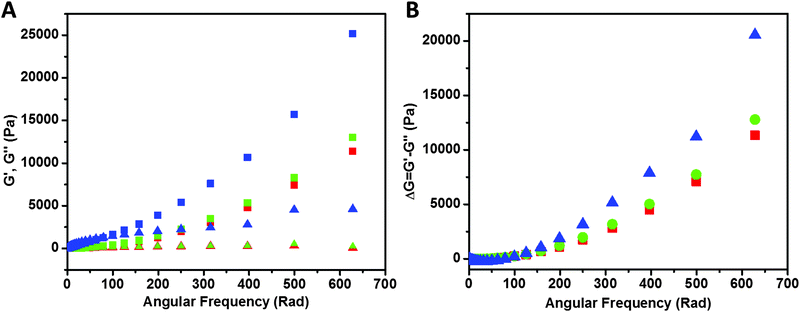
Rheological study of the samples is shown in Fig. 8. Storage modulus G′ (closed symbols) and loss modulus G′′ (open symbols) values of PAA (red), PAA–GD composite (green) and PAA–GD cluster gel block (blue) are shown as a function of angular frequency. We observed a higher value of storage modulus (G′) than the loss modulus (G′′) within the linearity limits of deformation, indicating that the rheological behavior in the gel is dominated by an elastic property rather than a viscous property.
The pH induced phase transition of the PAA–GD cluster to PAA–GD gel and PAA–GD liquid is reversible. We now exploit this reversible transition62–64 of the PAA–GD cluster to PAA–GD gel and PAA–GD liquid phases for loading of substrates and their controlled release. As we reverse the pH at each step of cluster formation, the turbidity disappears to break the PAA–GD cluster. Below pH 4, only liquid phase exists (PAA–GD liquid), whereas between pH 4 and 6, the existence of cluster phase (PAA–GD cluster) is evidenced. On the other hand, at pH > 6, there is only gel phase: PAA–GD gel.
The cross-linked polymer PAA–GD liquid is first loaded with perylene-3,4,9,10-tetracarboxylate (PTC) and then with doxorubicin hydrochloride (Dox). Both PAA–GD–PTC and PAA–GD–Dox are subjected to pH variation. At pH 7 phase separation takes place for both cases. Reversal of pH homogenizes the separated phases. All the variations are examined by confocal microscopy and scanning electron microscopy. When the pH of the gel block (formed at pH 7) loaded with PTC is reduced to pH 6, we see green fluorescence of PTC confined within the gel network as shown in Fig. 9A. With a further reduction of pH (at pH 5) this gel network disassembles with the concomitant release of PTC (Fig. 9B). PAA–GD–Dox has shown the same characteristics with red fluorescence (Fig. 9C and D). In other words on reducing the pH, Dox is released from the PAA–GD–Dox network. SEM images also justify and show similar results where we can see a clear picture of dye loading (Fig. 9E) and release (Fig. 9F).
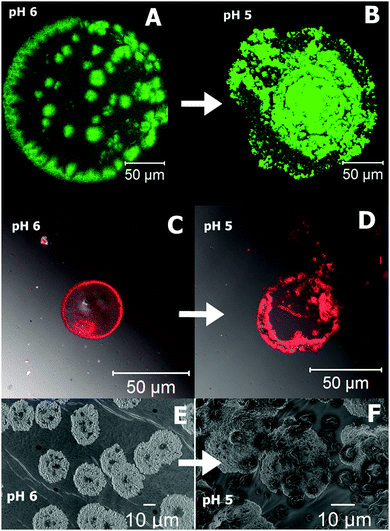 | ||
| Fig. 9 Confocal microscopic images of pH dependent controlled release of PTC (A and B) and Dox (C and D). SEM snap shots of PTC release from the cluster at different pH (E and F). | ||
Conclusions
To summarize, we have demonstrated pH triggered phase transition of a supramolecular polyelectrolyte complex by formation of supramolecular connectivity within the polymeric network by spectroscopic and microscopic techniques taking the PAA and GD mixture as a model system. We observe that initially clear PAA solution becomes viscous when mixed with GD. Upon increasing the pH slowly to pH 4, initial turbidity appears. The turbidity keeps on increasing with pH. We explain this behaviour with the aid of DFT and MC simulations and explain it as a result of formation of coiled SPECs from PAA–GD networks. We also observe that this pH induced phase transition is reversible in nature. In other words it is possible to move from a liquid (PAA–GD) phase state to cluster (coiled PAA–GD) state, and reverse. Thus, we exploit this reversibility to load fluorescent molecules like perylene-3,4,9,10-tetracarboxylate and drug molecules like doxorubicin hydrochloride and show their pH dependent uptake and release. Scopes are open to modify and use such systems as controlled drug delivery agents inside infected human cells.Acknowledgements
Cooperation of Dr Subi Jacob George, K. Venkata Rao, Dandan Yuan and Rongxin Yuan is gratefully acknowledged. Dr Raja Shunmugam is thanked for providing us with doxorubicin hydrochloride. We acknowledge the help of Ritabrata Ghosh of IISER-Kolkata with confocal microscopy. SR thanks DST fast track, BRNS-DAE grant, IISER-Kolkata and CIT for start-up grants. SB thanks UGC-SRF for scholarship.Notes and references
- T. Xie, S. Li, Q. Peng and Y. Li, Angew. Chem., Int. Ed., 2009, 48, 196–200 CrossRef CAS PubMed
.
- I. Zhang, C. P. Royall, M. A. Faers and P. Bartlett, Soft Matter, 2013, 9, 2076–2084 RSC
.
- J. Sabin, A. E. Bailey, G. Espinosa and B. J. Frisken, Phys. Rev. Lett., 2012, 109, 195701 CrossRef PubMed
.
- M. M. Baksh, M. Jaros and J. T. Groves, Nature, 2004, 427, 139–141 CrossRef PubMed
.
- F. Castro-Marcano, A. M. Cataño-Barrera and C. M. Colina, Ind. Eng. Chem. Res., 2011, 50, 1046–1055 CrossRef CAS
.
- G. Rodriguez, M. Cocera, L. Rubio, C. Alonso, R. Pons, C. Sandt, P. Dumas, C. Lopez-Iglesias, A. de la Maza and O. Lopez, Phys. Chem. Chem. Phys., 2012, 14, 14523–14533 RSC
.
- H. N. W. Lekkerkerker, W. C. K. Poon, P. N. Pusey, A. Stroobants and P. B. Warren, Europhys. Lett., 1992, 20, 559 CrossRef CAS
.
- P. N. Pusey, W. Van Megen, S. M. Underwood, P. Bartlett and R. H. Ottewill, Phys. A, 1991, 176, 16–27 CrossRef
.
- P. H. Poole, F. Sciortino, U. Essmann and H. E. Stanley, Nature, 1992, 360, 324–328 CrossRef
.
- D. J. Mitchell, G. J. T. Tiddy, L. Waring, T. Bostock and M. P. McDonald, J. Chem. Soc., Faraday Trans. 1, 1983, 79, 975–1000 RSC
.
- W. C. K. Poon, Curr. Opin. Colloid Interface Sci., 1998, 3, 593–599 CrossRef CAS
.
- V. J. Anderson and H. N. W. Lekkerkerker, Nature, 2002, 416, 811–815 CrossRef CAS PubMed
.
- S. Roy, Comments Inorg. Chem., 2011, 32, 113–126 CrossRef CAS
.
- M. S. Romero-Cano and A. M. Puertas, Soft Matter, 2008, 4, 1242–1248 RSC
.
- K. J. Mutch, J. S. van Duijneveldt and J. Eastoe, Soft Matter, 2007, 3, 155–167 RSC
.
- L. Feng, B. Laderman, S. Sacanna and P. Chaikin, Nat. Mater., 2015, 14, 61–65 CrossRef CAS PubMed
.
- P.-G. de Gennes, Nature, 2001, 412, 385 CrossRef CAS PubMed
.
- P. Jiang, J. F. Bertone and V. L. Colvin, Science, 2001, 291, 453–457 CrossRef CAS PubMed
.
- B. Hartke, Angew. Chem., Int. Ed., 2002, 41, 1468–1487 CrossRef CAS
.
- N. L. McFarlane, N. J. Wagner, E. W. Kaler and M. L. Lynch, Langmuir, 2010, 26, 13823–13830 CrossRef CAS PubMed
.
- R. Pandey and J. C. Conrad, Soft Matter, 2012, 8, 10695–10703 RSC
.
- D. J. Ashton and N. B. Wilding, Phys. Rev. E: Stat., Nonlinear, Soft Matter Phys., 2014, 89, 031301 CrossRef PubMed
.
- G. D'Adamo, A. Pelissetto and C. Pierleoni, J. Chem. Phys., 2014, 141, 244905 CrossRef PubMed
.
- K. J. Mutch, J. S. van Duijneveldt, J. Eastoe, I. Grillo and R. K. Heenan, Langmuir, 2010, 26, 1630–1634 CrossRef CAS PubMed
.
- T. P. Russell, Science, 2013, 341, 1351–1352 CrossRef PubMed
.
- B. Tsang, C. Yu and S. Granick, ACS Nano, 2014, 8, 11030–11034 CrossRef CAS PubMed
.
- C. V. Synatschke, T. I. Löbling, M. Förtsch, A. Hanisch, F. H. Schacher and A. H. E. Müller, Macromolecules, 2013, 46, 6466–6474 CrossRef CAS
.
- W.-F. Lai and H. C. Shum, ACS Appl. Mater. Interfaces, 2015, 7, 10501–10510 CAS
.
- S. V. Larin, A. A. Darinskii, E. B. Zhulina and O. V. Borisov, Langmuir, 2009, 25, 1915–1918 CrossRef CAS PubMed
.
- T. V. Burova, N. V. Grinberg, D. R. Tur, V. S. Papkov, A. S. Dubovik, E. D. Shibanova, D. I. Bairamashvili, V. Y. Grinberg and A. R. Khokhlov, Langmuir, 2013, 29, 2273–2281 CrossRef CAS PubMed
.
- D. V. Pergushov, A. H. E. Muller and F. H. Schacher, Chem. Soc. Rev., 2012, 41, 6888–6901 RSC
.
- M. Tress, E. U. Mapesa, W. Kossack, W. K. Kipnusu, M. Reiche and F. Kremer, Science, 2013, 341, 1371–1374 CrossRef CAS PubMed
.
- M. Terauchi, G. Ikeda, K. Nishida, A. Tamura, S. Yamaguchi, K. Harada and N. Yui, Macromol. Biosci., 2015, 15, 953–964 CrossRef CAS PubMed
.
- J. B. Matson, Y. Navon, R. Bitton and S. I. Stupp, ACS Macro Lett., 2015, 4, 43–47 CrossRef CAS
.
- Y. Anraku, A. Kishimura, Y. Yamasaki and K. Kataoka, J. Am. Chem. Soc., 2013, 135, 1423–1429 CrossRef CAS PubMed
.
- S. Gon and M. M. Santore, Langmuir, 2011, 27, 1487–1493 CrossRef CAS PubMed
.
- Y. Zhao, R. Berger, K. Landfester and D. Crespy, Polym. Chem., 2014, 5, 365–371 RSC
.
- I. Coluzza, P. D. J. van Oostrum, B. Capone, E. Reimhult and C. Dellago, Phys. Rev. Lett., 2013, 110, 075501 CrossRef PubMed
.
- I. Coluzza, P. D. J. van Oostrum, B. Capone, E. Reimhult and C. Dellago, Soft Matter, 2013, 9, 938–944 RSC
.
- Y. Gi-Ra, J. P. David and S. Stefano, J. Phys.: Condens. Matter, 2013, 25, 193101 CrossRef PubMed
.
- S. Gon and M. M. Santore, Langmuir, 2011, 27, 15083–15091 CrossRef CAS PubMed
.
- B. H. Tan and K. C. Tam, Adv. Colloid Interface Sci., 2008, 136, 25–44 CrossRef CAS PubMed
.
- A. J. Gormley, R. Chandrawati, A. J. Christofferson, C. Loynachan, C. Jumeaux, A. Artzy-Schnirman, D. Aili, I. Yarovsky and M. M. Stevens, Chem. Mater., 2015, 27, 5820–5824 CrossRef CAS
.
- S. Kiyonaka, S.-L. Zhou and I. Hamachi, Supramol. Chem., 2003, 15, 521–528 CrossRef CAS
.
- F. Ilmain, T. Tanaka and E. Kokufuta, Nature, 1991, 349, 400–401 CrossRef CAS
.
- J. B. Rothbard, T. C. Jessop, R. S. Lewis, B. A. Murray and P. A. Wender, J. Am. Chem. Soc., 2004, 126, 9506–9507 CrossRef CAS PubMed
.
- M. D. Yilmaz and J. Huskens, Soft Matter, 2012, 8, 11768–11780 RSC
.
- Y. Wang, H. Xu and X. Zhang, Adv. Mater., 2009, 21, 2849–2864 CrossRef CAS
.
- L.-B. Meng, W. Zhang, D. Li, Y. Li, X.-Y. Hu, L. Wang and G. Li, Chem. Commun., 2015, 51, 14381–14384 RSC
.
- K. R. Raghupathi, J. Guo, O. Munkhbat, P. Rangadurai and S. Thayumanavan, Acc. Chem. Res., 2014, 47, 2200–2211 CrossRef CAS PubMed
.
- F. Rodler, B. Schade, C. M. Jäger, S. Backes, F. Hampel, C. Böttcher, T. Clark and A. Hirsch, J. Am. Chem. Soc., 2015, 137, 3308–3317 CrossRef CAS PubMed
.
- B. J. Cafferty, R. R. Avirah, G. B. Schuster and N. V. Hud, Chem. Sci., 2014, 5, 4681–4686 RSC
.
- C. Stoffelen and J. Huskens, Nanoscale, 2015, 7, 7915–7919 RSC
.
- W. Cao, Y. Gu, T. Li and H. Xu, Chem. Commun., 2015, 51, 7069–7071 RSC
.
- X. Cai, L. Zhong, Y. Su, S. Lin and X. He, Polym. Chem., 2015, 6, 3875–3884 RSC
.
- C. Maiti, R. Banerjee, S. Maiti and D. Dhara, Langmuir, 2015, 31, 32–41 CrossRef CAS PubMed
.
- A. G. Baboul, L. A. Curtiss, P. C. Redfern and K. Raghavachari, J. Chem. Phys., 1999, 110, 7650–7657 CrossRef CAS
.
- K. V. Rao, K. Jayaramulu, T. K. Maji and S. J. George, Angew. Chem., Int. Ed., 2010, 49, 4218–4222 CrossRef CAS PubMed
.
- F. F. Xue, D. D. Yuan, A. Sahasrabudhe, S. Biswas, P. Wang, X.-Y. Tang, D. Chen, R. Yuan and S. Roy, New J. Chem., 2012, 36, 2541–2548 RSC
.
- X. Su, S. Voskian, R. P. Hughes and I. Aprahamian, Angew. Chem., Int. Ed., 2013, 52, 10734–10739 CrossRef CAS PubMed
.
- R. E. Bulo, D. Donadio, A. Laio, F. Molnar, J. Rieger and M. Parrinello, Macromolecules, 2007, 40, 3437–3442 CrossRef CAS
.
- L. de Campo, A. Yaghmur, L. Sagalowicz, M. E. Leser, H. Watzke and O. Glatter, Langmuir, 2004, 20, 5254–5261 CrossRef CAS PubMed
.
-
J. Lyklema, Fundamentals of Interface and Colloid Science: Solid-Liquid Interfaces, Elsevier Science, 1995 Search PubMed
.
- E. K. Hobbie, Langmuir, 1999, 15, 8807–8812 CrossRef CAS
.
Footnote |
| † Electronic supplementary information (ESI) available: The molecular weight distribution curve of PAA, high resolution images of the components of Fig. 6 and reference for computation section. See DOI: 10.1039/c5sm02732b |
| This journal is © The Royal Society of Chemistry 2016 |

