Sustainable syngas generation from methane: enhanced catalysis with metal-promoted nickel on silica–alumina composites†
Received
22nd April 2024
, Accepted 16th June 2024
First published on 17th June 2024
Abstract
To combat climate change and its association with emissions from fossil fuels, scientists are investigating sustainable substitutes. One promising approach is the dry reforming of methane, which turns greenhouse gases like CO2 and CH4 into lucrative syngas feedstock. However, catalyst optimization is necessary for effective dry reforming of methane. The optimum DRM conversion with perfect H2 to CO ratio can only be achieved by stabilizing active sites “Ni” against high temperatures and increasing the interaction of CO2 by using proper support and promoters. Investigating Ni catalysts on silica–alumina (SiAl) composites with promoters such as iridium (Ir), rhodium (Rh), ruthenium (Ru), platinum (Pt), and palladium (Pd) filled this research gap by modifying reducibility, basicity and crystallinity of the catalysts. The catalysts were analyzed by using different characterization approaches and optimized for the dry reforming of methane using a central composite design. The objectives were to determine the best promoter, optimize the procedure for maximum conversion rates and the optimal composition of syngas, and assess the catalytic characteristics. According to the results, Rh-promoted Ni catalysts performed the best, converting 93.1% of CO2 and 87.0% of CH4 under optimum circumstances, with an optimal H2/CO ratio of 0.99 for syngas. The NiRh/SiAl outperforms others due to the extraordinary degree of reduction and higher side of reducibility of NiO which undergoes moderate interaction with the support.
1. Introduction
Seasonal changes, extreme weather, and rising sea levels are all results of global warming, which is caused by an increase in greenhouse gases like carbon dioxide and methane from the burning of fossil fuels in industry.1,2 Even if renewable energy innovations are encouraging, fossil fuels continue to be widely used. This calls for the quick development of effective strategies to reduce emissions and lessen the growing effects of global warming on the environment.1–3
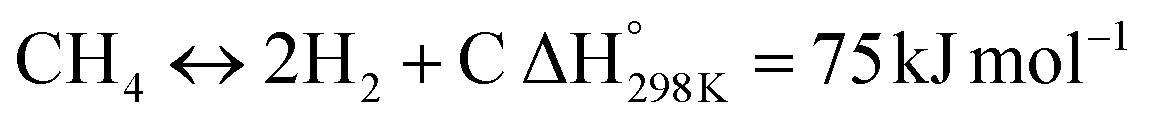
In this scenario, the conversion of methane (CH4) and carbon dioxide (CO2) into syngas, which is a mixture of hydrogen (H2) and carbon monoxide (CO), has shown great potential as a method for utilizing greenhouse gases as resources and reducing their negative impact on the environment.4 Syngas is a valuable chemical feedstock used in a variety of applications. Among various methods, the dry reforming of methane (DRM) has emerged as a promising approach for significantly reducing both CH4 and CO2 emissions.5–7 Steam reforming of natural gas, which yields grey hydrogen, is the most popular industrial method for producing syngas,8–10 as shown in eqn (1). The steam reforming process has two major problems: firstly, high emission of CO2, which reduces the system energy efficiency by 6–10% when the CO2 capture process is involved, and secondly because the H2 purity in the reformer gas is not high, additional operations such as purification, separation, and compression are required to achieve high purity of H2. This further incurs additional energy penalties. Nevertheless, steam reforming is the widely used method to create a hydrogen-rich synthesis gas. Despite higher energy consumption, the beauty of the DRM reaction is the consumption of two greenhouse gases, CH4 & CO2, making it more environmentally conscious than other reforming reactions (eqn (2)). So, it bears more interest in the production of synthetic fuel than steam reforming;11,12 it involves the reaction of methane with CO2 to produce syngas, as shown in eqn (2).
| |  | (1) |
| |  | (2) |
The DRM process not only utilizes two major greenhouse gases but also presents a solution for managing low-value streams like landfill gases.13 The implementation of DRM technology is facing certain challenges. The process requires a substantial amount of energy input, making it highly endothermic. In addition, it is crucial to develop catalysts that can remain active and stable at lower operating temperatures (approximately 650–750 °C).14 The catalysts that are to be developed must also be resistant to deactivation mechanisms such as sintering and coke formation, which can reduce their efficiency significantly over time.15,16
| |  | (3) |
| |  | (4) |
| |  | (5) |
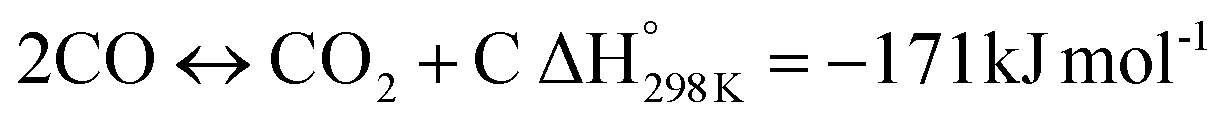
Eqn (3)–(5) represent the side reactions that are commonly observed during the operation of DRM, and they reduce its activity and stability. Therefore, the main challenges that need to be addressed for efficient operation include catalyst deactivation due to coking and competition from the reverse water gas shift reaction. DRM is a potential technique for cutting greenhouse gas emissions, and researchers are working to overcome weaknesses in the current catalysts. By investigating innovative nickel-based catalysts supported on silica–alumina composites, this study seeks to contribute. The goal is to find the best promoter—a noble metal such as palladium, ruthenium, platinum, iridium, or rhodium—that can increase the rates at which carbon dioxide (CO2) and methane (CH4) are converted in DRM at the same time.17 Our catalysts' efficiency will be evaluated at a reaction temperature of 700 °C, a space velocity of 42![[thin space (1/6-em)]](https://www.rsc.org/images/entities/char_2009.gif) 000 ml h−1 gcat−1, and a reaction time of 420 minutes.18,19 The selection of these promoters is grounded in their known impacts on catalyst activity and stability, which are crucial for the DRM reaction's overall efficiency.20 By doing so, we hope to address the existing challenges with catalyst performance in DRM and develop more effective catalysts.
000 ml h−1 gcat−1, and a reaction time of 420 minutes.18,19 The selection of these promoters is grounded in their known impacts on catalyst activity and stability, which are crucial for the DRM reaction's overall efficiency.20 By doing so, we hope to address the existing challenges with catalyst performance in DRM and develop more effective catalysts.
2. Experimental
2.1 Materials used
The experiment used commercially available silica–alumina with a 2:1 SiO2/Al2O3 ratio as the support material and ultrapure water from a Milli-Q system as the solvent. The metal precursors, including palladium nitrate dihydrate, ruthenium nitrate hexahydrate, rhodium nitrate hexahydrate, iridium nitrate, platinum nitrate, and nickel nitrate hexahydrate, were all purchased from Alfa Aesar and used without further purification.
2.2 Catalyst preparation
A series of nickel catalysts were synthesized using the wet impregnation method. Nickel nitrate hexahydrate (5 wt% loading) was the main active metal precursor, with promoters (palladium, platinum, iridium, ruthenium, or rhodium nitrate precursors) each at 1 wt% loading. All precursors were dissolved in stoichiometric quantities in 20 ml of ultrapure water and stirred magnetically for two hours at 80 °C to ensure complete dissolution and even dispersion on the support. The resultant slurry was dried overnight at 120 °C to remove excess water and solvents and then calcined at 800 °C for three hours to create stable, active catalyst sites. The calcined material was crushed into a powder and denoted as Ni + x/SiAl (x = Pd, Pt, Ir, Ru, Rh), where “x” denotes the specific promoter type. Section S1 in the ESI† provides a detailed justification for the 1 wt% promoter loading.
2.3 Catalyst performance evaluation
2.3.1 DRM reaction experiments.
The DRM tests were conducted at atmospheric pressure in a fixed-bed stainless-steel reactor, measuring 30 cm in length and 9.1 mm in diameter. The reactor was packed with quartz wool to support a precisely weighed catalyst bed (0.1 g), ensuring consistent contact between reactants and the catalyst. The reaction temperature was monitored using a K-type thermocouple placed inside the catalyst bed.
Prior to the reaction, the catalyst was reduced by flowing hydrogen gas (40 ml min−1) at 800 °C for 60 minutes. Post-reduction, any remaining hydrogen was purged by adjusting the reactor temperature to the desired reaction temperature (e.g., 700 °C) while maintaining a nitrogen flow rate of 15 ml min−1 for 30 minutes.
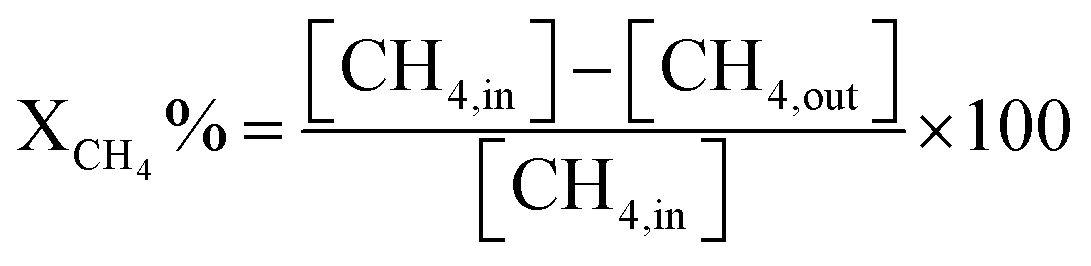
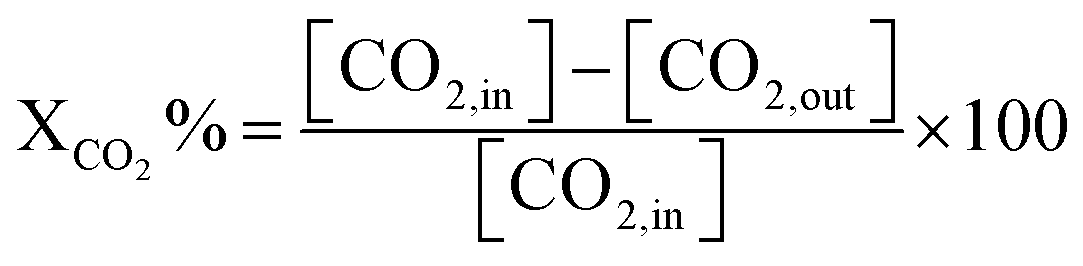
The DRM reaction commenced by introducing a feed mixture of methane, carbon dioxide, and nitrogen in a 3:3:1 ratio at a total flow rate of 70 ml min−1, corresponding to an hourly space velocity of 42000 ml (h−1 gcat−1). The conversions of methane (CH4) and carbon dioxide (CO2), as well as the hydrogen-to-carbon monoxide (H2/CO) ratio, were continuously monitored using an online gas chromatograph equipped with a thermal conductivity detector (TCD). This setup enabled precise and real-time analysis of the reactor outlet stream composition, providing accurate performance metrics for the catalysts under study.
| |  | (6) |
| |  | (7) |
| |  | (8) |
where [CH
4, in] represents the initial methane in the feed, [CH
4, out] is the methane output, and [H
2] and [CO] are the products after the reaction.
2.3.2 Experimental design and process optimization.
2.3.2.1 Central composite design.
Central composite design (CCD) offers a powerful approach to optimizing reforming processes by strategically selecting key variables such as temperature, feed ratio, and catalyst concentration. CCD involves three types of experiments: central points representing average values, axial points exploring high and low extremes, and star points pushing the boundaries even further. This comprehensive data collection allows researchers to build a mathematical model that captures not just the individual effects of these factors but also their complex interactions.
This model goes beyond merely summarizing data; it enables the prediction of reforming outcomes under various conditions. Notably, CCD achieves this with fewer experiments compared to traditional methods, making it a highly efficient approach. Ultimately, CCD empowers researchers to optimize the reforming process while gaining a deeper understanding of the intricate interplay between variables that govern the entire process.
The studied experimental factors comprise the space velocity, temperature, and CH4/CO2 molar ratio. Each of them has a lower limit of xi min and an upper limit of xi max. The mean value of xi over the interval [xi min, xi max] is termed the center of the interval in eqn (9)
| | ![[X with combining macron]](https://www.rsc.org/images/entities/i_char_0058_0304.gif) oi = (xi max + xi min)/2 oi = (xi max + xi min)/2 | (9) |
And the deviation of either limit from the mean is described in eqn (10)
| | | Δxi = xi max − xi min/2 | (10) |
In experimental design, the point with coordinates (
o1,
o2,
o3, …,
on) is called the center point of the design, which is a specific combination of the input variables that are typically included to allow for the detection of curvature in the response surface. These values are changed to code dimensionless variables
Xi in the range of +1 and −1 using the following transformation in
eqn (11)| |  | (11) |
where
xi is the original value of the ith input variable, and Δ
xi is the range of values for that variable.
In experimental design, the response of a system is often modeled as a function of the factors using a polynomial equation. The Taylor Series expansion can be used to derive this polynomial equation by approximating the response surface as a series of linear and quadratic terms or sometimes of third order.21 In our case, the full quadratic model with three factors, as shown in eqn (12), is preferable.
| |  | (12) |
where
Y is the response variable,
X1,
X2, and
X3 are the input coded or actual values of the factors that affect the response variable,
β0,
βi,
βij and
βii,
i,
j = 1, 2, 3 are the regression coefficients of intercept, linear, interaction, and quadratic terms, and
ε is the error term, which represents the random variation that is not explained by the independent variables.
22
2.3.2.2 Process optimization.
The process optimization was done by maximizing the response variables (CH4 conversion, CO2 conversion, and the H2/CO ratio) and using design experiment version 13, which has the optimization goals, so it gives many solutions that fit the required goals and selected the optimum conditions based on the solution with the highest desirability value. The ESI section contains details of the characterization (S2)† of the catalyst, aligning with the content presented in our paper (referenced).
3. Results
3.1 Catalyst textural properties
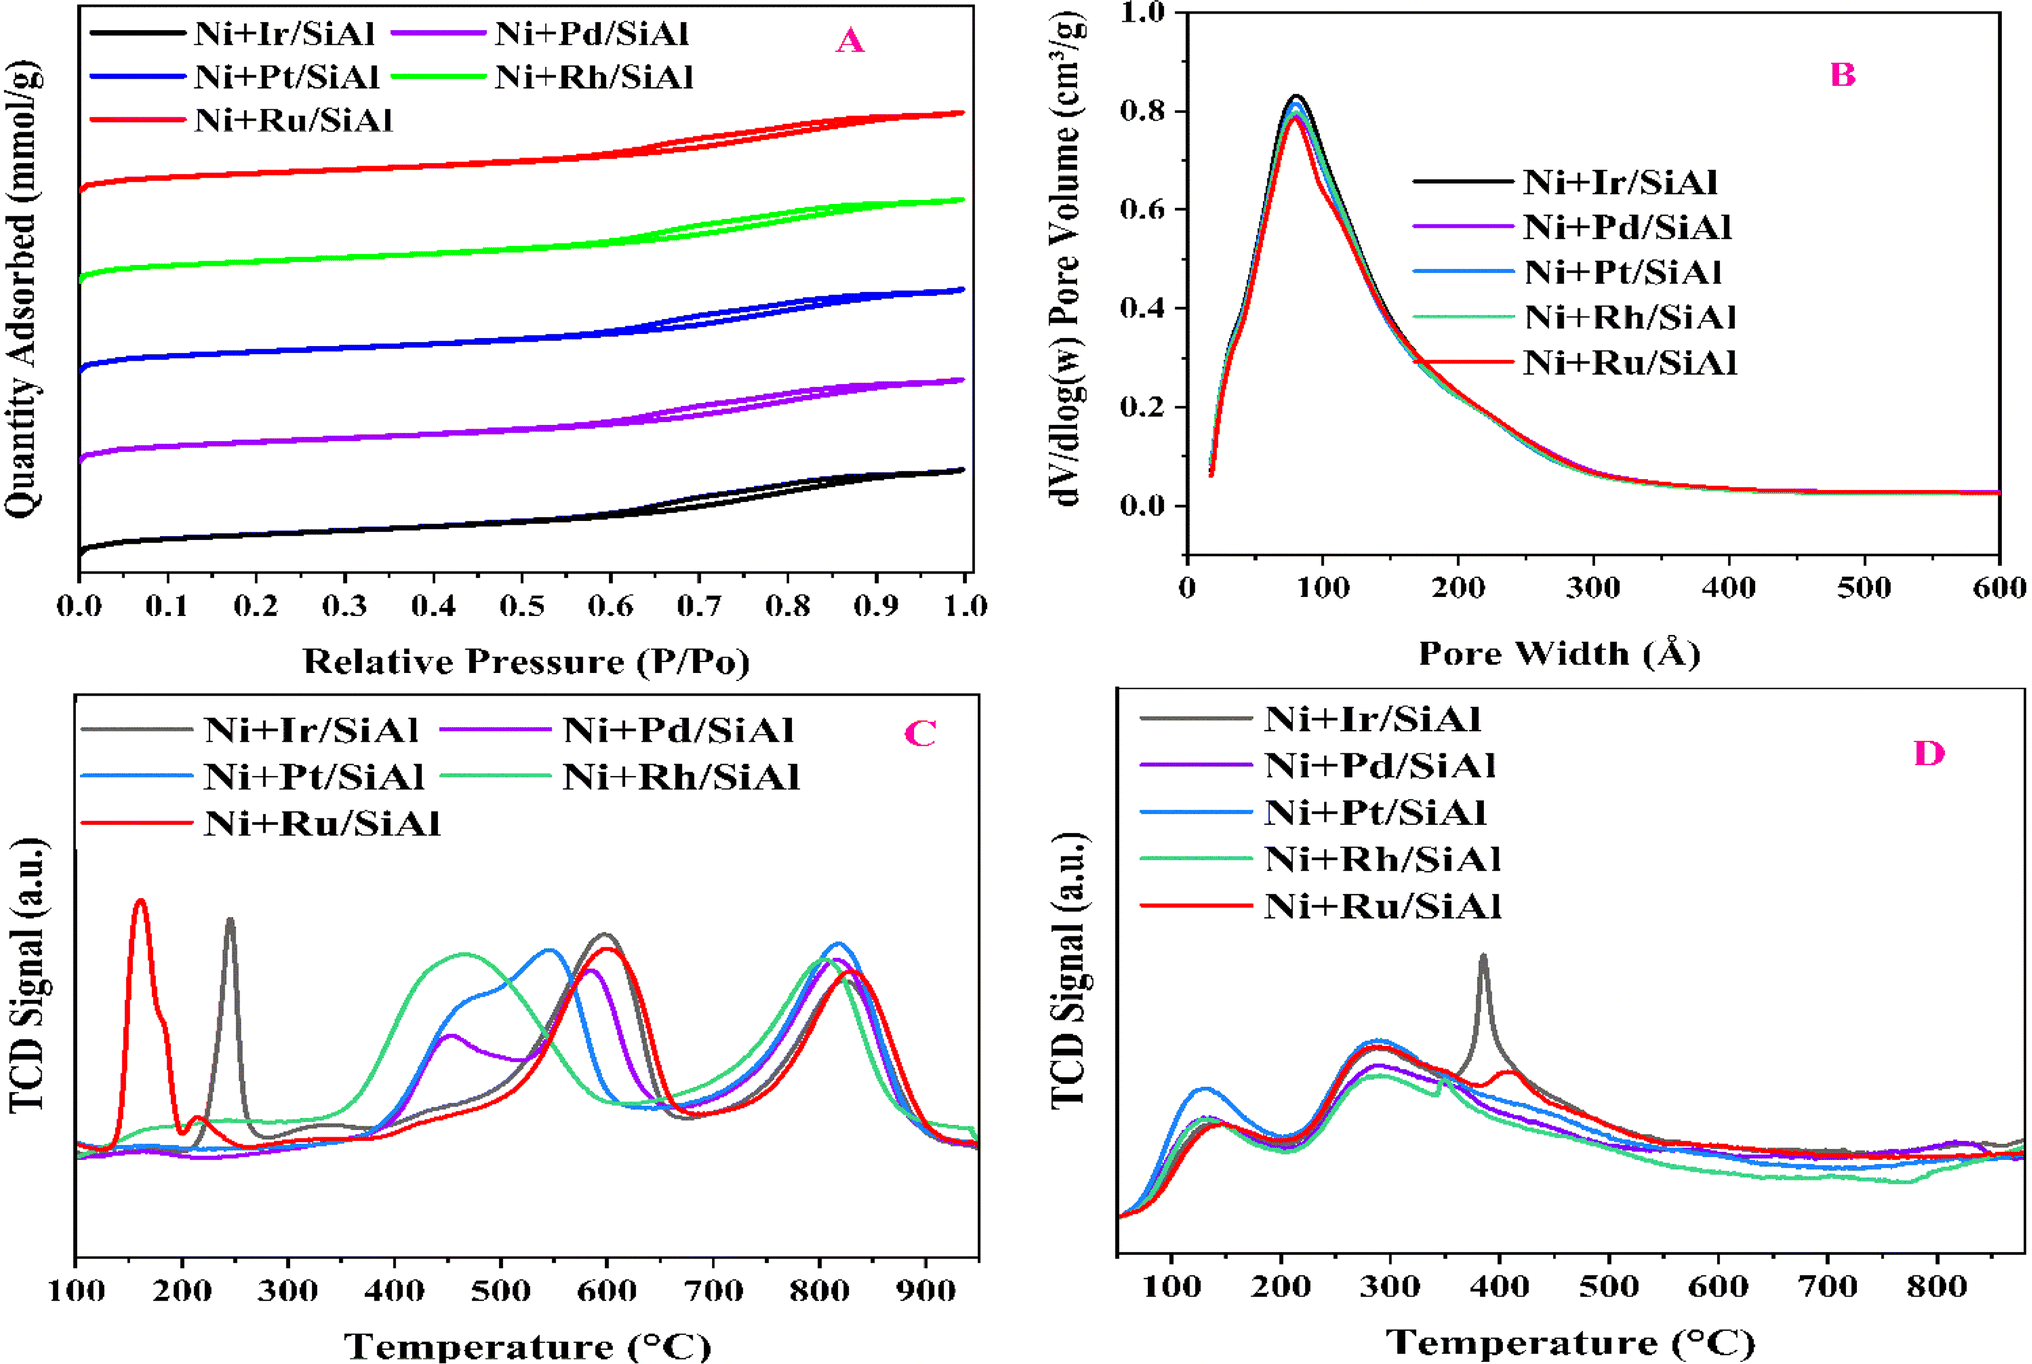
N2 adsorption–desorption isotherms show that all of the Ni + x/SiAl catalysts (where x = Ir, Pd, Pt, Rh, Ru) have a consistent mesoporous structure. Both the type IV isotherm and H1 hysteresis loop shown in Fig. 1 demonstrate this. The reversible adsorption and desorption curves show a narrow distribution of mesopores, and pores are free from the percolation effect. A similar type of pore size distribution profile of all catalysts shows homogeneity in pore distribution (Fig. 1b). Table 1 provides consistent values for all catalysts in terms of surface area (314–345 m2 g−1), pore volume (0.50–0.53 cm3 g−1), and pore diameter (6.3–6.5 nm). The narrow distribution of pores over high surface area samples shows the consistent flow of gas feed in the pore channels, adequately accessible active sites, and plenty of room for the interaction of reactants (CH4 & CO2) with the catalyst's active sites. These features imply that these catalysts have the potential for successful methane dry reforming.
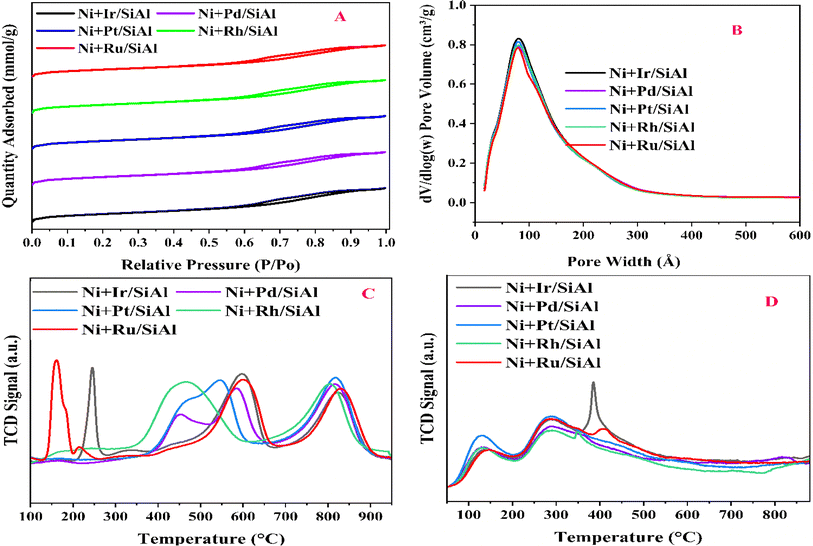 |
| | Fig. 1 (A) N2 adsorption–desorption isotherms and (B) BJH distribution of the catalyst samples; (C) H2-TPR (D) CO2-TPD of the catalysts. | |
Table 1 The textural aspect of the catalysts
| Catalyst |
Abbreviated sample |
BET-surface area (m2 g−1) |
Pore-volume (m3 g−1) |
Pore-size (nm) |
| 5% Ni + 1% Ir/62.7% SiO2 + 31.3% Al2O3 |
NiIr/SiAl |
341 |
0.53 |
6.4 |
| 5% Ni + 1% Pd/62.7% SiO2 + 31.3% Al2O3 |
NiPd/SiAl |
335 |
0.52 |
6.3 |
| 5% Ni + 1% Pt/62.7% SiO2 + 31.3% Al2O3 |
NiPt/SiAl |
345 |
0.52 |
6.3 |
| 5% Ni + 1% Rh/62.7% SiO2 + 31.3% Al2O3 |
NiRh/SiAl |
338 |
0.52 |
6.3 |
| 5% Ni + 1% Ru/62.7% SiO2 + 31.3% Al2O3 |
NiRu/SiAl |
314 |
0.50 |
6.5 |
3.2 H2-TPR and CO2-TPD analysis
H2-temperature programmed reduction (TPR) determines the ease with which a catalyst is reduced by hydrogen against temperature, revealing the degree of nickel (Ni) dispersion on the support material. Promoters can lower the Ni reduction temperature, potentially increasing activity during DRM. The number of peaks and their locations in H2-TPR profiles indicate different levels of interaction between Ni and the support.23 For instance, Ru-promoted and Ir-promoted catalysts show a low-temperature reduction peak for RuO2 at 150 °C and a reduction peak for IrO2 at 250 °C.21,24,25 Interestingly, all catalysts show reduction peaks in the intermediate temperature region (400–650 °C) and high-temperature region (700–900 °C). The former reflects the amount of H2 needed to reduce moderately interacting NiO, while the latter reflects the amount needed for strongly interacting NiO. Notably, the Rh-promoted catalyst shows a shift towards lower temperatures in the intermediate region, indicating higher reducibility. Rhodium dissociates H2 molecules into atomic hydrogen, which further reduces NiO at lower temperatures.26,27
Data from TPR analysis, such as those that may be seen in Table 2 (reduction percentage, hydrogen consumption, and turnover frequency), aid in the comparison of catalyst performance and the understanding of how promoters affect Ni dispersion for enhanced dry reforming activity. The degree of reduction is found to be maximum over the Rh-promoted catalyst.
Table 2 Hydrogen consumption during the TPR analysis
| Sample |
T (°C) |
Quantity (cm3 g−1 STP) |
Total H2 consumption from the TPR (cm3 g−1 STP) |
Degree of reductiona (%) |
TOFb (h−1) |
|
Degree of reduction (%) = (H2 consumption during H2-TPR/theoretical H2 required to complete the reduction 19.094 cm3 g−1 STP).
TOF = turnover frequency (h−1).
|
| NiIr/SiAl |
245.6 |
1.569 |
16.497 |
86.399 |
91.6 |
| 328.4 |
0.049 |
| 337.7 |
0.105 |
| 598.9 |
8.529 |
| 824.1804 |
6.425 |
| NiPd/SiAl |
448.1 |
1.428 |
16.520 |
86.519 |
93.0 |
| 584.0 |
7.416 |
| 669.0 |
0.029 |
| 816.2 |
7.795 |
| NiPt/SiAl |
546.6 |
10.093 |
18.981 |
99.408 |
101.0 |
| 644.7 |
0.035 |
| 817.5 |
8.853 |
| NiRh/SiAl |
239.2 |
0.131 |
19.752 |
103.446 |
153.0 |
| 250.3 |
0.133 |
| 289.0 |
0.020 |
| 466.5 |
10.809 |
| 622.6 |
0.031 |
| 805.3 |
8.494 |
| 942.7 |
0.134 |
| NiRu/SiAl |
160.2 |
2.856 |
18.272 |
95.699 |
107.0 |
| 214.9 |
0.089 |
| 600.1 |
8.382 |
| 689.7 |
0.024 |
| 831.1 |
6.921 |
Temperature-Programmed Desorption (TPD) analysis looks at the strength of CO2 molecules' binding to the catalyst surface. Weaker CO2-catalyst bonds are indicated by lower desorption temperatures, which is advantageous for dry reforming. Because of the weaker binding, CO2 may activate more easily, which encourages syngas formation. The CO2-desorption profile shows the extent of interaction of CO2 with the catalyst surface against temperature. While the release at intermediate temperatures (200–450 °C) supports medium-strength sites (perhaps surface oxygen anions), the observed diffuse CO2 release at low temperatures (100–150 °C) suggests weak binding sites (presumably hydroxyl groups).23,28 The earlier one is said to be medium strength basic sites, whereas the latter one is weak strength basic sites. A captivating correlation between activity and surface characteristics was found by analyzing the catalysts. With a dominating peak in the intermediate temperature range, the Ir-promoted catalyst indicates a significant concentration of medium-strength basic sites, which may be impeding its overall activity. On the other hand, the remaining catalysts have roughly a similar basicity pattern.
3.3 Catalytic activity
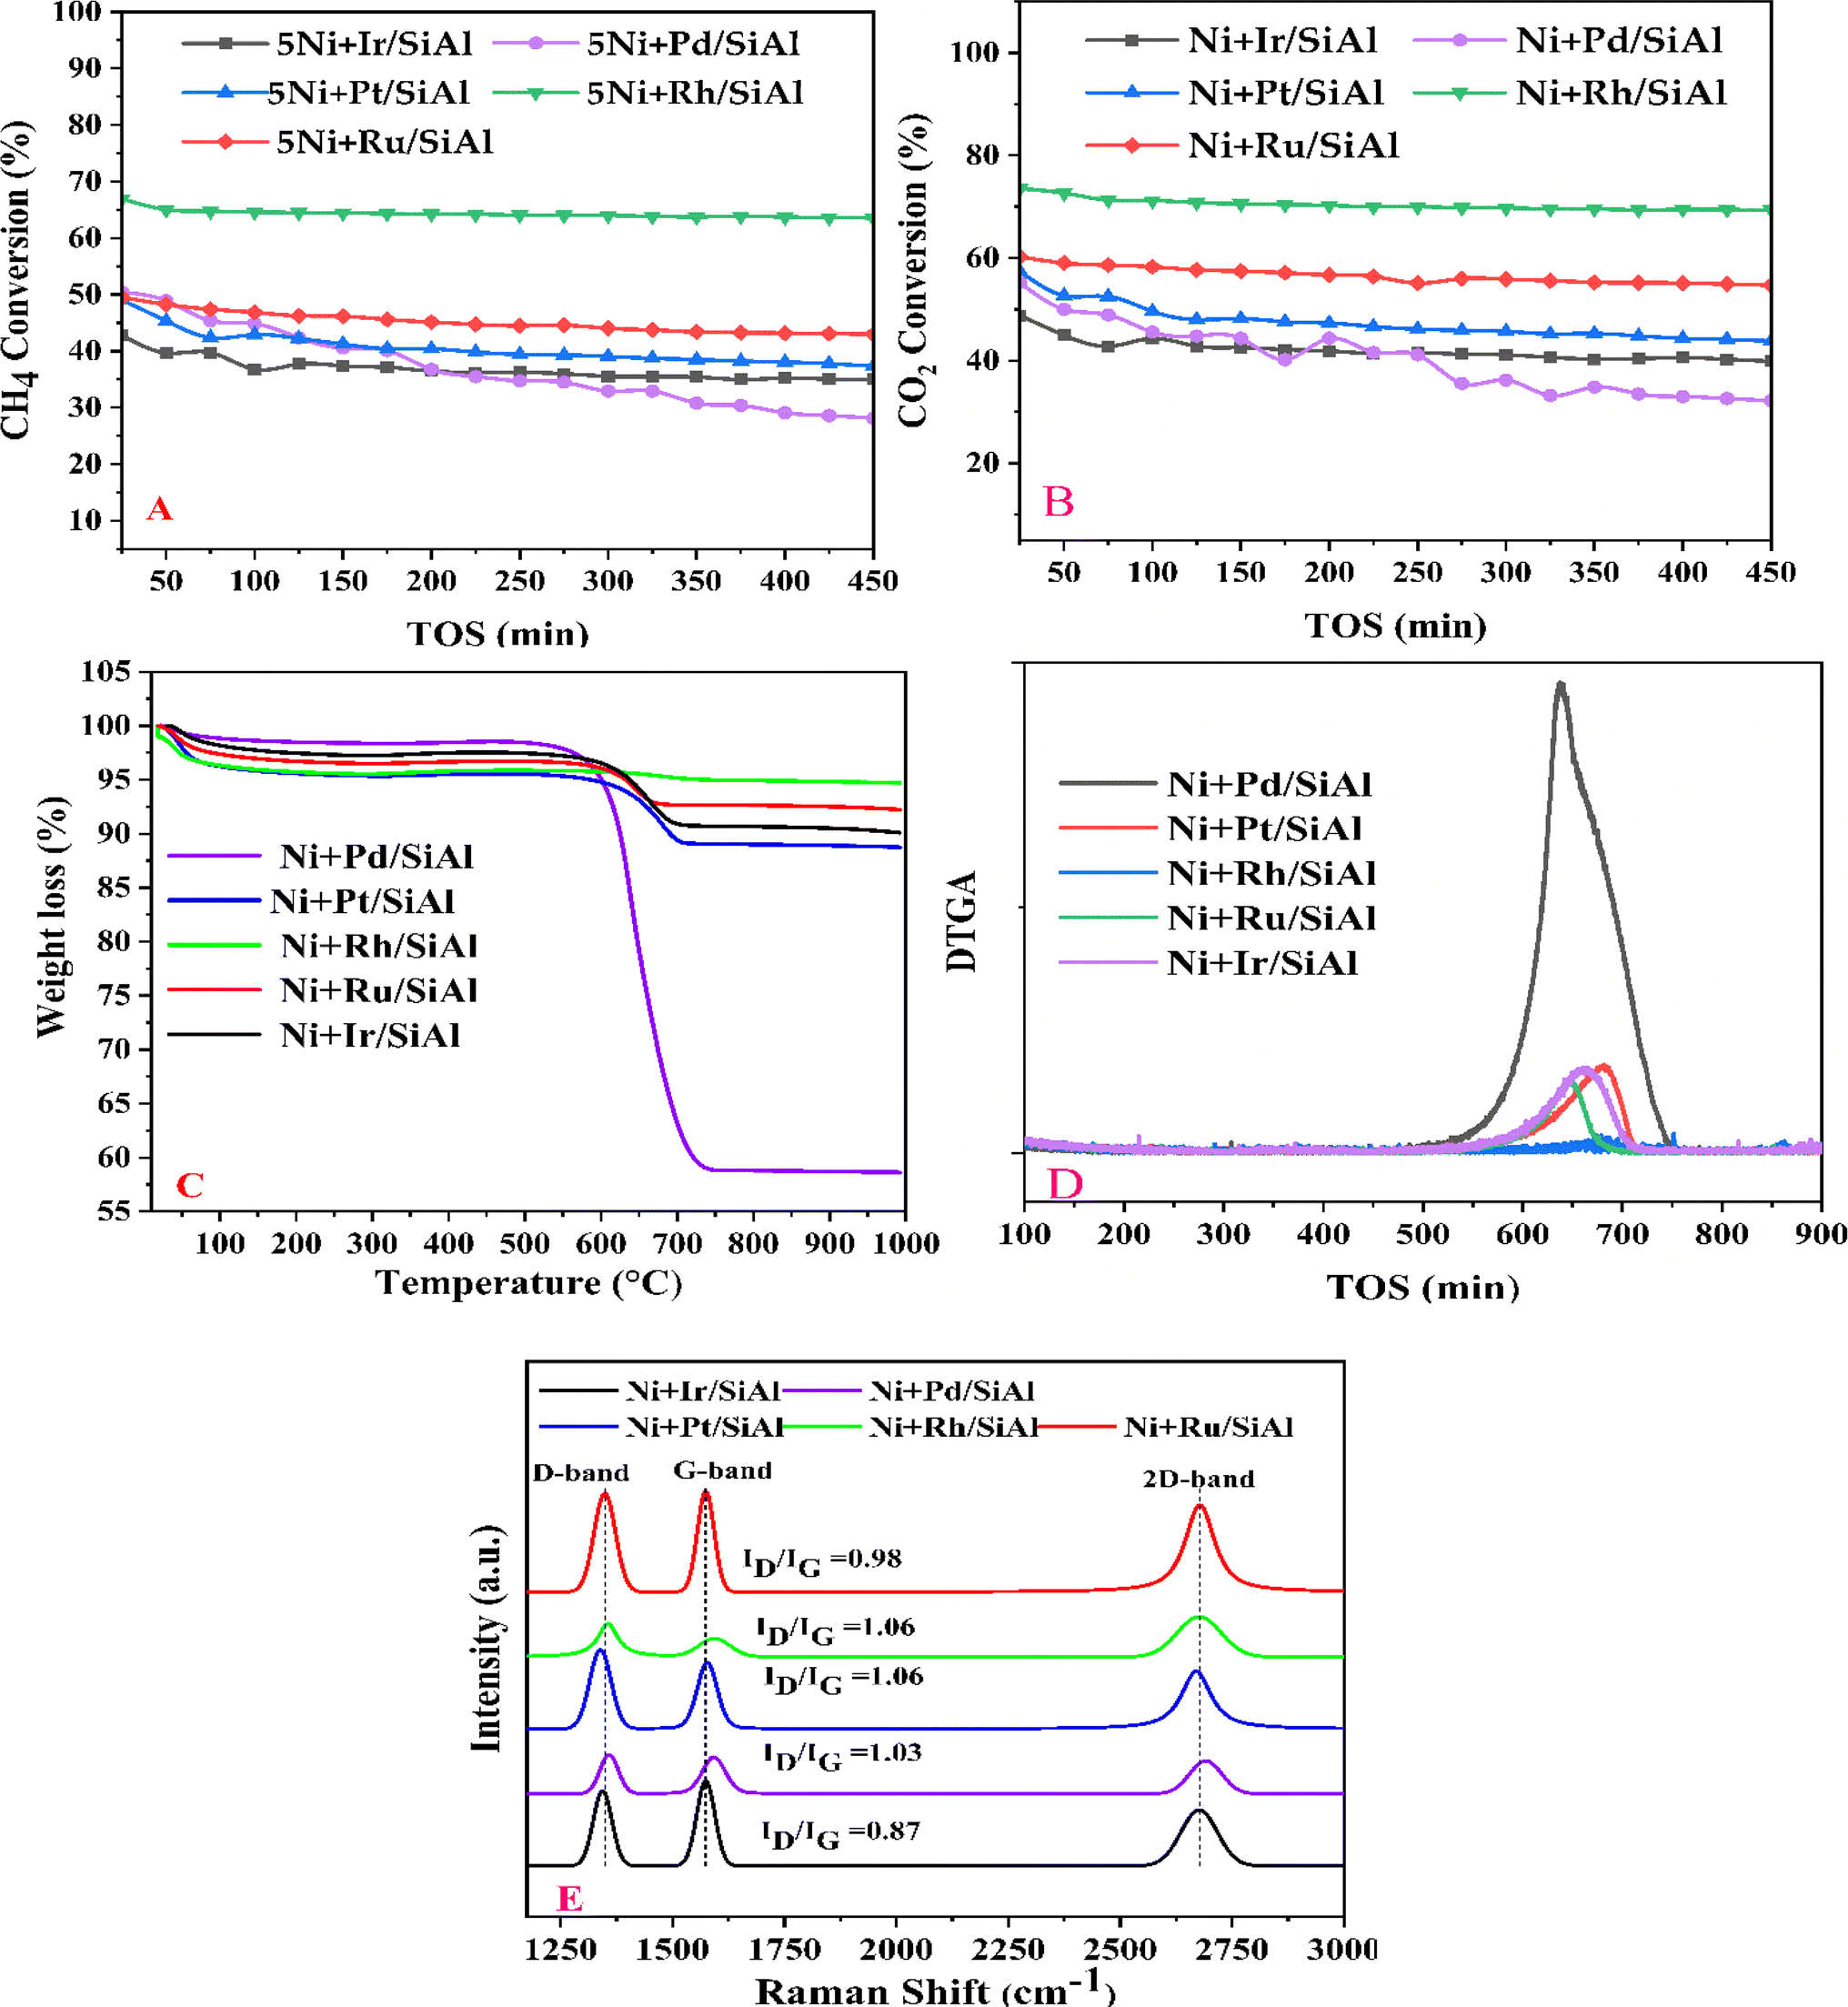
Before evaluating the catalysts, a catalytic performance test was conducted using an empty stainless-steel reactor at a reaction temperature of 700 °C, maintaining a comparable feed ratio. The reported conversions of CO2 (0.2%) and CH4 (1.6%) from this test indicate that the metallic reactor had a negligible contribution to the reactions. Fig. 2A and B illustrate the CH4 and CO2 conversions achieved with the different catalysts. Among the catalysts, the NiRh/SiAl sample exhibited the highest average CH4 conversion, reaching approximately 65.2%. The NiRh/SiAl catalyst also demonstrated the highest CO2 average conversion, reaching about 71.5%. In contrast, the NiRu/SiAl, NiPt/SiAl, NiPd/SiAl, and NiIr/SiAl catalysts achieved lower CH4 and CO2 average conversions, with values ranging from 38.8% to 46.3% for CH4 and 43.7% to 57.5% for CO2. Notably, the NiPd/SiAl and NiIr/SiAl catalysts displayed the lowest activity performance. It's worth highlighting that the CO2 conversion values exceeded the corresponding CH4 conversions in all catalyst samples, possibly influenced by the reverse water gas shift's side reaction, which consumed generated H2 (as shown in eqn (3)).23 The data presented in Table 2 further emphasize the superior activity of the Rh-promoted catalyst. This is verified by its highest degree of reduction (103%) and the highest turnover frequency (153), indicating its exceptional catalytic performance. According to Table 2, the NiRh/SiAl catalyst showed the best reduction degree (103%) among all the catalysts, indicating that it had a better ability to convert metal oxides into active sites (Ni and Rh) compared to the other catalysts. This was further confirmed by the TEM images of the fresh NiRh/SiAl catalyst (Fig. 3C), which showed a well-dispersed honeycomb-like structure with a uniform distribution of Ni and Rh metals throughout the support. This suggests that Rh could have promoted the reduction process, leading to the creation of more well-dispersed active sites for methane conversion. Table S1† displays the various % average conversion of the investigated catalysts in this work operated at 700 °C. Table S2† compares the findings of this study with those previously published for Ni-based catalyst systems promoted by noble and non-noble metals.
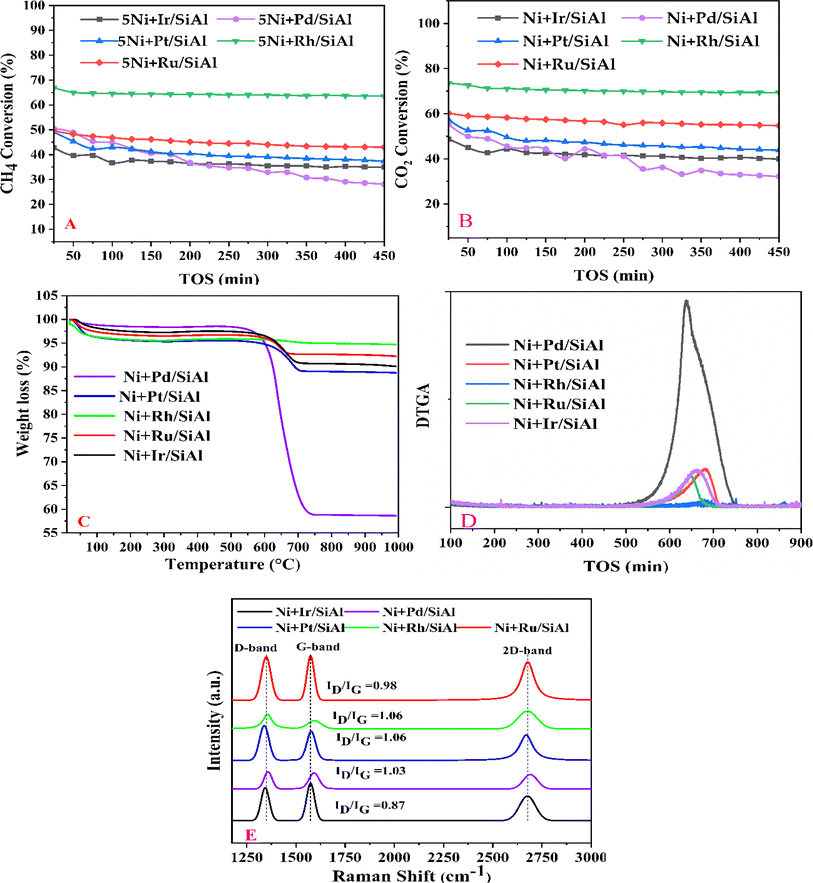 |
| | Fig. 2 Catalytic activity results: (A) CH4 conversion (%) and (B) CO2 conversion (%) vs. time on stream performed at 700 °C and GHSV of 30000 ml h−1 gcat−1; (C) thermo-gravimetric analysis (D) derivative (DTG) of spent catalysts over five hours in the time on stream test; (E) Raman spectra of the used catalysts. | |
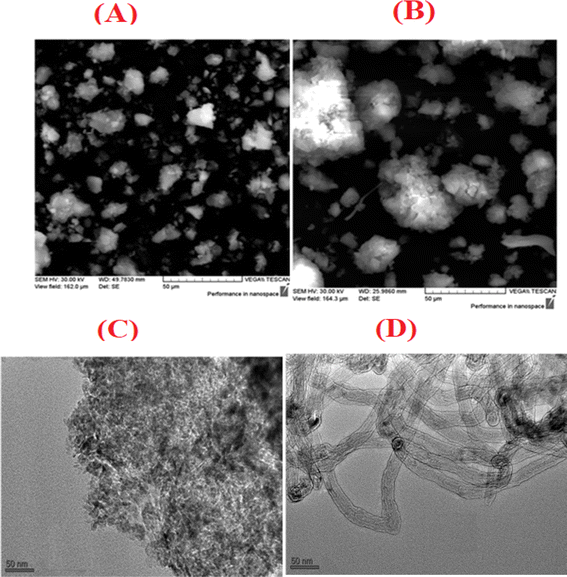 |
| | Fig. 3 SEM images of (A) fresh and (B) used NiRh/SiAl catalysts; TEM images of (C) fresh and (D) used NiRh/SiAl catalysts. | |
3.4 TGA and DTG
The assessment of carbon deposition was carried out through thermogravimetric analysis (TGA). Fig. 2C and D provide insights into the weight loss of carbon deposits on the catalyst samples and their derivatives. Fig. 2C illustrates the proportion of total weight loss, with the NiPd/SiAl catalyst exhibiting the highest weight loss at 41.2%. It was followed by the NiPt/SiAl, NiIr/SiAl, NiRu/SiAl, and NiRh/SiAl catalysts, which displayed weight losses of 11.2%, 9.9%, 8.9%, and 5.0%, respectively, under reaction conditions of 700 °C for 5 hours. Notably, the weight loss of carbon deposited on the NiRh/SiAl catalyst aligned well with its high catalytic activity. Fig. 2D presents the derivative of TGA (DTG), with the observed peak around 400 °C attributed to the oxidation of easily gasifiable amorphous carbon, as indicated in the literature.23 Carbon nanotube (CNT)-type coke, which is more challenging to gasify, exhibited a peak around 500 °C, while the most challenging-to-gasify graphite-like coke displayed a peak above 600 °C. The DTG profiles of the catalysts revealed the presence of graphite-like coke, with maximum peaks observed at temperatures of 637 °C, 643 °C, 644 °C, 676 °C, and 682 °C for NiPd/SiAl, NiRu/SiAl, NiIr/SiAl, NiRh/SiAl, and NiPt/SiAl, respectively.
Interestingly, the least active catalyst, NiPd/SiAl, exhibited the highest peak intensity, while the most active catalyst, NiRh/SiAl, displayed the lowest peak intensity. The effective functioning of a catalyst depends on the minimization of carbon deposition on its surface. If carbon deposition is kept in check, more active sites remain accessible on the catalyst surface, allowing it to adsorb and activate methane molecules, which leads to sustained conversion efficiency. However, if there is excessive carbon deposition, it can create a physical barrier that hinders the diffusion of reactant molecules CH4 towards the active sites within the catalyst pores. This limitation reduces the overall reaction rate, which ultimately affects long-term performance. Carbon accumulation can also act as an insulator, negatively impacting the transfer of heat within the catalyst, causing uneven temperature distribution, and potentially creating hotspots. In dry reforming of CH4, such hotspots can trigger undesirable side reactions or even damage the catalyst structure, compromising long-term operation. The type of coke that accumulates on a catalyst surface can significantly affect its deactivation severity. Amorphous carbon is a less stable form of carbon that is easier to remove through high-temperature treatments, and the catalyst is less prone to forming it during long-term operation. As a result, it requires less frequent regeneration cycles, and the catalyst's performance is better sustained. Graphitic coke, on the other hand, is a highly stable but more detrimental form of carbon that is difficult to remove and can permanently block active sites, leading to a significant and irreversible loss of catalytic activity. The analysis shows that catalysts that mainly form graphitic coke experience a steeper decline in performance over time. Additionally, the structure of carbon nanotubes can also form during methane conversion, which can physically block active sites and hinder mass transfer, although it is less common than other types of coke. By controlling the type of coke formed and minimizing carbon deposition, catalysts can maintain their activity for a long time, making them more efficient for methane conversion applications.
3.5 Raman spectroscopy analysis
The type and level of graphitization of carbon deposits on spent catalysts were examined using Raman spectroscopy. The typical peaks for each catalyst are displayed in Fig. 2E: the G band, approximately at 1576 cm−1, suggests graphitic structures, whereas the D band, around 1350 cm−1, indicates disordered carbon. The presence of graphitic carbon is further confirmed by the 2D band, which appears only in graphite.29,30
The degree of graphitization is quantified by the ratio (ID/IG) of the intensities of the D and G bands. Remarkably, the Ni + Ir/SiAl samples exhibit a lower ID/IG ratio compared to other catalysts with similar ratios around 1, indicating less disordered and possibly more graphitized carbon. This suggests that the Ni + Ir/SiAl catalyst may possess better structural integrity and stability due to the higher level of graphitization of the carbon deposits.
3.6 SEM analysis
SEM analysis results, displayed in Fig. 3A and B, feature both fresh and used NiRh/SiAl catalysts. The SEM images reveal the presence of bright spots of varying sizes and shapes, representing the Ni and Rh particles. These particles primarily exhibit irregular shapes with some smooth surfaces, while the support material appears black in the images. The SEM image of the fresh catalyst showcases a well-distributed active metal surface. However, the image of the used catalyst displays sintered particles resulting from the reaction. The ESI† section includes a re-evaluation of the scanning electron microscopy (SEM) analysis of the fresh NiRh/SiAl catalyst. This analysis incorporates energy-dispersive X-ray spectroscopy (EDX) to determine the composition. Fig. S1 and S2 in the ESI† section present the results of SEM and EDX, respectively. The EDX composition results serve to validate and closely align with the intended design values for the catalyst preparation.
3.7 TEM analysis
Transmission electron microscopy (TEM) analysis reveals significant differences between the fresh and spent NiRh/SiAl catalysts. The fresh NiRh/SiAl catalyst displays a uniform and dispersed structure, while the spent NiRh/SiAl catalyst is populated with carbon nanotubes (CNTs), with the widths of the nanotubes being relatively uniform. The metal particles are spherical and uniformly sized.
For the used catalyst, the TEM observations are consistent with the results from TGA and Raman spectroscopy, which identify the carbon deposition resulting from the catalyst's activity in converting methane into carbon-based compounds. A higher degree of carbon deposition, as determined by these methods, correlates with a greater number of visible CNTs in the TEM images, indicating a higher conversion of methane into nanotubes. This highlights the catalyst's effectiveness and the extent of its carbon deposition during the DRM process.
3.8 Effect of reaction temperature
Fig. 4 shows how endothermic processes should behave, with CH4 and CO2 conversions increasing as temperature increases. The Arrhenius equation (eqn (13) and (14)) describes this relationship among the temperature (T), rate constant (k), and activation energy (E). The rate constant (k) is proportional to the rate of consumption of CH4 or the rate of consumption of CO2. When the rate of consumption of CH4 or rate of consumption of CO2 is expressed equivalently by rate constant (k), activation energy is called apparent activation energy (Ea) and the Arrhenius equation is represented as follows.| |  | (13) |
where A is the pre-exponential factor and R is the universal gas constant.
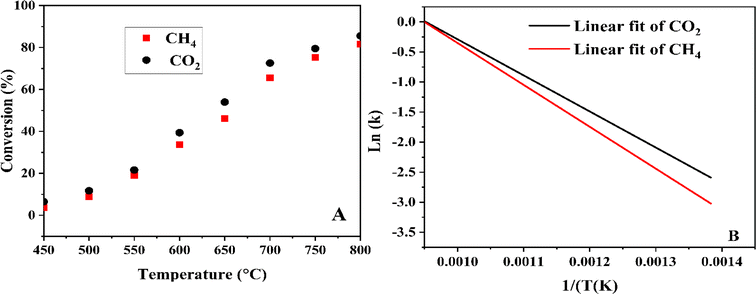 |
| | Fig. 4 Reaction temperatures on CH4 and CO2 conversions (A) and their corresponding linear fits using the Arrhenius equation (B). | |
Eqn (14) is obtained by taking the logarithm of eqn (13) as follows:
| |  | (14) |
After measuring the rate constant at various temperatures, a straight line is obtained by plotting ln(k) versus 1/T. As is shown in eqn (14), the slope represents −Ea/R, and the intercept stands for the ln of the pre-exponential factor (A). R is the universal gas constant (R = 8.314 J mol−1). In Table 3, the feed (CH4 and CO2) conversions for different reaction temperatures are presented.
Table 3 The feed (CH4 and CO2) conversions for different reaction temperatures
|
T (°C) |
T (K) |
% CH4 conv. |
CH4 conv. |
% CO2 conv. |
CO2 conv. |
CH4 ln(k) |
CO2 ln(k) |
1/T (K) |
| 450 |
723 |
3.66 |
0.0366 |
6.5 |
0.065 |
−3.3077 |
−2.7334 |
0.00138 |
| 500 |
773 |
8.74 |
0.0874 |
11.7 |
0.117 |
−2.4373 |
−2.1456 |
0.00129 |
| 550 |
823 |
18.96 |
0.1896 |
21.6 |
0.216 |
−1.6628 |
−1.5325 |
0.00122 |
| 600 |
873 |
33.75 |
0.3375 |
39.39 |
0.3939 |
−1.0862 |
−0.9317 |
0.00115 |
| 650 |
923 |
46.06 |
0.4606 |
53.98 |
0.5398 |
−0.7752 |
−0.6166 |
0.00108 |
| 700 |
973 |
65.5 |
0.655 |
72.6 |
0.726 |
−0.4231 |
−0.3202 |
0.00103 |
| 750 |
1023 |
75.2 |
0.752 |
79.5 |
0.795 |
−0.285 |
−0.2294 |
0.00098 |
| 800 |
1073 |
81.6 |
0.816 |
85.6 |
0.856 |
−0.2033 |
−0.1555 |
0.00093 |
The linear fit in Fig. 4B can be resolved to yield the Arrhenius equation parameters, and Table 4 shows the calculated parameters of the Arrhenius equation.
Table 4 The computed parameters of the Arrhenius equation
|
|
CH4 |
CO2 |
| Intercept |
6.62 |
5.72 |
| Slope |
−6969.6 |
−6004.5 |
| Pre-exponential factor (A) |
749.0 |
303.5 |
| Activation energy (Ea) |
56.7 kJ mol−1 |
48.8 kJ mol−1 |
3.9 Predictive analysis and process optimization
The robustness of data fitting is examined by analysis of variance (ANOVA).31Table 5 lists the actual values of the studied factors.
Table 5 Actual and coded values for the process parameters
| Process parameter |
Levels |
| Low |
High |
|
Gas hour space velocity (ccg−1 h−1) = the space velocity is based only on CH4 and CO2, excluding N2.
|
| Gas hour space velocity (ccg−1 h−1)a |
22000 |
42000 |
| Temperature (°C) |
700 |
800 |
| CH4/CO2 |
0.5 |
1 |
3.9.1 Process modelling and analysis of variance.
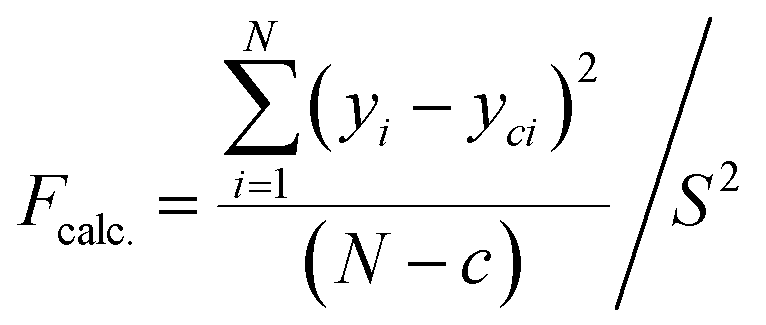
Introducing the transformation of response variables serves as a technique to stabilize response variance, normalize the distribution of the response variable, and enhance the model's data fitting. The Central Composite Design (CCD) method was used to identify a suitable power transformation for normalizing or equalizing the variance of the response data.32 The variance analysis and prediction statistics presented in Table 6 were computed to assess the adequacy of the regression models. Elevated F-values and low-significance P-values suggest the significance of the models, encompassing all terms in the polynomial equations within the approximately 95% confidence limits. The substantial R2 values indicate the well-fitted nature of all experimental results within the models, as suggested by Fig. 9. A coefficient with P-values below 0.05 implies a significant effect on the response, considering a 95% confidence level. A more decisive criterion involves calculating an F-value defined by eqn (15):| |  | (15) |
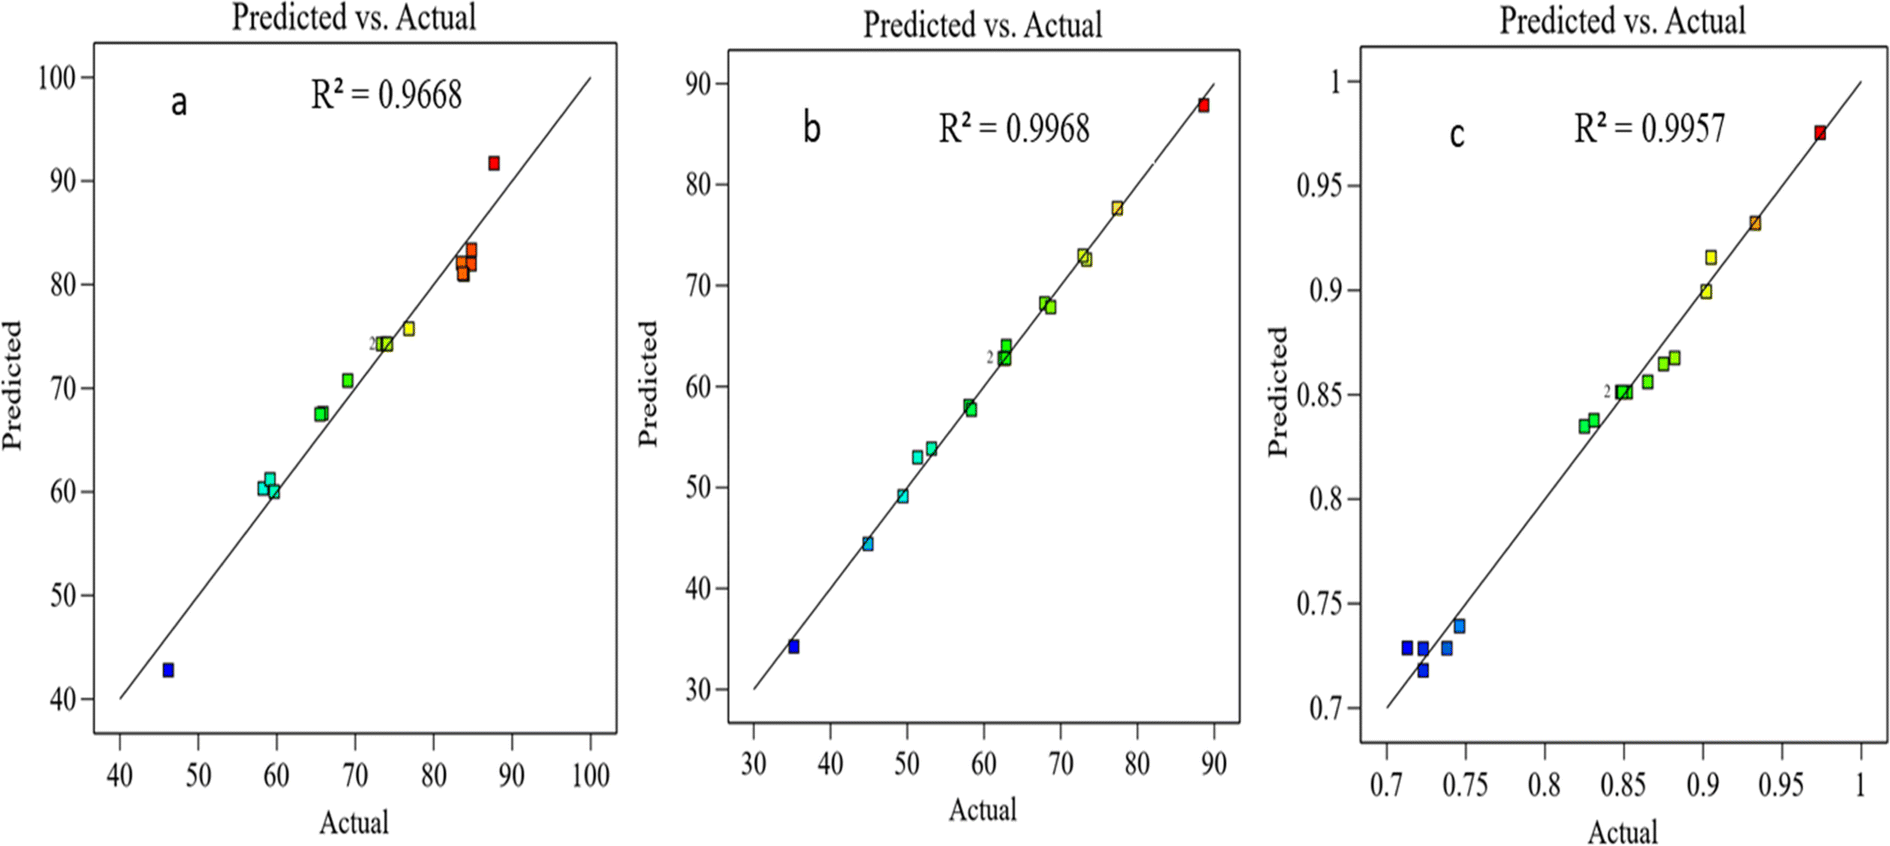
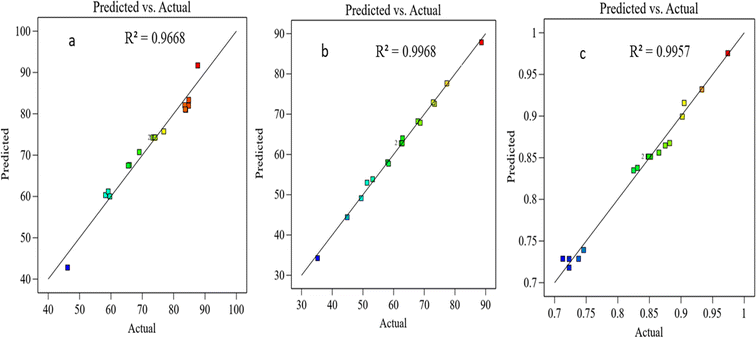
where N represents the total number of observations or data points, the variance of replicate readings at the center of the design is denoted as S2, and c represents the count of eliminated coefficients (those rejected or deemed insignificant for the response) in the regression equation. This is then juxtaposed with the critical F-value derived, for example, from the FINV function in Excel, with degrees of freedom for the numerator (d.f.n) equal to (N − c) and degrees of freedom for the denominator (d.f.d) equal to (r − 1), where r is the number of replications at the center of the design. At a significance level of 0.05, if the calculated F-value (Fcalc.) is less than the tabulated F-value (Ftable), it signifies that the obtained regression equation model adequately fits the experimental data. The examination of the regression models' validity involved comparing the predicted responses with their respective experimental data in Table 7. Fig. 5 shows the plots of the actual values of CH4 and CO2 conversion and H2/CO ratio and their comparable predicted values from the CCD model. The proximity of data to the 45° straight line affirms the model's reliability, where there are robust correlations between the actual (experimental) data and their predicted values derived from the CCD model.33–35
Table 6 Statistics and analysis of variance for multiple regression and various components
| Source |
Sum of squares |
df |
Mean square |
F-value |
P-value |
|
Space velocity = the space velocity is based only on CH4 and CO2, excluding N2.
|
|
Response 1: CH
4
conversion reduced quadratic model (R
2
= 0.9668)
|
| Model |
2203.19 |
7 |
314.74 |
41.59 |
<0.0001 |
|
A = temperature |
1205.16 |
1 |
1205.16 |
159.24 |
<0.0001 |
|
B = space velocitya |
447.69 |
1 |
447.69 |
59.15 |
<0.0001 |
|
C = CH4/CO2 ratio |
460.91 |
1 |
460.91 |
60.9 |
<0.0001 |
| AB |
25.03 |
1 |
25.03 |
3.31 |
0.099 |
| AC |
12.13 |
1 |
12.13 |
1.6 |
0.2342 |
| BC |
4.49 |
1 |
4.49 |
0.5926 |
0.4592 |
|
A
2
|
47.79 |
1 |
47.79 |
6.31 |
0.0308 |
|
|
Response 2: CO
2
conversion reduced quadratic model (R
2
= 0.9968) |
| Model |
2653.59 |
4 |
663.4 |
1025.17 |
<0.0001 |
|
A = temperature |
960.99 |
1 |
960.99 |
1485.05 |
<0.0001 |
|
B = space velocitya |
258.78 |
1 |
258.78 |
399.89 |
<0.0001 |
|
C = CH4/CO2 ratio |
1420.39 |
1 |
1420.39 |
2194.97 |
<0.0001 |
|
C
2
|
13.44 |
1 |
13.44 |
20.77 |
0.0005 |
|
|
Response 3: H
2
/CO – reduced quadratic model (R
2
= 0.9956) |
| Model |
0.1001 |
6 |
0.0167 |
163.61 |
<0.0001 |
|
A = temperature |
0.0027 |
1 |
0.0027 |
26.37 |
0.0003 |
|
B = space velocitya |
0.0018 |
1 |
0.0018 |
17.87 |
0.0014 |
|
C = CH4/CO2 ratio |
0.0876 |
1 |
0.0876 |
858.8 |
<0.0001 |
| AC |
0.0037 |
1 |
0.0037 |
36.67 |
<0.0001 |
| BC |
0.0005 |
1 |
0.0005 |
5.18 |
0.0439 |
|
C
2
|
0.0038 |
1 |
0.0038 |
36.77 |
<0.0001 |
Table 7 Experimental (exp.) data and predicted (pred.) results for various components of the reaction system
| Run |
Factors |
CH4 conversion % |
CO2 conversion % |
H2/CO |
| T |
SVa |
CH4/CO2 |
Exp. |
Pred. |
MAPE |
Exp. |
Pred. |
MAPE |
Exp. |
Pred. |
MAPE |
|
SV = the space velocity is based only on CH4 and CO2, excluding N2.
|
| 1 |
700 |
32000 |
0.75 |
59.67 |
60.02 |
0.59 |
51.35 |
52.98 |
3.17 |
0.825 |
0.8349 |
1.20 |
| 2 |
750 |
32000 |
0.75 |
73.9 |
74.28 |
0.51 |
62.5 |
62.79 |
0.46 |
0.848 |
0.8513 |
0.39 |
| 3 |
800 |
32000 |
0.75 |
84.78 |
81.97 |
3.31 |
73.36 |
72.59 |
1.05 |
0.882 |
0.8677 |
1.62 |
| 4 |
700 |
22000 |
0.5 |
76.84 |
75.75 |
1.42 |
44.89 |
44.41 |
1.07 |
0.746 |
0.7392 |
0.91 |
| 5 |
750 |
22000 |
0.75 |
83.87 |
80.97 |
3.46 |
68.69 |
67.87 |
1.19 |
0.875 |
0.8648 |
1.17 |
| 6 |
700 |
42000 |
1 |
46.18 |
42.79 |
7.34 |
58.03 |
58.07 |
0.07 |
0.865 |
0.8562 |
1.02 |
| 7 |
750 |
42000 |
0.75 |
65.89 |
67.58 |
2.56 |
58.36 |
57.7 |
1.13 |
0.831 |
0.8378 |
0.82 |
| 8 |
750 |
32000 |
0.5 |
83.69 |
81.06 |
3.14 |
49.45 |
49.13 |
0.65 |
0.738 |
0.7286 |
1.27 |
| 9 |
750 |
32000 |
1 |
65.51 |
67.49 |
3.02 |
72.89 |
72.96 |
0.10 |
0.905 |
0.9158 |
1.19 |
| 10 |
800 |
22000 |
1 |
83.54 |
82.09 |
1.74 |
88.64 |
87.85 |
0.89 |
0.974 |
0.9755 |
0.15 |
| 11 |
750 |
32000 |
0.75 |
73.9 |
74.28 |
0.51 |
62.5 |
62.79 |
0.46 |
0.848 |
0.8513 |
0.39 |
| 12 |
750 |
32000 |
0.75 |
74.1 |
74.28 |
0.24 |
62.84 |
62.79 |
0.08 |
0.849 |
0.8513 |
0.27 |
| 13 |
700 |
42000 |
0.5 |
58.26 |
60.33 |
3.55 |
35.23 |
34.24 |
2.81 |
0.723 |
0.7285 |
0.76 |
| 14 |
800 |
42000 |
0.5 |
84.81 |
83.36 |
1.71 |
53.17 |
53.84 |
1.26 |
0.723 |
0.718 |
0.69 |
| 15 |
750 |
32000 |
0.75 |
73.34 |
74.28 |
1.28 |
62.68 |
62.79 |
0.18 |
0.852 |
0.8513 |
0.08 |
| 16 |
800 |
42000 |
1 |
69.04 |
70.75 |
2.48 |
77.36 |
77.68 |
0.41 |
0.933 |
0.9322 |
0.09 |
| 17 |
800 |
22000 |
0.5 |
87.7 |
91.71 |
4.57 |
62.9 |
64.02 |
1.78 |
0.713 |
0.7288 |
2.22 |
| 18 |
700 |
22000 |
1 |
59.14 |
61.21 |
3.50 |
67.9 |
68.25 |
0.52 |
0.902 |
0.8994 |
0.29 |
|
|
|
|
|
|
Mean |
2.50 |
|
Mean |
0.96 |
|
Mean |
0.81 |
 |
| | Fig. 5 The experimental and predicted data for (a) CH4 conversion, (b) CO2 conversion, and (c) H2/CO ratio. | |
Here df (degrees of freedom) represents the number of values in the final calculation of a statistic that are free to vary, the F-value is the ratio of error mean square to model mean square, and the P-value is the probability of observing a value of F greater than what was observed, assuming equal means in various populations. For more details, see, for example, in ref. 33–35.
3.9.2 Final equation in terms of actual factors.
Based on the experimental data, employing ANOVA at a significance level (α) of 0.05 and subsequent identification of significant factor effects while excluding the insignificant ones, and utilizing Design-Expert software version 13, the best models have been suggested as follows.| | | CH4 conversion % = −653.27355 + 1.99989 × T − 0.003098 × SV − 91.447 × CH4/CO2 + 0.0000035 × T × SV + 0.0985 × T × CH4/CO2 − 0.0003 × SV × CH4/CO2 − 0.001312 × T2 | (16) |
| | | CO2 conversion % = −119.3866 + 0.19606 × T − 0.000509 × SV + 89.408 × CH4/CO2 − 27.824 × (CH4/CO2)2 | (17) |
| | | H2/CO = 1.00133 − 0.00097 × T + 0.0000011 × SV − 0.1219 × CH4/CO2 + 0.00173 × T × CH4/CO2 − 0.0000031 × SV × CH4/CO2 − 0.4648 × (CH4/CO2)2 | (18) |
The models incorporate intercept term coefficients signifying the expected response variable value when all factors are zero. Additionally, they encompass main effects, denoting the linear impact of factors, representing the change in the response variable for a one-unit increase in the factor while keeping other factors constant. The models also include terms accounting for quadratic effects, capturing nonlinear relationships between the factors and the response variable.
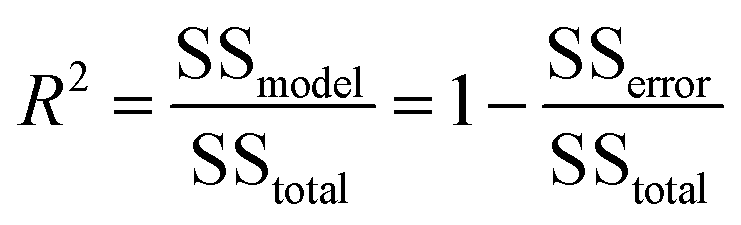
According to the coefficient of the determination R2, eqn (19), which is a statistical metric on a convenient scale ranging from 0% to 100%, indicating the adequacy of fit in the models, essentially gauging how well the model aligns with the data. The first fitted model explains that around 96.68% of the CH4 conversion variation, the second explains around 99.68% of the CO2 conversion variation, and the third model explains around 99.56% of the H2/CO variation: the remaining variations are attributed to factors beyond the scope of the experiment. It is noteworthy that the overall variation in the response variable (SStotal) is divided into two components. The sum of squares attributed to the fitted model (SSmodel) and the unexplained variation, represented by the sum of squares due to errors (SSerror) in eqn (20). A higher R2 value indicates a more precise description of the relationship between variables, as it corresponds to a smaller SSerror.
| |  | (19) |
| |  | (20) |
where
n is the total number of experiments,
Ei and
Pi denote the experimental/actual and predicted values of the ith observation, and
Ē is the mean value of the response variable across all observations.
In the following, Table 6 represents the experimental and predicted values of the response variables according to the suggested models (16)–(18).
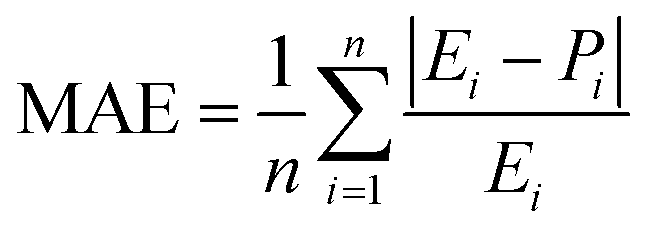
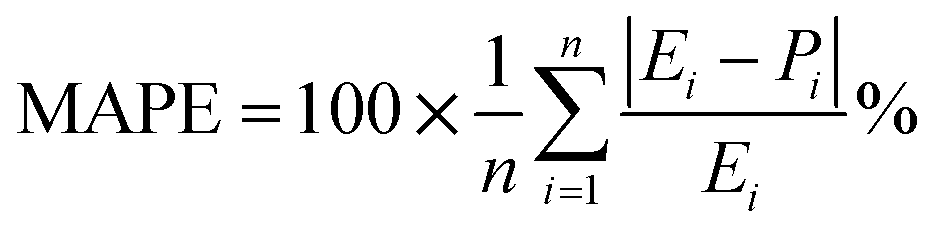
As demonstrated in Table 7, the proximity observed between the predicted responses from the fitted models and the actual values is evident in the low absolute error rates for each case, as indicated by the mean absolute error percentage. We have MAPEs = 2.50, 0.96, and 0.81 for the fitted models of CH4 and CO2 conversions and H2/CO, respectively. The MAPE formula is shown in eqn (16).
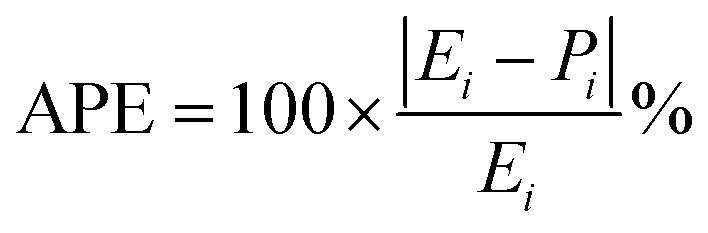
3.9.3 Models’ accuracy.
The precision of the predicted models determined through the application of the Central Composite Design (CCD) methodology, underwent evaluation using various mathematical metrics. These included R2, as presented in eqn (12), absolute percentage error (APE), mean absolute percentage error (MAPE) and mean absolute errors (MAE) detailed in eqn (21) through (23). A graphical representation of predicted versus actual values serves as a means to assess the model's performance and compare it to the null model. In the case of a well-fitted model, the points should closely align with the fitted line, characterized by narrow confidence bands. Points deviating significantly from the mean exert more influence on the fitted line, while those considerably distant from the line might signify potential outliers. Both of these factors can negatively affect the fit of the model. Fig. 5a–c represent the actual and predicted values of the response variables, CH4 conversion and CO2 conversion and H2/CO respectively. It is observed that the predicted and actual values are close to the straight line X(actual) = Y(predicted); this is another indication of the quality and accuracy of the suggested models. Also, as shown in the regression analysis results in Table 5, there is a strong correlation (R2 near to 1) between the predicted CCD models and experimental values. Overall, it is observed that there is a good agreement between the model's predictions and the experimental data.| |  | (21) |
| |  | (22) |
| |  | (23) |
3.9.4 Simulation of the Design Expert program.
3.9.4.1 One factor effect (2D) plot.
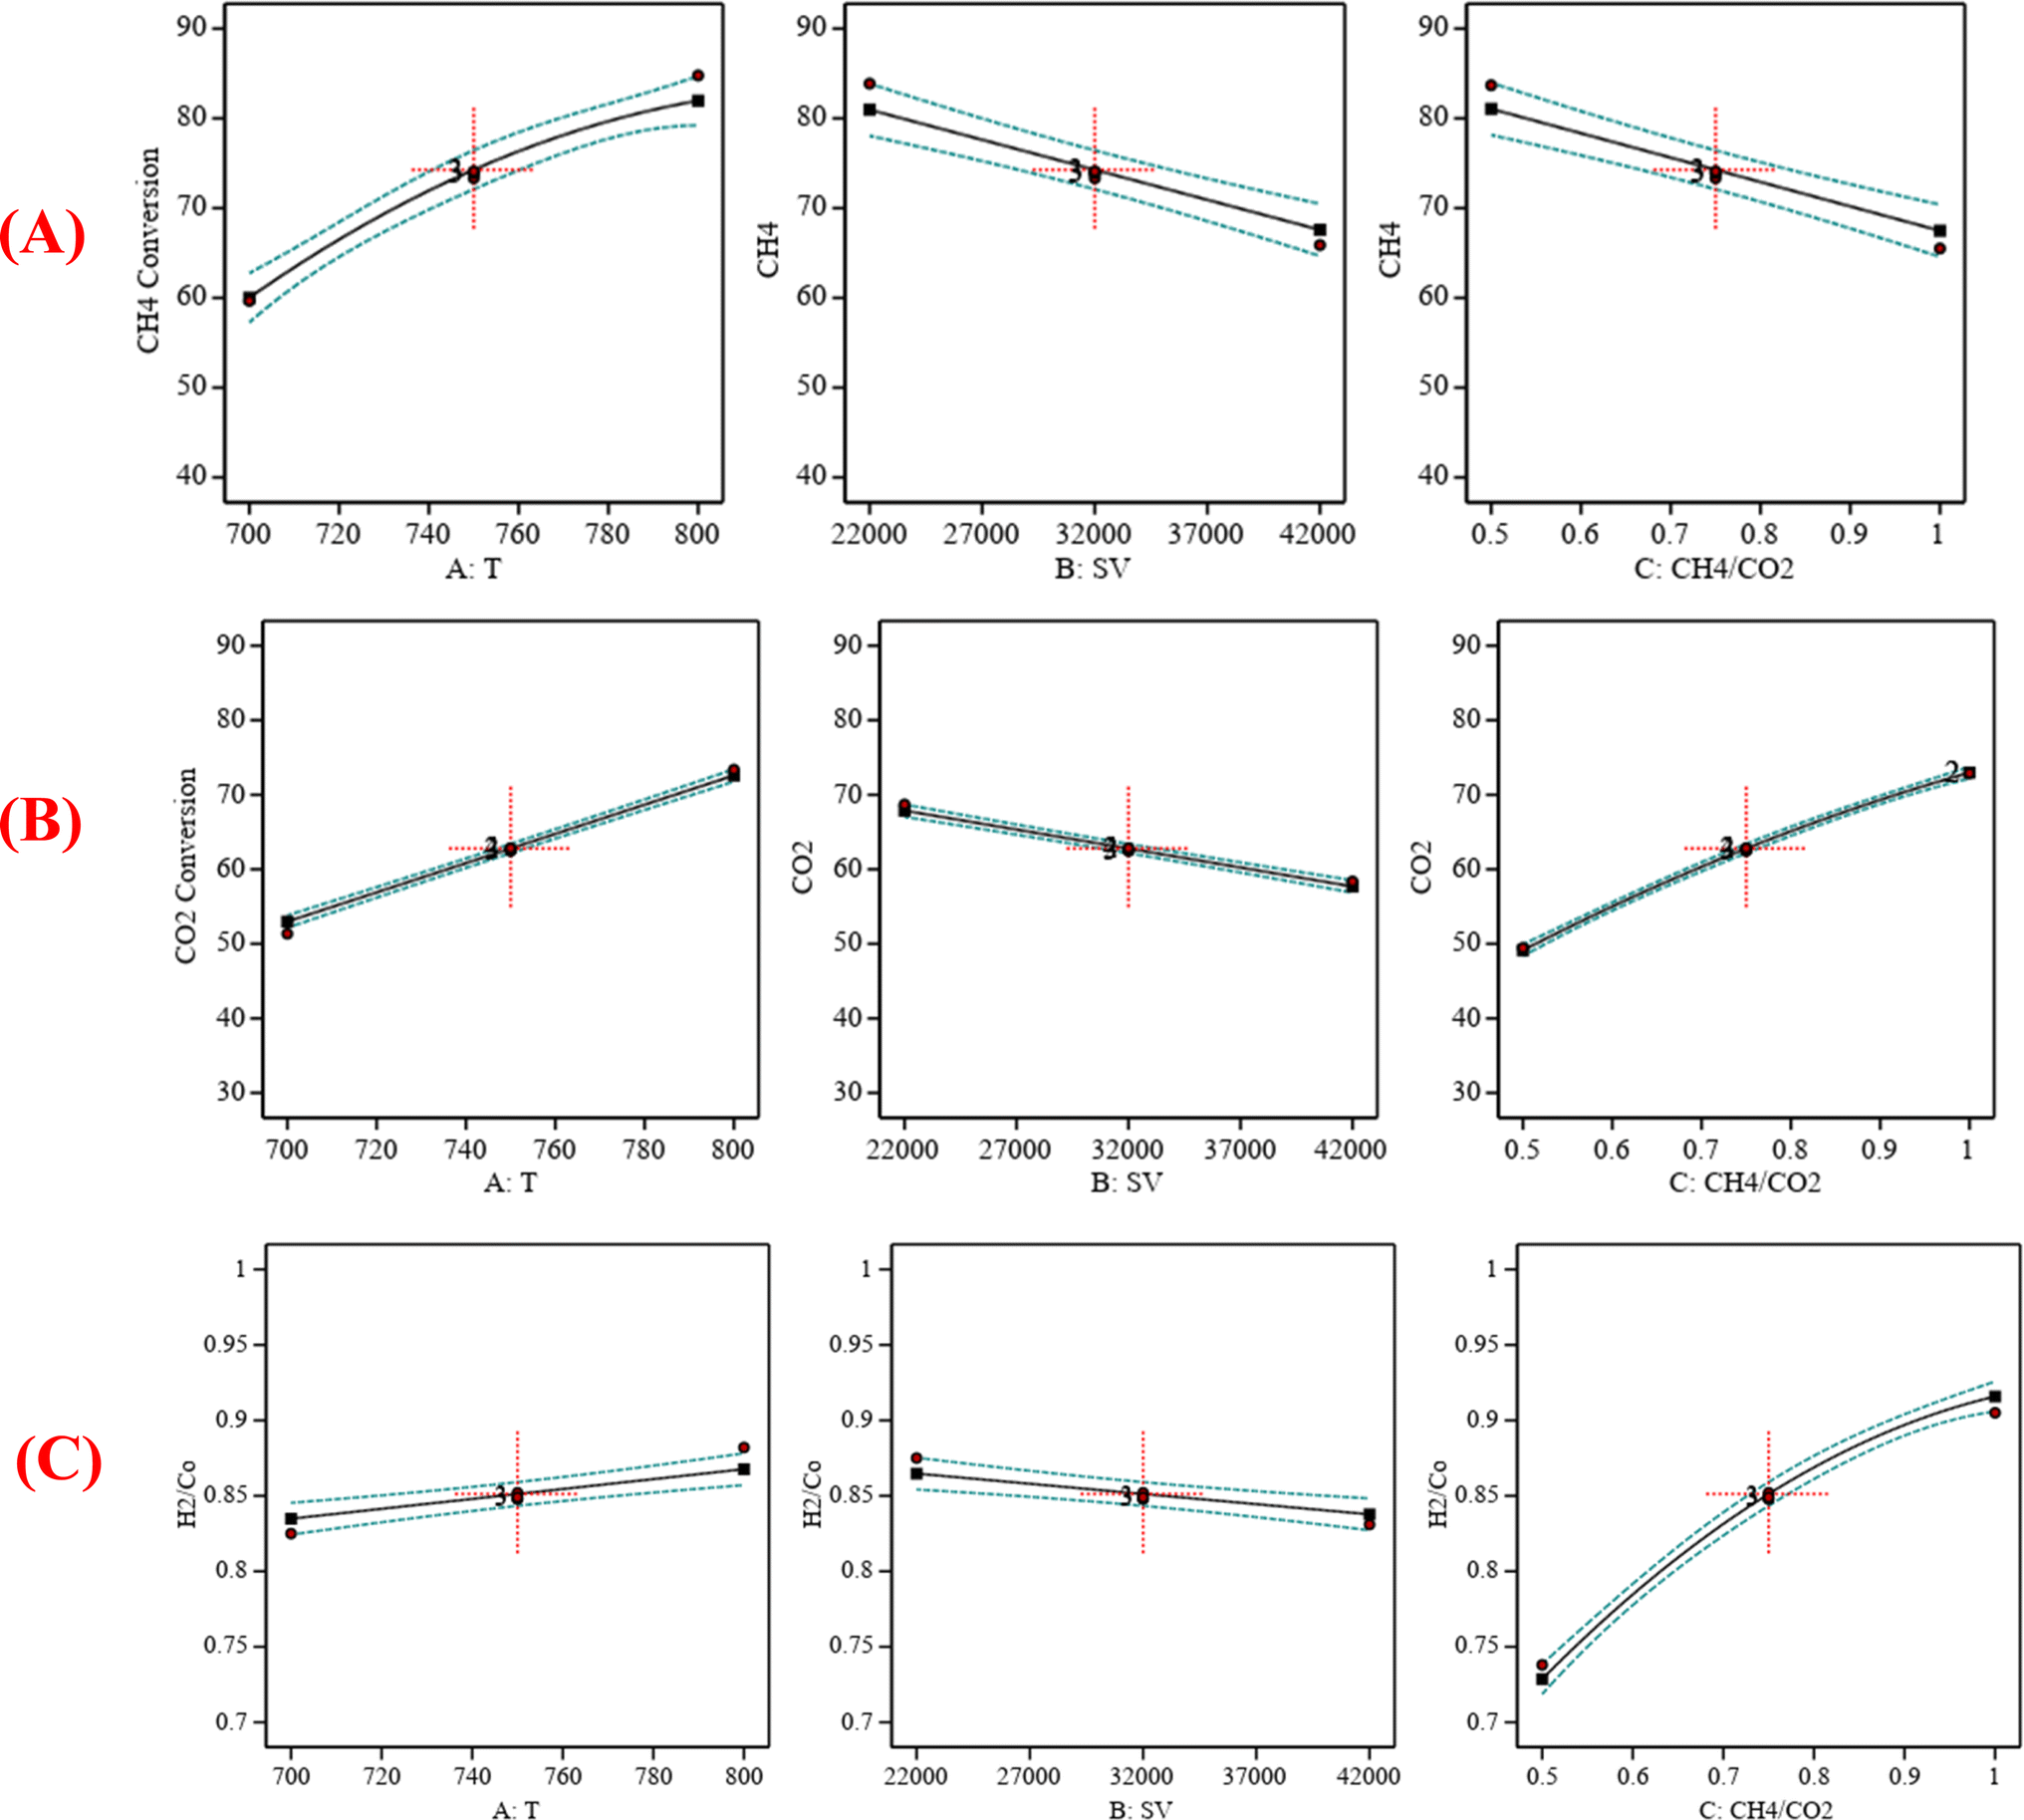
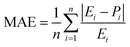
The effect of each process parameter on the reaction responses at A (temperature) = 750 °C, B (SV) = 32000 ccg−1 h−1 and C (CH4:CO2) = 0.75 is shown in Fig. 6. Fig. 6A indicates that increasing the temperature, decreasing the GHSV value, and decreasing the CH4:CO2 ratio will increase CH4 conversion. Fig. 6B indicates that increasing the temperature, decreasing the GHSV value, and increasing the CH4:CO2 ratio will increase CO2 conversion. Fig. 6C indicates that increasing the temperature, decreasing the GHSV value, and increasing the CH4:CO2 ratio will increase H2/Co.
 |
| | Fig. 6 (A) The relationship between the reaction parameters and CH4 conversion percentage; (B) the relationship between the reaction parameters and CO2 conversion percentage; (C) the relationship between the reaction parameters and H2/CO ratio. | |
 |
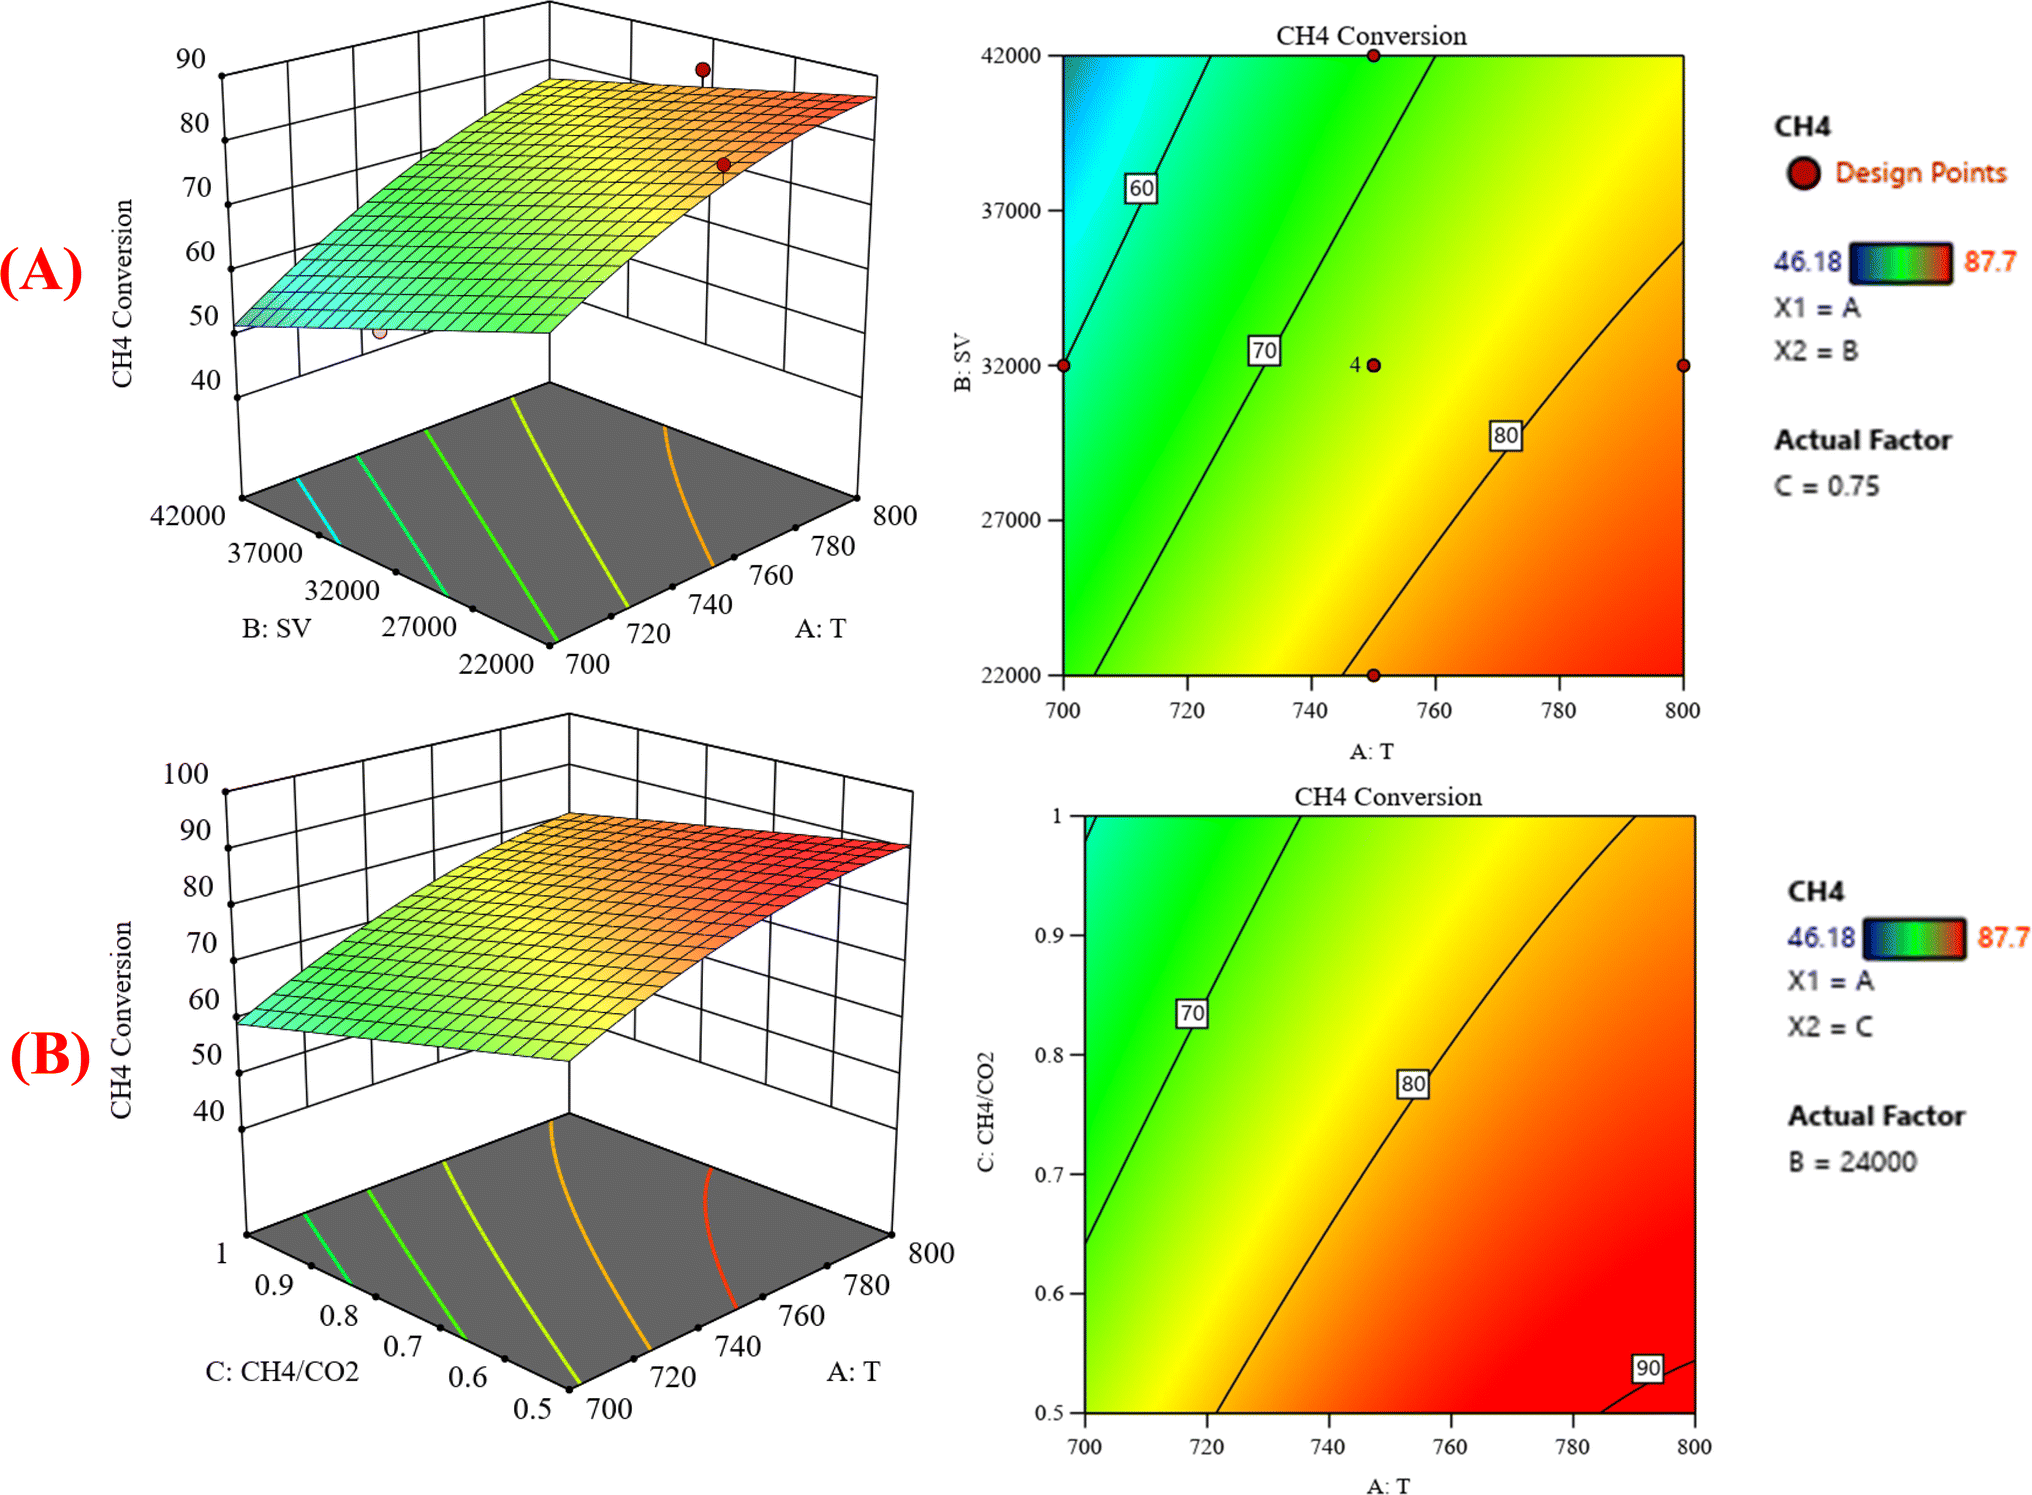
| | Fig. 7 The relationship between the temperature (A) GHSV and CH4 conversion % with CH4:CO2 fixed at 0.75, (B) CH4:CO2, and CH4 conversion % with GHSV (the space velocity) fixed at 24000. | |
 |
| | Fig. 8 The relationship between the temperature (A) GHSV, and CO2 conversion % with CH4:CO2 fixed at 0.78; (B) CH4:CO2, and CO2 conversion % with GHSV (the space velocity) fixed at 23800. | |
 |
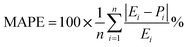
| | Fig. 9 The relationship between the temperature (A) GHSV and H2/CO % with CH4:CO2 fixed at 0.91; (B) H2/CO and GHSV% with GHSV (the space velocity) fixed at 27000. | |
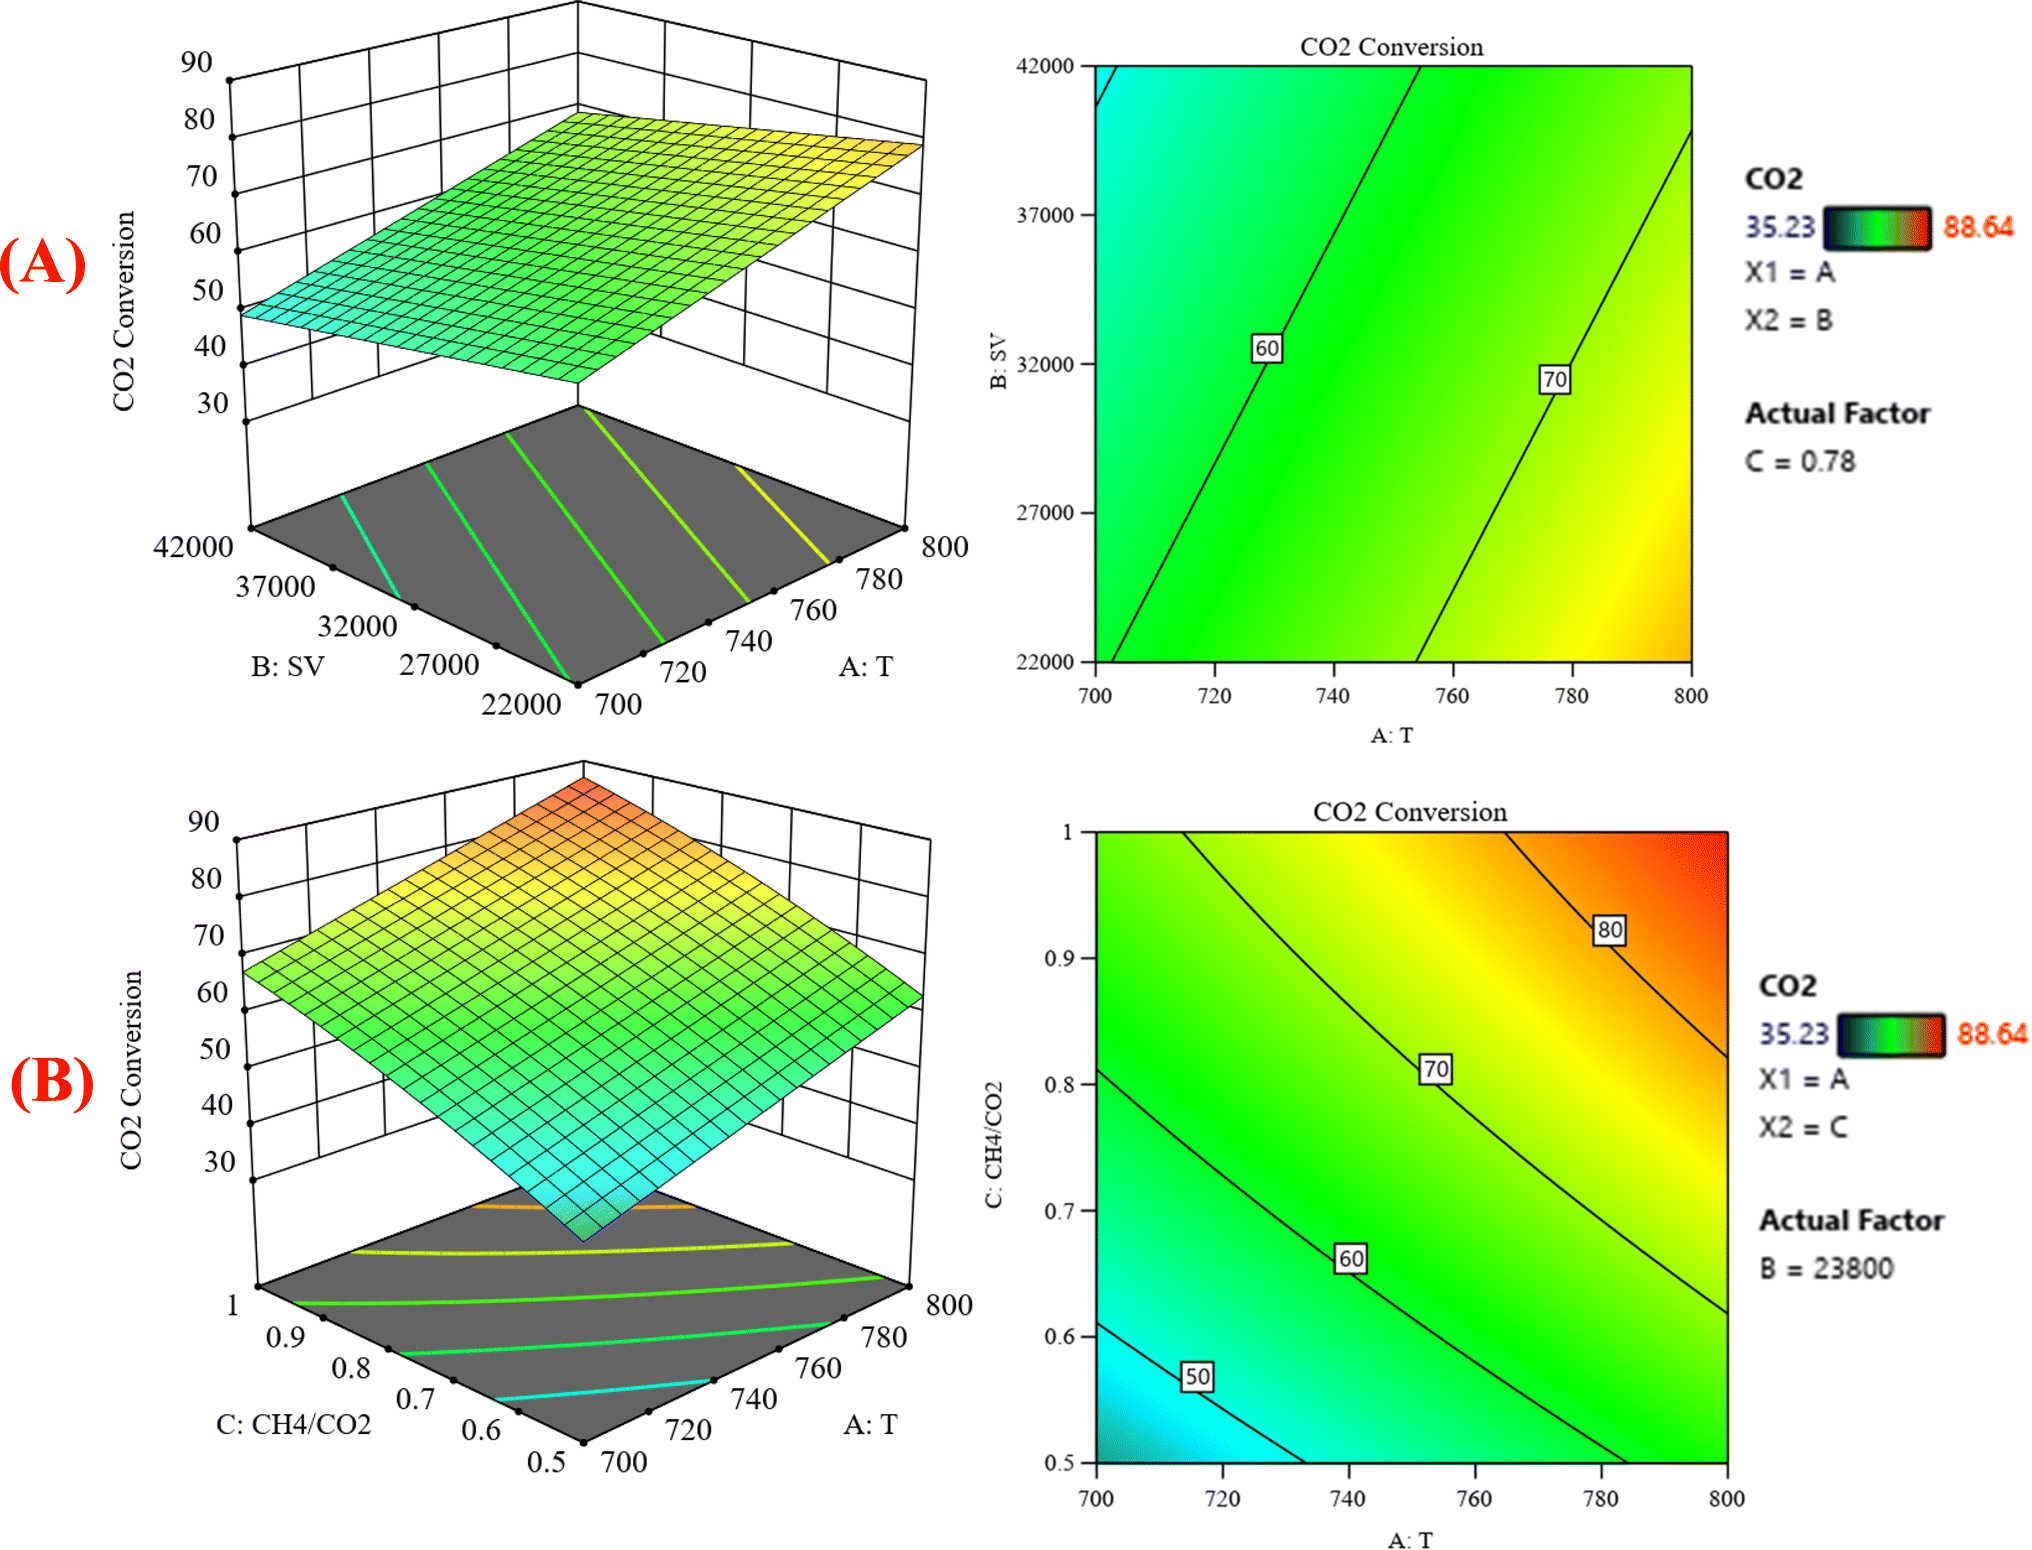
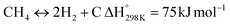
Fig. 8B represents that at constant GHSV at 23800, the CO2 conversion increased from 35.2% to 88.6% as temperature increased from 700 °C to 800 °C. Fig. 9A shows the surface plots that represent the suggested model that represents the relationship between the response variable syngas production (H2/CO) and the factor variables (temperature and gas hourly space velocity) with fixed CH4:CO2 at 0.91. It represents the significant effects of these factors on the variation of H2/CO. The three-dimensional response surface shows that with increasing the temperature and decreasing the gas hour space velocity, the H2/CO increases to reach its maximum value. H2/CO increase from 0.713–0.974 at 700–800 °C. The same range of variation of H2/CO is observed in Fig. 9B, which shows the relationship between the response variable H2/CO and the factor variables (temperature and CH4:CO2) with fixed gas hourly space velocity SV at 27000. This corresponds to an increase in CH4 conversion under these conditions because the creation of hydrogen-rich syngas might be attributed to methane dissociation: CH4 → C + H2 on the surface of the catalyst, leading to an increase in the selectivity of H2. This discovery is consistent with the literature, which has documented methane dissociations as rate-determining steps in dry reforming reactions.36 Similarly, an increase in temperature significantly increases H2 selectivity.
3.9.5 Process optimization.
The process optimization involved maximizing the response variables (CH4 conversion, CO2 conversion, and the H2/Co ratio) using Design-Expert version 13, which incorporates optimization goals to yield multiple solutions meeting the specified criteria. The optimal conditions were selected based on the solution with the highest desirability value.37 Each set of the process conditions, that is, temperature, GHSV, and CH4:CO2, was subjected to the models present in eqn (9)–(11) to obtain predicted goals in Table 8. Optimization aims to pinpoint a satisfactory set of conditions that will fulfill all objectives. After getting the combined optimum condition values of temperature (800 °C), GHSV (22000), and CH4:CO2 (1.00) from the optimization procedure, the same circumstances were tested experimentally in the reactor, and the results, as given in Table 7, closely resembled (5% difference) the predicted values.
Table 8 The optimal goals and optimum conditions
| Goals function |
Variables |
| Temp. |
SVa |
CH4/CO2 |
CH4 con. |
CO2 con. |
H2/CO |
|
SV = the space velocity is based only on CH4 and CO2, excluding N2.
|
| Max (CH4 conversion) |
Criteria |
In range |
In range |
In range |
Max. |
In range |
In range |
| Optimum conditions. |
787.3 |
22459.4 |
0.613 |
88.586 |
67.916 |
0.803 |
| Max (CO2 conversion) |
Criteria |
In range |
In range |
In range |
In range |
Max. |
In range |
| Optimum conditions. |
800.0 |
22000.3 |
0.995 |
82.193 |
87.667 |
0.974 |
| Max (H2/CO) |
Criteria |
In range |
In range |
In range |
In range |
In range |
Max. |
| Optimum conditions. |
799.9 |
22089.8 |
0.999 |
82.043 |
87.757 |
0.975 |
| Max (CH4-conversion) & max (CO2-conversion) & max (H2/CO) |
Criteria |
In range |
In range |
In range |
Max. |
Max. |
Max. |
| Optimum conditions. |
800.0 |
22000.0 |
1.000 |
82.087 |
87.854 |
0.975 |
| Experimental |
Optimum conditions |
800.0 |
22000.0 |
1.000 |
86.99 |
93.11 |
0.99 |
3.10 Economic aspects of the proposed catalytic process
To determine whether the proposed catalytic process for syngas production is feasible, we need to evaluate its economic aspects. Specifically, we must consider the cost of producing the NiRh/SiAl catalyst, which is dependent on the cost of Ni, Rh, and silica–alumina. Since Rh is an expensive metal, it could have a significant impact on the overall cost of the catalyst. The cost of producing the NiRh/SiAl catalyst depends on the complexity of the synthesis method used. As compared to conventional catalysts used for syngas production, such as steam reforming catalysts based on Ni, the presence of Rh in NiRh/SiAl may increase the production cost. The operational costs of the catalytic process would include the cost of CH4 as the primary reactant, the energy required to maintain the reaction temperature, and the frequency of catalyst replacement due to deactivation will impact operational costs. The long-term stability and reusability of NiRh/SiAl compared to other catalysts become crucial factors. Techniques for regenerating catalysts, such as steam or oxygen pulses, can impact operational costs. When compared to traditional methods like steam reforming, which is widely used for producing syngas from natural gas, the initial implementation cost may be lower due to less expensive catalysts. However, steam reforming has limitations as it requires high temperatures, leading to increased energy consumption. It is also less selective in product formation, which necessitates additional processing steps. The autothermal reforming (ATR) method, on the other hand, combines steam reforming with partial oxidation and thus has the potential to decrease energy costs. However, ATR catalysts may be vulnerable to deactivation and, as a result, require frequent replacement. Although the NiRh/SiAl catalyst has shown promise in efficiently producing syngas, a more detailed techno-economic analysis is required. This analysis should involve estimating the costs involved in catalyst production and operation, as well as comparing it with existing production methods. Additionally, it should consider market prices of syngas and potential credits for cleaner production processes. By assessing all economic aspects, one can determine if the proposed catalytic process offers a cost-effective and viable solution for syngas production.
4. Conclusions
A study explored using nickel (Ni) catalysts with different promoters (Ir, Pt, Pd, Ru, and Rh) on silica–alumina (SiAl) for dry reforming of methane (DRM), a method to convert methane into syngas (H2 and CO). The most effective catalyst was NiRh/SiAl, achieving the highest methane (65.2%) and carbon dioxide (CO2) (71.5%) conversion rates among those tested due to high surface area, homogeneity in pore size distribution, maximum degree of reduction, and higher side of NiO's reducibility which undergoes moderate interaction with the support. It also showed good stability, with only a 5% weight loss after the experiment. Other catalysts (NiIr/SiAl, NiPd/SiAl, NiPt/SiAl, and NiRu/SiAl) had lower conversion rates, ranging from 38.8% to 46.3% for methane and 43.7% to 57.5% for CO2. The inferior catalytic activity of the Ir-promoted catalyst is due to the deposition of graphitic-type carbon more pronouncedly over the active sites. NiRh/SiAl outperforms other catalysts and this catalyst is further selected for process optimization under central composite design. Catalytic activity, like CH4 conversion and CO2 conversion, is presented as a response which is correlated to experimental factors like temperature, feed ratio and catalyst concentration by the predictive model. Researchers found that a specific catalyst (Rh-promoted Ni/SiAl) achieved high conversion rates for methane and carbon dioxide into valuable products while also achieving a desirable ratio of hydrogen to carbon monoxide. This success highlights the effectiveness of a statistical method (central composite design) for optimizing these methane-reforming processes. This study suggests that these catalysts have promise for industrial applications due to their efficiency and ability to reduce greenhouse gas emissions. The central composite design statistical method was used to predict ideal conditions for a process that converts CH4 and CO2 into useful products. Experiments confirmed that this method was accurate. At a temperature of 800 °C and a flow rate of 22000 ml (h−1 gcat−1), a catalyst made of Ni and Rh on a SiAl base achieved excellent results: 93.1% of CO2 conversion, 87.0% of CH4 conversion, and a H2 to CO ratio of 0.99. This study shows that this method is a good way to improve the process and that NiRh/SiAl catalysts are promising for reducing greenhouse gas emissions.
Data availability
The datasets generated and/or analyzed during the current study are available from the corresponding author on reasonable request. Specific data include: (1) Raw data: the raw experimental data from the sustainable energy and fuel study, including initial measurements and observations, are stored in a secure institutional repository and can be accessed upon request to the corresponding author. (2) Processed data: processed data that support the findings of this study are available in the ESI† of this article. This includes detailed calculations, derived data points, and processed datasets. (3) Supporting Information: additional supporting information and detailed methodologies are included within the ESI† files attached to this article. Requests for data and materials should be addressed to Ahmed S. Al-Fatesh at E-mail: aalfaesh@ksu.edu.sa.
Conflicts of interest
There are no conflicts to declare.
Acknowledgements
The authors would like to extend their sincere appreciation to Researchers Supporting Project number (RSPD2024R774), King Saud University, Riyadh, Saudi Arabia.
References
- S. C. Doney, V. J. Fabry, R. A. Feely and J. A. Kleypas, Ocean Acidification: The Other CO2 Problem, Ann. Rev. Mar. Sci, 2009, 1, 169–192, DOI:10.1146/annurev.marine.010908.163834.
- J. Hu, P. Hongmanorom, J. Chen, W. Wei, P. Chirawatkul, V. V. Galvita and S. Kawi, Tandem Distributing Ni into CaO Framework for Isothermal Integration of CO2 Capture and Conversion, Chem. Eng. J., 2023, 452(P3), 139460, DOI:10.1016/j.cej.2022.139460.
- N. Abas, A. Kalair and N. Khan, Review of Fossil Fuels and Future Energy Technologies, Futures, 2015, 69, 31–49, DOI:10.1016/j.futures.2015.03.003.
- P. Tomkins and T. E. Müller, Evaluating the Carbon Inventory, Carbon Fluxes and Carbon Cycles for a Long-Term Sustainable World, Green Chem., 2019, 21(15), 3994–4013, 10.1039/c9gc00528e.
- C. Zhang, Y. Li, Z. Chu, Y. Fang, K. Han and Z. He, Analysis of Integrated CO2 Capture and Utilization via Calcium-Looping in-Situ Dry Reforming of Methane and Fischer-Tropsch for Synthetic Fuels Production, Sep. Purif. Technol., 2024, 329, 125109, DOI:10.1016/j.seppur.2023.125109.
- Y. Sha, Y. Ling, Y. Yang, X. Wang, D. Meng and S. Wang, A Finger-like Anode with Infiltrated Ni0.1Ce0.9O2-δ Catalyst Using New Phase Inversion Combined Tape-Casting Technology for Optimized Dry Reforming of Methane, Ceram. Int., 2023, 49(17), 29155–29163, DOI:10.1016/j.ceramint.2023.06.195.
- Y. Lei, J. Ye, J. García-Antón and H. Liu, Recent Advances in the Built-in Electric-Field-Assisted Photocatalytic Dry Reforming of Methane, Chin. J. Catal., 2023, 53, 72–101, DOI:10.1016/S1872-2067(23)64520-6.
- S. A. Al-Zahrani, A. S. Al-Fatesh, M. N. Kaydouh, A. Al Otaibi, F. Francesco, A. H. Fakeeha and N. El Hassan, High Carbon-Resistant Nickel Supported on Yttria–Zirconia Catalysts for Syngas Production by Dry Reforming of Methane: The Promoting Effect of Cesium, Alexandria Eng. J., 2023, 74, 371–386, DOI:10.1016/j.aej.2023.05.040.
- X. Yuan, B. Li, X. Wang and B. Li, Synthesis Gas Production by Dry Reforming of Methane over Neodymium-Modified Hydrotalcite-Derived Nickel Catalysts, Fuel Process. Technol., 2022, 227, 107104, DOI:10.1016/j.fuproc.2021.107104.
- D. Liang, Y. Wang, Y. Wang, M. Chen, X. Xie, C. Li, J. Wang and L. Yuan, Dry Reforming of Methane for Syngas Production over Noble Metals Modified M-Ni@S-1 Catalysts (M = Pt, Pd, Ru, Au), Int. J. Hydrogen Energy, 2023, 1–14, DOI:10.1016/j.ijhydene.2023.07.135.
- H. Er-rbib, C. Bouallou and F. Werkoff, Dry Reforming of Methane - Review of Feasibility Studies, Chem. Eng. Trans., 2012, 29, 163–168, DOI:10.3303/CET1229028.
- L. Zhu, L. Li and J. Fan, A Modified Process for Overcoming the Drawbacks of Conventional Steam Methane Reforming for Hydrogen Production: Thermodynamic Investigation, Chem. Eng. Res. Des., 2015, 104, 792–806, DOI:10.1016/j.cherd.2015.10.022.
- R. Kumar, A. Kumar and A. Pal, Overview of Hydrogen Production from Biogas Reforming: Technological Advancement, Int. J. Hydrogen Energy, 2022, 47(82), 34831–34855, DOI:10.1016/j.ijhydene.2022.08.059.
- A. I. Osman, A. Ayati, P. Krivoshapkin, B. Tanhaei, M. Farghali, P.-S. Yap and A. Abdelhaleem, Coordination-driven innovations in low-energy catalytic processes: advancing sustainability in chemical production, Coord. Chem. Rev., 2024, 514, 215900, DOI:10.1016/j.ccr.2024.215900.
- Y. Wang, L. Yao, S. Wang, D. Mao and C. Hu, Low-Temperature Catalytic CO2 Dry Reforming of Methane on Ni-Based Catalysts: A Review, Fuel Process. Technol., 2018, 199–206, DOI:10.1016/j.fuproc.2017.10.007.
- S. Arora and R. Prasad, An Overview on Dry Reforming of Methane: Strategies to Reduce Carbonaceous Deactivation of Catalysts, RSC Adv., 2016, 6(110), 108668–108688, 10.1039/c6ra20450c.
- A. I. Tsyganok, M. Inaba, T. Tsunoda, K. Suzuki, K. Takehira and T. Hayakawa, Combined Partial Oxidation and Dry Reforming of Methane to Synthesis Gas over Noble Metals Supported on Mg–Al Mixed Oxide, Appl. Catal., A, 2004, 275(1–2), 149–155, DOI:10.1016/J.APCATA.2004.07.030.
- A. Choya, B. de Rivas, M. L. No, J. I. Gutiérrez-Ortiz and R. López-Fonseca, Dry Reforming of Methane over Sub-Stoichiometric NiAl2O4-Mediated Ni/Al2O3 Catalysts, Fuel, 2024, 358, 130166, DOI:10.1016/j.fuel.2023.130166.
- P. K. Yadav and S. Sharma, Ni, Co & Cu Substituted CeO2: A Catalyst That Improves H2/CO Ratio in the Dry Reforming of Methane, Fuel, 2024, 358(PB), 130163, DOI:10.1016/j.fuel.2023.130163.
- A. Trovarelli and J. Llorca, Ceria Catalysts at Nanoscale: How Do Crystal Shapes Shape Catalysis?, ACS Catal., 2017, 7(7), 4716–4735, DOI:10.1021/acscatal.7b01246.
- X. Hong, B. Li, Y. Wang, J. Lu, G. Hu and M. Luo, Stable Ir/SiO 2 Catalyst for Selective Hydrogenation of Crotonaldehyde, Appl. Surf. Sci., 2013, 270, 388–394, DOI:10.1016/j.apsusc.2013.01.035.
- A. K. Mageed, B. V. Ayodele and S. I. Mustapa, Response Surface Optimization of Hydrogen-Rich Syngas Production by Greenhouse Gases Reforming, Chem. Eng. Technol., 2020, 43(4), 742–751, DOI:10.1002/ceat.201900475.
- Z. Bian, W. Zhong, Y. Yu, Z. Wang, B. Jiang and S. Kawis, Dry Reforming of Methane on Ni/Mesoporous-Al2O3 Catalysts, Effect of Calcination Temperature, Int. J. Hydrogen Energy, 2021, 46, 31041–31053, DOI:10.1016/j.ijhydene.2020.12.064.
- R. Fiorenza, L. Spitaleri, A. Gulino and S. Scirè, Ru–Pd Bimetallic Catalysts Supported on CeO2-MnOx Oxides as Efficient Systems for H2 Purification through CO Preferential Oxidation, Catalysts, 2018, 8(5), 1–18, DOI:10.3390/catal8050203.
- J. N. Park, J. Kuk Shon, M. Jin, S. Sung Kong, K. Moon, G. Ok Park, J. H. Boo and J. Man Kim, Room-Temperature CO Oxidation over a Highly Ordered Mesoporous RuO 2 Catalyst, React. Kinet., Mech. Catal., 2011, 103(1), 87–99, DOI:10.1007/s11144-011-0284-5.
- A. Osaka, T. Takatsuna and Y. Miura, Iridium Oxide Films via Sol-Gel Processing, J. Non-Cryst. Solids, 1994, 178(C), 313–319, DOI:10.1016/0022-3093(94)90300-X.
- M. Zimowska, J. B. Wagner, J. Dziedzic, J. Camra, B. Borzęcka-Prokop and M. Najbar, Some Aspects of Metal-Support Strong Interactions in Rh/Al 2O3 Catalyst under Oxidising and Reducing Conditions, Chem. Phys. Lett., 2006, 417(1–3), 137–142, DOI:10.1016/j.cplett.2005.09.112.
- A. Jorio and R. Saito, Raman Spectroscopy for Carbon Nanotube Applications, J. Appl. Phys., 2021, 129, 021102, DOI:10.1063/5.0030809.
- R. Baddour-Hadjean and J. P. Pereira-Ramos, Raman Microspectrometry Applied to the Study of Electrode Materials for Lithium Batteries, AIP Conf. Proc., 2010, 1267, 1137–1138, DOI:10.1063/1.3482342.
- R. Saito, A. Grüneis, G. G. Samsonidze, V. W. Brar, G. Dresselhaus, M. S. Dresselhaus, A. Jorio, L. G. Cançado, C. Fantini, M. A. Pimenta and A. G. Souza Filho, Double Resonance Raman Spectroscopy of Single-Wall Carbon Nanotubes, New J. Phys., 2003, 5, 157–157, DOI:10.1088/1367-2630/5/1/157.
- W. V. Harper and T. R. James, Concerns about Least Squares Estimation for the Three-Parameter Weibull Distribution: Case Study of Statistical Software, Jt. Stat. Meet. - Sect. Phys. Eng. Sci., 2015, 1268–1282 Search PubMed.
- L. Yang, P. Yin, H. Fan, Q. Xue, K. Li, X. Li, L. Sun and Y. Liu, Response Surface Methodology Optimization of Ultrasonic-Assisted Extraction of Acer Truncatum Leaves for Maximal Phenolic Yield and Antioxidant Activity, Molecules, 2017, 22(2), 232, DOI:10.3390/molecules22020232.
- M. A. Hossain, B. V. Ayodele, C. K. Cheng and M. R. Khan, Optimization of Renewable Hydrogen-Rich Syngas Production from Catalytic Reforming of Greenhouse Gases (CH4 and CO2) over Calcium Iron Oxide Supported Nickel Catalyst, J. Energy Inst., 2019, 92(1), 177–194, DOI:10.1016/j.joei.2017.10.010.
-
T. Brown, Section 1. Inq. into Relat. Cause Eff., 2013, pp. 323–338, DOI:10.1017/cbo9781139149747.017.
- M. H. Ahmadi Azqhandi, M. Ghaedi, F. Yousefi and M. Jamshidi, Application of Random Forest, Radial Basis Function Neural Networks and Central Composite Design for Modeling and/or Optimization of the Ultrasonic Assisted Adsorption of Brilliant Green on ZnS-NP-AC, J. Colloid Interface Sci., 2017, 505, 278–292, DOI:10.1016/j.jcis.2017.05.098.
- H. U. Hambali, A. A. Jalil, A. A. Abdulrasheed, T. J. Siang and D. V. N. Vo, Enhanced Dry Reforming of Methane over Mesostructured Fibrous Ni/MFI Zeolite: Influence of Preparation Methods, J. Energy Inst., 2020, 93(4), 1535–1543, DOI:10.1016/j.joei.2020.01.016.
- A. Abdulrasheed, A. A. Jalil, Y. Gambo, M. Ibrahim, H. U. Hambali and M. Y. Shahul Hamid, A Review on Catalyst Development for Dry Reforming of Methane to Syngas: Recent Advances, Renewable Sustainable Energy Rev., 2019, 108, 175–193, DOI:10.1016/J.RSER.2019.03.054.
- M. A. Alsaffar, B. V. Ayodele and S. I. Mustapa, Scavenging Carbon Deposition on Alumina Supported Cobalt Catalyst during Renewable Hydrogen-Rich Syngas Production by Methane Dry Reforming Using Artificial Intelligence Modeling Technique, J. Cleaner Prod., 2020, 247, 119168, DOI:10.1016/j.jclepro.2019.119168.
- S. M. Sidik, S. Triwahyono, A. A. Jalil, Z. A. Majid, N. Salamun, N. B. Talib and T. A. T. Abdullah, CO2 Reforming of CH4 over Ni-Co/MSN for Syngas Production: Role of Co as a Binder and Optimization Using RSM, Chem. Eng. J., 2016, 295, 1–10, DOI:10.1016/j.cej.2016.03.041.
Footnote |
| † Electronic supplementary information (ESI) available: paragraph S1: Selection of 1 wt% promoter loading S1; S2: Catalyst characterization; paragraph; Fig. S1: SEM of the fresh NiRh/SiAl catalyst; Fig. S2: Composition of the NiRh/SiAl catalyst as per EDX analysis; Table S1: Various % average conversion; Table S2: Compares the findings of this study with those previously published. See DOI: https://doi.org/10.1039/d4se00529e. |
|
| This journal is © The Royal Society of Chemistry 2024 |

 Open Access Article
 This Open Access Article is licensed under a
  *a,
Ahmed A.
Ibrahim
a,
Mohammed O.
Bayazed
a,
Ahmed E.
Abasaeed
a,
Maher M.
Alrashed
a,
Mohammed F.
Alotibi
*b,
Anis H.
Fakeeha
a and
Ahmed I.
Osman
*a,
Ahmed A.
Ibrahim
a,
Mohammed O.
Bayazed
a,
Ahmed E.
Abasaeed
a,
Maher M.
Alrashed
a,
Mohammed F.
Alotibi
*b,
Anis H.
Fakeeha
a and
Ahmed I.
Osman