 Open Access Article
Yield stress-enabled microencapsulation of field responsive microparticle suspensions†
Samuel R.
Wilson-Whitford
 *ab,
Maria Chiara
Roffin
 ac,
Jinghui
Gao
a,
Thitiporn
Kaewpetch
d and
James F.
Gilchrist
*a
aDepartment of Chemical and Biomolecular Engineering, Lehigh University, Bethlehem, PA, USA. E-mail: gilchrist@lehigh.edu
bSchool of Chemistry, University of Leicester, Leicester, UK. E-mail: srww1@leicester.ac.uk
cSchool of Science and Technology, Nottingham Trent University, Nottingham, UK
dDepartment of Packaging and Materials Technology, Faculty of Agro-industry, Kasetsart University, Bangkok, Thailand
First published on 12th October 2023
Abstract
Try and encapsulate microparticles inside the cores of microcapsules and you will often find that particles adhere to the liquid–liquid interface in a phenomenon known as Pickering stabilization. Particles will remain irreversibly trapped and embedded within the subsequently formed microcapsule membrane. In cases where the encapsulant particles must remain suspended inside the microcapsule core to retain their desired properties or behaviours, Pickering stabilization is detrimental. Here we demonstrate a general procedure using yield stress materials as the core material, where the yield stress of the gel is strong enough to suspend particles against sedimentation, but weak enough to allow spatial manipulation of encapsulant particles using an external field. This external field imparts enough force on particles to disrupt the supporting network and allow particle mobility after encapsulation.
Introduction
Microcapsules which contain organic, inorganic or biologically derived particles, either embedded at the interface or free in the core, are becoming more significant in encapsulation sciences. Traditionally they are formed from an emulsion by creating a solid boundary at the heterogeneous interface of the droplets. Their unique microsegregated structures allow for complex chemistries and functionalities to be included within a composite material without the need for complicated synthetic approaches and at higher efficiency. Microcapsules can be used for control of permeability,1 rigidity,2 for analytics,3 as microreactors,4 as delivery vessels5,6 and as responsive colloidal crystals7 to name a few.If we emulsify two immiscible phases in the presence of small particles (in either the dispersed or continuous phase), we can in many cases expect the resultant droplets to be stabilised by the particles as they adsorb to the interface in a phenomenon known as a Pickering stablisation.8–10 This is due to the substantial energetic advantage of particle adsorption to a fluid–fluid interface.11,12 The microparticles in this case arrive at the interface as a result of Brownian diffusion or sedimentation. This processes can, in some cases, be a desirable phenomenon and in fact has given rise to the study of armoured droplets known as “colloidosomes”.13,14 In other cases, it can be desirable to produce microcapsules which contain a suspension of particles throughout the core. It has been shown that when generating droplets from an organic phase laden with particles, the particles will almost instantaneously saturate the interface.15 For this reason it is important to develop synthetic approaches that control the behaviour of encapsulated suspensions of microparticles during the encapsulation process.
One approach to create microencapsulated suspensions is to avoid the presence microparticles during the membrane/shell formation and to nucleate particles in situ after encapsulation is complete. This has been shown through emulsion polymerization techniques,16–18 template-free methods and Ostwald ripening methods,19 but these approaches often produce materials where the chemistry of the core and shell are the same. Alternatively, low Reynolds number approaches such as microfluidics are employed.20,21 Microfluidics has the added advantage of being able to use external fields to influence microparticle diffusion and motion inside droplets.22–25 Other approaches have utilised layer-by-layer templating syntheses. Here microparticles can be coated within a sacrificial layer which is chemically etched after an outer shell has been formed to give “yolk–shell” or “microrattle” morphologies.7,26–28
The most practical approaches available in the literature are based on the arrest of particle Brownian diffusion or sedimentation through control of the dispersed phase's rheological properties by methods such as core gelation/solidification,29–34 or through solvent-particle density matching.35,36 Perhaps a forgotten technique in this category is reliquification, where microcapsules are formed with a solid gel core, usually an ionic crosslinked alginate gel, and the cores are subsequently reliquefied by addition of a chelating agent, such as EDTA.37–39 This has proven to be an effective technique for encapsulation of living tissues/particulates. This approach is easily applicable to aqueous core capsules, due to the large variety of available hydrogelators, but this technique has limited scope for oil-in-water (O/W) systems due to lack of suitable materials. With this in mind, a similar concept using oil-soluble yield stress materials, such as hydrogen bonded gels could be used as an analogous O/W method.
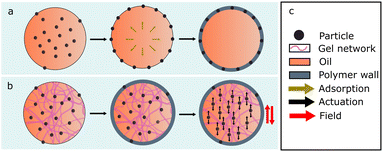
The synthetic route proposed herein is the use of an oil-based core material that possesses a yield stress strong enough to counteract the effects of gravity and Brownian motion but weak enough to yield in the presence of an external field or force (Fig. 1). Reliquification is achieved by utilizing shear rather than chemically induced triggers. In a generalised approach, we show an O/W polyurea microcapsule batch synthesis using an ethyl cellulose-dioctyl phthalate (ECDOP) dispersed phase. Micron-scale magnetic (field responsive) particles are distributed between the core and the interface of the microcapsules, depending on the particle position upon droplet generation, leaving the particles which remain in the core of the microcapsules free to be spatially manipulated by an external field. We believe this is a convenient route to larger scale synthesis of microcapsule sensors, micromixers, microreactors and field-responsive display inks, and should be treated as a generalised synthetic procedure applicable to a wide range of particle sizes, chemistries, and shapes etc.
Experimental
Materials and equipment listed in the ESI.†Fluorescent 1 μm silica particles
A 15 vol% solution of 3-aminopropyltriethoxysiline in ethanol (18.85 mL) with rhodamine isothiocyanate (9.8 mg, 1.82 × 10⁻² mmol) was stirred overnight in foil covered Flask 1. In a second flask, Flask 2, ethanol (6.81 g, 8.64 mL), DI water (12.44 g, 12.44 mL) and ammonium hydroxide (3.43 g, 3.905 mL) were mixed. In Flask 3, a 10 vol% of tetraethyl orthosilicate (TEOS) in ethanol solution (50 mL) was prepared. Flask 2 and 3 were added to Flask 1 and stirred for 6 h. A second 10 vol% TEOS in ethanol solution was prepared (50 mL) and added to Flask 1 and stirred for a further 24 h. The reaction solution was cleaned by 6× centrifugation in ethanol followed by 3× in DI water. The use of fluorescent particles in this work is purely for visualisation and analysis.Preparation of Janus particles
Monolayer films of 1 μm diameter silica particles were prepared on a roll-to-roll scale by automated Langmuir–Blodgett.40 The dried films were coated with Fe by physical vapour deposition using an Eddy SC 20 E-Beam Evaporator. Silica monolayers were placed in the evaporation chamber with Fe pellets, then sealed and held at high vacuum (10−5 torr, 50 K). The cap thickness was monitored in situ with a calibrated crystal balance. The resulting Fe capped Janus particle films had 50 nm coatings on the exposed hemispheres. Films, on their substrates, were cut into small sections and sonicated in ethanol for 2 minutes to remove the Janus particles. The ethanol was subsequently evaporated to leave dried magnetic Janus particles.Preparation of core material
Ethyl cellulose-dicotyl phthalate solutions were prepared on the 7.50 g scale at 0, 1, 2, 3, 4, 5 and 6 wt% of ethyl cellulose in dioctyl phthalate. To do this, ethyl cellulose was added to dioctyl phthalate in a 20 mL glass vial along with a small magnetic follower. The vial was sealed and submerged in an oil bath at 140 °C for 1 h. At this point 0.025 g of Solsperse 3000 dispersant was added. Janus particles were added at 0.0066 g mL−1 in ethyl cellulose solution. The sample was cooled to room temperature. Before each use, samples were heated and stirred at 40 °C for 15 min, followed by gentle sonication for 30 min. If the sample was to be analysed by confocal microscopy, Nile red at 1–2 mg mL−1 was added after the sample was removed from the heat and allowed to dissolve under stirring.Preparation of microcapsules
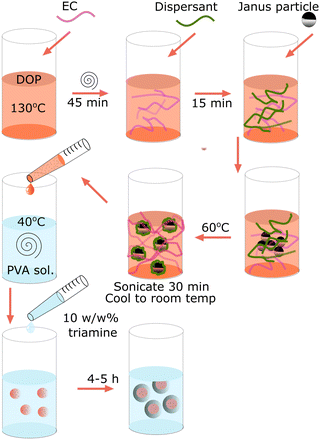
A 2 wt% solution of polyvinyl alcohol (Mowiol 8-88 Mw 67 kDa) was prepared. 100 mL of PVA solution was added to a 150 mL beaker, and was heated to 45 °C in a thermostatic waterbath. The PVA solution was stirred at 500 rpm with an overhead impeller stirrer. 7.50 g of core material was added to a separate vial followed by 825 μL of isophorone diisocyanate. The vial was sealed, and the mixture agitated until the components were homogenously mixed. The core suspension was added to the stirring PVA solution and allowed to shear for 30 s to form droplets. The stir rate was reduced to 150 rpm and 3000 μL of 10 w/w% diethylene triamine solution was added dropwise over 30 seconds. The reaction was allowed to proceed for 5 h to react any excess isocyanate.Magnetic agitation
Agitation was performed using a permanent magnet positioned in a fixed orientation at a set height above the sample (50 mm). The magnet has a magnetic flux density of 500 mT at the surface and an approximate maximum acting magnetic flux density of ∼20 mT. The magnet was moved in a circular motion with the height of the magnet always remaining constant.Results and discussion
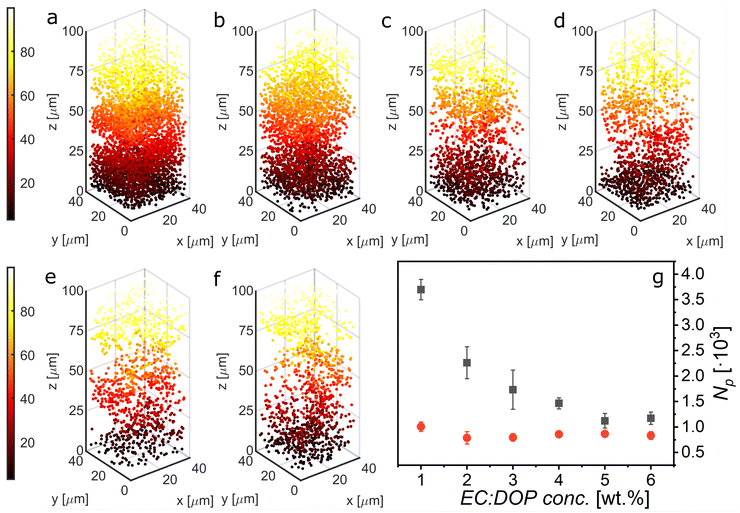
Gel capsules, like those mentioned previously, often use aqueous gels such as alginate or gelatine. This is because there are numerous gelator options and additionally, the ways in which small particles can be stabilized in aqueous systems is more diverse (e.g. Coulombic screening). For an oil-in-water system, ethyl cellulose (EC), which has near-zero water solubility, is an example of an effective colloidal-type gelator. By this we mean that the gelation occurs through the formation of a network of nanoscale diameter fibres, via a combination of hydrogen bonding on the molecular level and physical entanglement on the nano/microscale. Additionally, dioctyl phthalate (DOP) was chosen as the solvent component of the yield stress material due to the reported cooperative relationship between EC and diesters to form supramolecular gels.41,42In pursuit of the proposed mechanism shown in Fig. 1 it is important to identify a balance between particles sedimenting in the gel core and the ability to yield the network with an external force. Due to the relatively large density difference between the solvent and the particles (∼0.8–1 g cm−3) it is assumed that sedimentation due to gravity is more significant than the ability of particles to migrate to the interface through Brownian motion. To identify a transition point where particles no longer sediment, EC:DOP solutions were prepared at 0–6 wt% at 1% intervals and loaded with dispersed fluorescent particles (0.3 vol%). The experimental setup is described in S1. Samples were imaged on a confocal piezo stage over a set volume (μmx, μmy, μmz: 40, 40, 100), upward from the glass substrate (z = 0 μm → z = 100 μm). Scans were performed 15 min after sample preparation to allow for sample relaxation and again after 4 h, to mimic reaction conditions. Fig. 2 shows analysis of the sedimentation of particles in the gels at different gel concentrations. Fig. 2(a)–(f) show typical examples of the distribution of particles in the bottom 100 μm of samples, after 4 h. The particle number density reduces notably between 1–3 wt% gel and remains approximately the same between 4–6 wt% demonstrating retardation of sedimentation. Fig. 2(g) shows the average total particle count by fixed volume for each gel concentration after 15 min and after 4 h. After 15 min, the particle count is essentially equal between all gel concentrations with a slight bias to the lower concentration, but after 4 h, it is clear that a considerable amount of sedimentation has occurred in the lower concentration gels. The transition point could be indicated as lying approximately between 3–4 wt% EC.
Here, the key concern is the settling velocities of particles, and at which gel concentration would a majority of the encapsulated particles remain away from the interface during the critical first hour of the synthesis. This first hour accounts for a majority of polymer membrane formation. The ECDOP itself, from a simplistic perspective, could be considered as a viscous material in which the settling rate of particles depends on the viscosity as a function of the wt% of gel. It should be noted that for systems with much higher particle volume fractions, the percolation lengths could significantly influence gel structure and behaviour. Alternatively, in an elastic state, we could consider particle sedimentation as a probability that a particle is held by the gel network, with that probability being some function of the wt% gel, though perhaps more realistically the system should be considered a combination of these two regimes. For simplicity, we are considering the system as increasingly viscous with respect to increasing gel concentration. From the confocal data, the settling velocities, νest, of the particles in each gel are estimated and are found to closely follow the theoretical terminal velocity of a 1 μm particle in pure DOP (S2). It was found that νest = 13.8 and 9.6 μm h−1 for 3 and 4 wt% respectively. Considering the average capsule diameter as 100–150 μm, sedimentation is unlikely to result in transport of a significant number of particles to the polymerising interface during the timescale of a reaction for a 3 wt% ECDOP gel. This is in agreement with the conclusions from the settling data in Fig. 2. For an order of magnitude estimate on the yield stress when Janus particles are arrested from sedimentation, σy ≈ Δρgd ≈ 0.01 Pa, where Δρ is the density difference, g is gravitational acceleration, and d is Janus particle diameter.
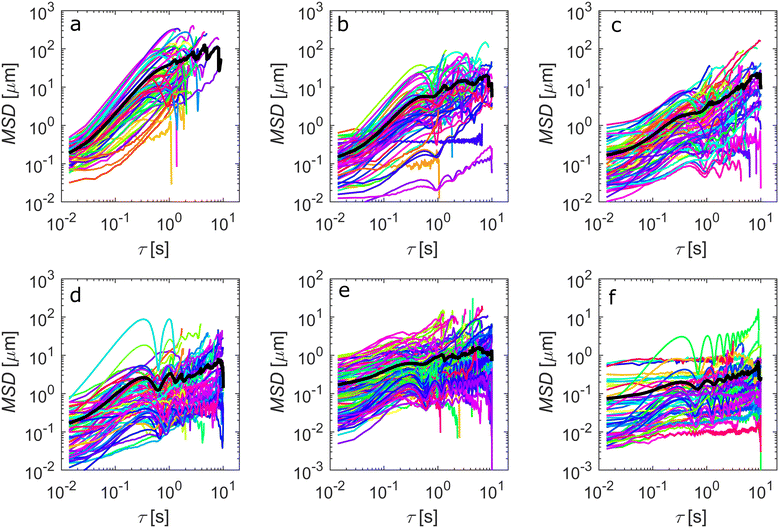
In a supporting experiment, samples of EC:DOP from 1–6 wt% were prepared with 0.0066 g mL−1 of fluorescent ferromagnetic Janus particles. The advantage of using Janus particles here is that it simplifies visualization of the spatial and angular perturbations of the particles. The sample preparation was identical to the settling experiment shown in Fig. 2, using cylindrical sample holders (S1). Samples were examined by CLSM whilst under magnetic agitation and the resulting videos were analysed to extract the mean square deviation (MSD) data from particle and particle cluster trajectories within the bulk yield stress gels. It should be noted that particle clusters are present primarily due to self-assembly of ferromagnetic Janus particles, a behaviour reported in the literature.43Fig. 3 shows the results of MSD calculations, with the black line showing the average MSD over all trajectories for each gel concentration. It should be noted here that MSD calculations from multiple particle tracking experiments are designed to work for particle systems with ideal Brownian trajectories. Here particles and particle clusters have rotational components to their motion which are not accounted for in microrheology.
Typically, the displacement with time (MSD vs. τ) will have a slope, α, of >1 for a super diffusive particle, equal to 1 for a Brownian particle and 0 for stationary particle. In our case, the traditional interpretation is not valid as the particles are not passive but are instead being externally manipulated. It is also important to note that the particle motion being measured is also partially rotational, especially for dimers/clusters. However, α remains indicative of the nature of the microenvironment that the particles are experiencing. Decreasing values of α here indicate an increase in the opposing force on the translational and rotational motion of the particles by the increased gel concentration. The values of α for each sample were, 1.32, 1.05, 0.75, 0.49, 0.33, 0.19 from 1–6 wt% EC respectively. For low wt% EC, the particle motion is relatively unrestricted, as seen in Supplementary Video V1 (ESI†). From >2 wt%, particle motion is significantly restricted, a trend that is exacerbated at ≥3 wt%, and essentially stationary at 6 wt% (Supplementary Video V2, ESI†). This is in agreement with the sedimentation data from Fig. 2. What is perhaps more endearing is the shape of the MSD curves. Pronounced oscillations appear as the gel concentration increases. From concentrations ≥4 wt%, stronger, regular oscillations are observed, indicating an increasing domination of elastic domains within the fluid. The onset of these pronounced oscillations is in agreement with the observations from the settling experiments, indicating that the yielding behaviour of the EC:DOP at approximately 3 wt% is an ideal concentration for the proposed system and particle selection.
Given these observations, microcapsules were synthesised adhering to the method outlined in the Experimental section and illustrated in Fig. 4. ECDOP containing responsive particles and isophorone diisocyanate (IDI) was emulsified in PVA solution and a diethylene triamine (DETA) crosslinker was subsequently added. The method utilized interfacial polymerisation of oil-soluble IDI and water-soluble DETA crosslinker to form a polyurea capsule wall. Isocyanate-amine chemistry was chosen due to the fast rates of reaction and subsequent fast initial membrane formation.44 Capsules were synthesized using the previously identified transition concentration of 3 wt% with the results shown in Fig. 5 and Supplementary Videos V3 and V4 (ESI†). Additionally, capsules were synthesised at 0 wt% and 6 wt% to demonstrate the trapping of microparticles at the interface and within an elastic core (S3 and S4).
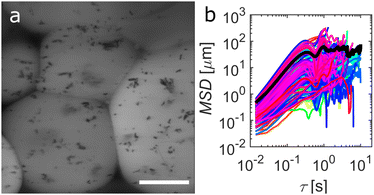
As seen from Fig. 5 and the supporting video, the microcapsules contain particles and particle clusters. The capsule size for the sample is measured at d[3,2] = 184.5 ± 105.3 μm and shows a broad size distribution due to the emulsification method (impeller stirrer) (S5). Upon agitation with an external magnetic field, the particles and particle clusters within the capsules are seen to move freely as they yield the gel network. Some particles are also immobile, specifically those embedded in the capsule walls. This is as a result of the emulsification process. As the particle laden gel is emulsified, some particles will inevitably be at the interface as the droplets are formed, due to the random spatial distribution of particles. Importantly, a majority of particles can be observed as mobile and in the cores of the capsules. A tracking analysis of the particles and particle clusters reveals the same smooth MSD curves which are indicative of a viscous environment. This shows that the particles are successfully yielding the gel network and moving freely after encapsulation.
Although the above synthetic method is intended to be used as a general synthetic approach, applicable to all manner of particle sizes, shapes and chemistries etc. in the following we demonstrate the utility of the method through incorporation in a visually tangible application, as an alternative to E-ink displays.36 In previous work by Gao et al.,45 it was shown that chains of ferromagnetic Janus particles can be rotated in a magnetic field giving rise to an optical dynamic range based on variable transmission of light. Others have shown similar, irreversible control of transmission through magnetic particles.46 These particles can be microencapsulated using our method to produce optically dynamic microcapsules.
This dynamic optical behaviour can be observed in Supplementary Video V4 (ESI†), where capsules containing Janus particles suspended in 3 wt% EC:DOP are shown to flash under the influence of a rotating magnetic field. V4 is a zoomed-out view of a number of capsules and so the intensity change observed is not correlated to any individual movement of particles but is an average of the collective motion. In V4 a significant majority of encapsulated particles can be seen in motion, as indicated by the macroscopic variable optical transmission. Measuring of the relative intensity difference of the capsules in a rotating magnetic field shows a transition between high and low optical transmission based on the orientation of the magnetic field, with the measured change being ∼9–10% (Fig. 6). The broad error here is due to the size dispersity of the capsules themselves, essentially giving different relative thicknesses to each capsule and thus changing the measured intensity. The advantage here with comparison to traditional E-inks, is the order of magnitude increase in refresh rate. Where E-inks rely on the translational motion of microparticles,36 here particles can simply be rotated, which occurs on a significantly faster timescale. A similar phenomenon involving the reflective properties of much larger Janus particles has also been previously demonstrate in optical devices,47–49 but never before through microencapsulation. Additionally, this technology would remove the need for expensive and brittle ITO screens and top-plates on various types of devices.
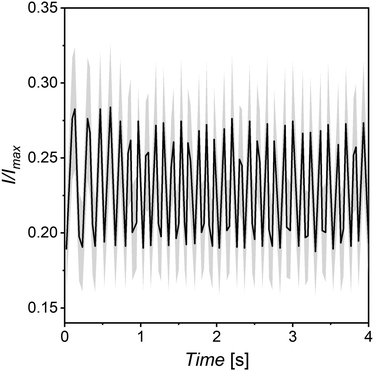 | ||
| Fig. 6 Relative intensity difference of capsules in a rotating magnetic field taken by greyscale image analysis of wet capsules on glass substrate similar to that of Gao et al.44 Black line indicates averaged data, grey shows error. | ||
Conclusions
In summary, a one-pot method of encapsulating micron-scale particles inside the core of capsules has been demonstrated by using a yield stress material as the core of the capsules. By controlling the yield point of the gel, the material can be balanced to suspend particles sufficiently to minimise sedimentation yet also be weak enough that an external force, in this case magnetism, can be used to yield the network and give spatially controllable encapsulated particles. For this example system, a combination of 1 μm silica Janus particles and an ECDOP gel is used. A 3 wt% ECDOP core is found to be the optimal gel concentration. The utility of this method is demonstrated by showing that this method can be used to produce materials for E-ink inspired screens and devices. The spatial orientation of chains of ferromagnetic microparticles encapsulated using our method can be manipulated to control transmission of light and therefore switching between light and dark.Author contributions
S. R. W.-W. – particle synthesis, experimentation, data analysis, coding, writing, research direction, conception. J. F. G. – Conception. M. C. R. – data analysis, coding. J. G. – particle synthesis. T. K. – particle synthesis.Conflicts of interest
There are no conflicts to declare.Acknowledgements
S. R. W.-W. and J. G. were funded by Johns Hopkins University, Applied Physics Laboratory. M. C. R. was funded by NSF grant 1931681. T. K. was funded by NSF grant 1936541.Notes and references
- R. W. Jaggers, R. Chen and S. A. F. Bon, Mater. Horiz., 2016, 3, 41–46 RSC.
- A. B. Subramaniam, M. Abkarian and H. A. Stone, Nat. Mater., 2005, 4, 553–556 CrossRef CAS PubMed.
- K. Yin, X. Zeng, W. Liu, Y. Xue, X. Li, W. Wang, Y. Song, Z. Zhu and C. Yang, Anal. Chem., 2019, 91, 6003–6011 CrossRef CAS PubMed.
- Z. Liu, B. Wang, S. Jin, Z. Wang, L. Wang and S. Liang, ACS Appl. Mater. Interfaces, 2018, 10, 41504–41511 CrossRef CAS PubMed.
- S. A. Hamad, D. Stoyanov and V. N. Paunov, Soft Matter, 2012, 8, 5069–5077 RSC.
- J. S. Sander and R. Studart, Soft Matter, 2014, 10, 60–68 RSC.
- K. Watanabe, H. Ishii, M. Konno, A. Imhof, A. Van Blaaderen and D. Nagao, Langmuir, 2017, 33, 296–302 CrossRef CAS PubMed.
- W. Ramsden and M. D. Oxon, Proc. R. Soc. London, 1904, 72, 156–164 Search PubMed.
- S. U. Pickering, J. Chem. Soc., Trans., 1907, 91, 2001–2021 RSC.
- N. Ballard, A. D. Law and S. A. F. Bon, Soft Matter, 2019, 15, 1186–1199 RSC.
- P. Pieranski, Phys. Rev. Lett., 1980, 45, 569–572 CrossRef CAS.
- R. Aveyard and J. H. Clint, J. Chem. Soc., Faraday Trans., 1996, 92, 85–89 RSC.
- O. D. Velev, K. Furusawa and K. Nagayama, Langmuir, 1996, 12, 2374–2384 CrossRef CAS.
- A. D. Dinsmore, M. F. Hsu, M. G. Nikolaides, M. Marquez, A. R. Bausch and D. A. Weitz, Science, 2002, 298, 1006–1009 CrossRef CAS PubMed.
- Z. Nie, I. P. Jai, W. Li, S. A. F. Bon and E. Kumacheva, J. Am. Chem. Soc., 2008, 130, 16508–16509 CrossRef CAS PubMed.
- T. Suzuki, A. Osumi and H. Minami, Chem. Commun., 2014, 50, 9921–9924 RSC.
- S. Zou, Y. Hu and C. Wang, Macromol. Rapid Commun., 2014, 35, 1414–1418 CrossRef CAS PubMed.
- Z. Wang, T. Qiu, L. Guo, J. Ye, L. He and X. Li, Chem. Eng. J., 2018, 332, 409–418 CrossRef CAS.
- H. Li, Z. Bian, J. Zhu, D. Zhang, G. Li, Y. Huo, H. Li and Y. Lu, J. Am. Chem. Soc., 2007, 129, 8406–8407 CrossRef CAS PubMed.
- L. Y. Chu, J. W. Kim, R. K. Shah and D. A. Weitz, Adv. Funct. Mater., 2007, 17, 3499–3504 CrossRef CAS.
- S. Utech, R. Prodanovic, A. S. Mao, R. Ostafe, D. J. Mooney and D. A. Weitz, Adv. Healthcare Mater., 2015, 4, 1628–1633 CrossRef CAS PubMed.
- M. Hein, M. Moskopp and R. Seemann, Lab Chip, 2015, 15, 2879–2886 RSC.
- A. Fornell, M. Ohlin, F. Garofalo, J. Nilsson and M. Tenje, Biomicrofluidics, 2017, 11, 031101 CrossRef PubMed.
- S. I. Han, H. Soo Kim and A. Han, Biosens. Bioelectron., 2017, 97, 41–45 CrossRef CAS PubMed.
- E. Brouzes, T. Kruse, R. Kimmerling and H. H. Strey, Lab Chip, 2015, 15, 908–919 RSC.
- D. Nagao, C. M. Van Kats, K. Hayasaka, M. Sugimoto, M. Konno, A. Imhof and A. Van Blaaderen, Langmuir, 2010, 26, 5208–5212 CrossRef CAS PubMed.
- A. Okada, D. Nagao, T. Ueno, H. Ishii and M. Konno, Langmuir, 2013, 29, 9004–9009 CrossRef CAS PubMed.
- K. Watanabe, D. Nagao, H. Ishii and M. Konno, Langmuir, 2015, 31, 5306–5310 CrossRef CAS PubMed.
- N. I. Castellanos, B. Bharti and O. D. Velev, J. Phys. Chem. B, 2021, 125, 7900–7910 CrossRef CAS PubMed.
- W. J. Seeto, Y. Tian, S. Pradhan, P. Kerscher and E. A. Lipke, Small, 2019, 15, 1902058 CrossRef CAS PubMed.
- J. Ge, H. Lee, L. He, J. Kim, Z. Lu, H. Kim, J. Goebl, S. Kwon and Y. Yin, J. Am. Chem. Soc., 2009, 131, 15687–15694 CrossRef CAS PubMed.
- Y. Song, Y. K. Chan, Q. Ma, Z. Liu and H. C. Shum, ACS Appl. Mater. Interfaces, 2015, 7, 13925–13933 CrossRef CAS PubMed.
- T. Hoshi, M. Suzuki, M. Ishikawa, M. Endo and T. Aoyagi, Int. J. Mol. Sci., 2019, 20, 4919 CrossRef CAS PubMed.
- V. L. Workman, S. B. Dunnett, P. Kille and D. D. Palmer, Biomicrofluidics, 2007, 1, 014105 CrossRef CAS PubMed.
- D. G. Yu, S. H. Kim and J. H. An, J. Ind. Eng. Chem., 2007, 13, 438–443 CAS.
- B. Comiskey, J. D. Albert, H. Yoshizawa and J. Jacobson, Nature, 1998, 394, 253–255 CrossRef CAS.
- F. Lim and R. D. Moss, J. Pharm. Sci., 1981, 70, 351–354 CrossRef CAS PubMed.
- F. Lim, US4409331A, 1983.
- F. Lim, US4352883A, 1982.
- X. Li and J. F. Gilchrist, Langmuir, 2016, 32, 1220–1226 CrossRef CAS PubMed.
- W. Koch, Ind. Eng. Chem., 1937, 29, 687–690 CrossRef CAS.
- E. Lizaso, M. E. Muñoz and A. Santamaría, Macromolecules, 1999, 32, 1883–1889 CrossRef CAS.
- B. Ren, A. Ruditskiy, J. H. Song and I. Kretzschmar, Langmuir, 2012, 28, 1149–1156 CrossRef CAS PubMed.
- M. Kubo, Y. Harada, T. Kawakatsu and T. Yonemoto, J. Chem. Eng. Jpn., 2001, 34, 1506–1515 CrossRef CAS.
- J. Gao, S. R. Wilson-Whitford, S. E. Han, S. M. Han and J. F. Gilchrist, ACS Appl. Opt. Mater., 2023, 1, 430–434 CrossRef CAS.
- J. E. Martin, K. M. Hill and C. P. Tigges, Phys. Rev. E: Stat. Phys., Plasmas, Fluids, Relat. Interdiscip. Top., 1999, 59, 5676–5692 CrossRef CAS PubMed.
- T. Nisisako, T. Torii, T. Takahashi and Y. Takizawa, Adv. Mater., 2006, 18, 1152–1156 CrossRef CAS.
- Y. Komazaki, H. Hirama and T. Torii, J. Appl. Phys., 2015, 117, 154506 CrossRef.
- S.-N. Yin, C.-F. Wang, Z.-Y. Yu, J. Wang, S.-S. Liu and S. Chen, Adv. Mater., 2011, 23, 2915–2919 CrossRef CAS PubMed.
Footnote |
| † Electronic supplementary information (ESI) available: Details of equipment and materials, descriptions and videos of particle agitations in bulk (V1–V2) and in capsules (V3 and V4), illustration of experimental set-up (S1), apparent settling velocities (S2), particles trapped at the membrane for 0 wt% (S3), example cluster tracking for 6 wt% sample (S4), capsule size distributions (S5), confocal images of the bottom of samples after 15 min (S6) and supplementary references. See DOI: https://doi.org/10.1039/d3sm00642e |
| This journal is © The Royal Society of Chemistry 2023 |

