 Open Access Article
 This Open Access Article is licensed under a
 Creative Commons Attribution 3.0 Unported Licence
Structural correlations of nitrogenase active sites using nuclear resonance vibrational spectroscopy and QM/MM calculations†
Casey
Van Stappen‡§
 a,
Bardi
Benediktsson‡¶
b,
Atanu
Rana‡
a,
Aleksandr
Chumakov
c,
Yoshitaka
Yoda
d,
Dimitrios
Bessas
c,
Laure
Decamps
*a,
Ragnar
Bjornsson
*abe and
Serena
DeBeer
*a
a,
Bardi
Benediktsson‡¶
b,
Atanu
Rana‡
a,
Aleksandr
Chumakov
c,
Yoshitaka
Yoda
d,
Dimitrios
Bessas
c,
Laure
Decamps
*a,
Ragnar
Bjornsson
*abe and
Serena
DeBeer
*a
aMax Planck Institute for Chemical Energy Conversion, Stiftstrasse 34-36, 45470 Mülheim an der Ruhr, Germany. E-mail: serena.debeer@cec.mpg.de; laure.decamps@cec.mpg.de
bScience Institute, University of Iceland, Dunhagi 3, 107 Reykjavik, Iceland
cESRF-The European Synchrotron, CS40220 38043, Grenoble CEDEX 9, France
dPrecision Spectroscopy Division, SPring-8/JASRI, Sayo 679-5198, Japan
eUniv Grenoble Alpes, CNRS, CEA, IRIG, Laboratoire de Chimie et Biologie des Métaux, 38054, Grenoble, France. E-mail: ragnar.bjornsson@cea.fr
First published on 31st January 2023
Abstract
The biological conversion of N2 to NH3 is accomplished by the nitrogenase family, which is collectively comprised of three closely related but unique metalloenzymes. In the present study, we have employed a combination of the synchrotron-based technique of 57Fe nuclear resonance vibrational spectroscopy together with DFT-based quantum mechanics/molecular mechanics (QM/MM) calculations to probe the electronic structure and dynamics of the catalytic components of each of the three unique M N2ase enzymes (M = Mo, V, Fe) in both the presence (holo-) and absence (apo-) of the catalytic FeMco clusters (FeMoco, FeVco and FeFeco). The results described herein provide vibrational mode assignments for important fingerprint regions of the FeMco clusters, and demonstrate the sensitivity of the calculated partial vibrational density of states (PVDOS) to the geometric and electronic structures of these clusters. Furthermore, we discuss the challenges that are faced when employing NRVS to investigate large, multi-component metalloenzymatic systems, and outline the scope and limitations of current state-of-the-art theory in reproducing complex spectra.
Introduction
Nitrogenase (N2ase) is a microbial enzyme responsible for converting inert atmospheric dinitrogen (N2) to bioavailable ammonia (NH3) under ambient conditions.1,2 The industrial analogue of this reaction is the Haber–Bosch (HB) process, which is energy-intensive and environmentally taxing due to the high pressures (>100 bar) and temperatures (∼500 °C) used during catalysis, and the significant quantities of CO2 produced as a by-product of industrial H2 production.3,4 The ambient, H2-free nature of N2ase-catalyzed nitrogen fixation has made these enzymes particularly alluring in the search for alternative routes to NH3 production, both for fertilizer production and as an H2 carrier. Furthermore, N2ases can catalytically reduce several triple bond-containing substrates, including HCN, C2H2, N3−, and even inert CO.5–7Three types of nitrogenases have been reported, each named for the homocitrate-binding metal contained in the catalytic cofactor, i.e., Mo, V, and Fe N2ase. Each of these three nitrogenases is a two-component system, comprised of a reducing Fe-protein, and the catalytic cofactor-containing MFe protein (M = Mo, V, Fe), again denoted by the contained homocitrate-binding metal (Fig. 1).8,9,12,13 Similarly, the catalytic clusters of MoFe, VFe, and FeFe are referred to as FeMoco ([Mo-7Fe-9S-C-homocitrate]), FeVco ([V-7Fe-8S-C-(CO3)-homocitrate]), and FeFeco (putative composition: [8Fe-9S-C-homocitrate]), respectively. Extensive kinetic, spectroscopic and crystallographic studies have been performed on Mo N2ase to explore the structure and reactivity of both the resting state and catalytic intermediates;7,14–20 however, significantly fewer studies have focused on V N2ase,21–25 and even less on Fe N2ase.13,14,26–28 Interestingly, all three N2ases exhibit significant differences in their catalytic reactivity towards N2 and alternative substrates,7,29 and the relationships between cofactor structure and activity are not yet well understood.
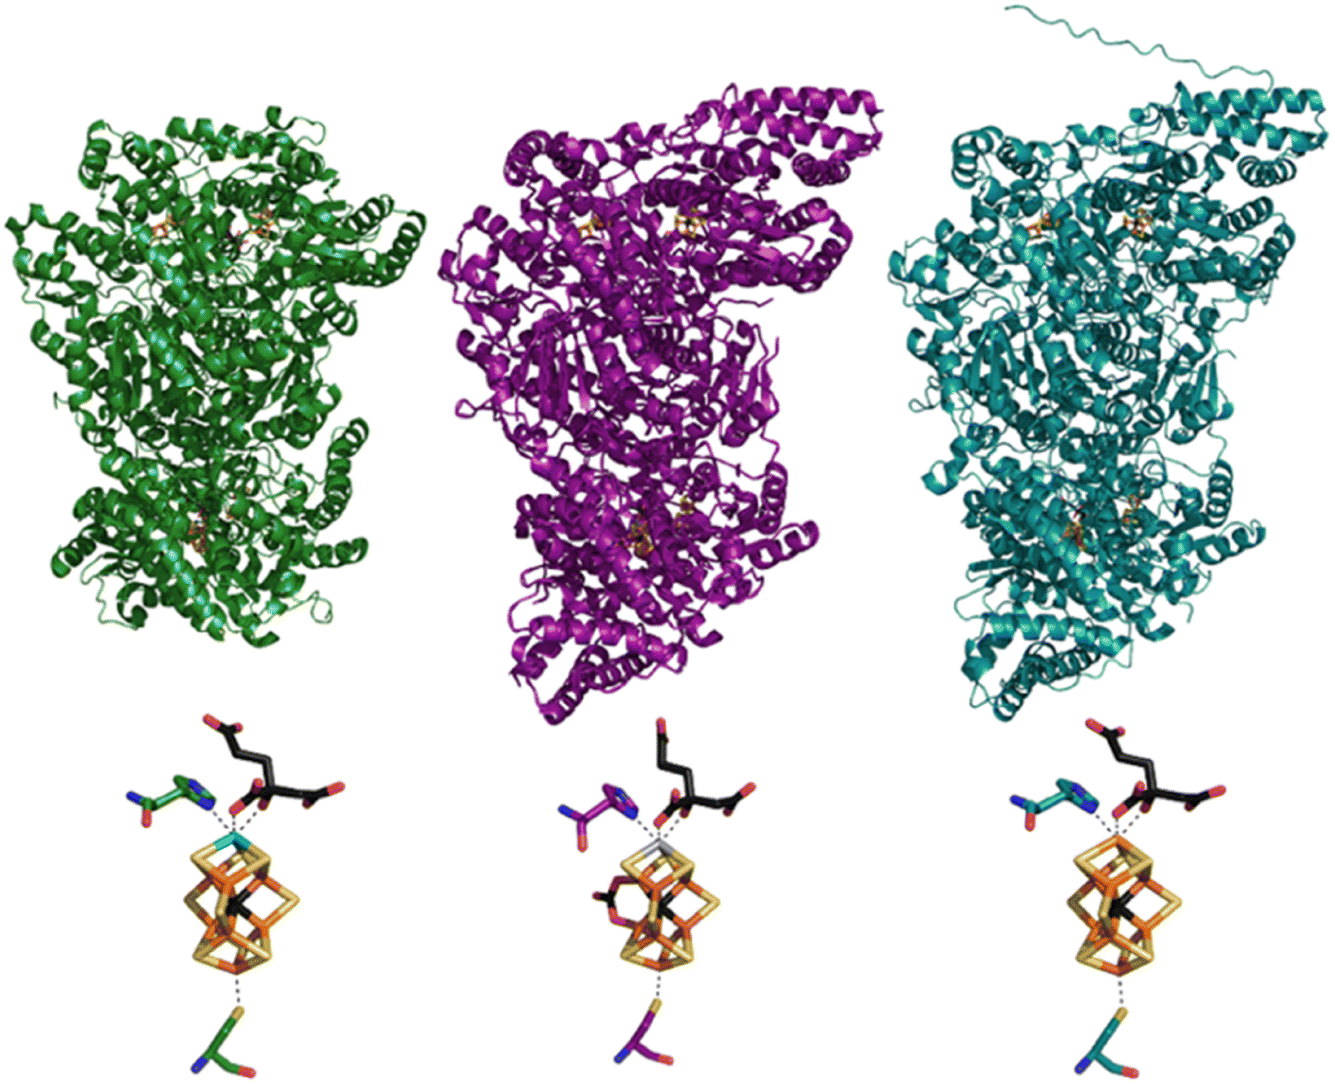 | ||
| Fig. 1 Structural models of the MoFe (green, PDB ID: 3U7Q8), VFe (purple, PDB ID: 5N6Y9), and FeFe (teal) proteins (top) and of their catalytic FeMco clusters, coordinated to homocitrate and the histidine and cysteine residues (bottom). The displayed FeFe model was generated using AlphaFold and the protein sequence of FeFe.10,11 | ||
Valence-to-Core X-ray Emission Spectroscopy (VtC XES) measurements have established that the cofactors of all three N2ases contain a central carbide atom,25,28,30 and high-resolution crystal structures of the MoFe and VFe proteins have further shown that the interstitial carbide atom exists in a unique hexacoordinated fashion between six Fe in a prismatic geometry.8,9 However, the role of the carbide atom during catalysis is still unclear. Recently, Hoffman and co-workers have extensively employed ENDOR spectroscopy across multiple redox states and intermediates of Mo N2ase to establish that the carbide atom serves to maintain the structural rigidity of the cofactor (acting as a “heart of steel”).31 Seven different protein samples were investigated, including both resting and reactive intermediate states, and the 13C isotopic hyperfine coupling constants were found to range from −1.3 to +2.7 MHz, indicating negligible changes to the carbide structure for Mo N2ase during turnover. Meanwhile, FeVco was long believed to be a direct analog of FeMoco, with V replacing Mo at the apical position of the cluster, however, crystal structures of the VFe protein have unexpectedly and consistently revealed that one of three belt sulfurs of FeVco is replaced by a carbonate ligand.9,22–24 We note however, that spectroscopic support for the presence of the carbonate bridge remains elusive.28 Meanwhile, the crystal structure of the FeFe protein has yet to be reported in the literature.
Despite significant progress in the active site structure characterization of N2ases, particularly through protein crystallography, extensive X-ray spectroscopy, and pulsed EPR methods, a comparative study of all three N2ases using an Fe-specific spectroscopic tool to examine the structural differences of the three unique catalytic cofactors has yet to be reported. All three unique catalytic cofactors of the N2ases share Fe as the primary metal component; therefore, Fe-specific techniques, such as 57Fe nuclear resonance vibrational spectroscopy (NRVS),32–35 can serve as common probes of the active sites of all three N2ases, allowing their molecular and electronic structures to be compared. Herein, we report the NRVS characterization of MoFe together with the “alternative nitrogenases” (V-, Fe-dependent N2ases). For each of the three nitrogenases, we present both the apo (FeMco-deficient, M = Mo, V, Fe) and holo proteins. In this way, we determine the primary spectral regions where the FeMco-clusters and P-clusters contribute to the partial vibrational density of states (PVDOS), and further correlate these results with electronic structure investigations at the QM/MM level. The sensitivity of the calculated PVDOS to the computational model parameters are discussed, and the implications of these findings for structural modelling based on NRVS data are highlighted.
Materials and methods
Protein sample preparation
The strep-tagged holo-MoFe, apo-MoFe, holo-VFe, apo-VFe, holo-FeFe and apo-FeFe proteins were produced in Azotobacter vinelandii strains DJ2102, DJ2115, DJ2253, DJ2256, DJ2241 and DJ2245 (generously provided by Prof. Dennis Dean), respectively, in 57Fe-enriched media following published procedures.36,37 Proteins were isolated from cell pellets as follows: cells were resuspended and lysed in Bug Buster Master Mix solution (Merck Millipore, 4![[thin space (1/6-em)]](https://www.rsc.org/images/entities/char_2009.gif) :1 v/w) following manufacturer’s instructions, then the lysate was centrifuged at 45000 rpm using a Ti 70 rotor. The soluble fraction was loaded on a 10 mL gravity-flow Strep-tactin column previously equilibrated in buffer [Tris 20 mM pH 7.4, NaCl 200 mM]. The column was then washed with the same buffer until the flow-through did not contain any protein, and the protein was eluted with 30 mL of that buffer supplemented with 3 mM desthiobiotin. The elution fraction was concentrated using a 100 kDa MWCO centrifugal filter unit until a concentration of 80 mg mL−1. 5 mM Na dithionite was added to each sample before loading in NRVS sample cells. For measurements at SPring-8 BL19LXU, the sample cells consisted of a 16.6 × 3.6 × 2.4 mm (l × w × h) block Delrin® with a 10 × 3 × 1.2 mm (l × w × h) well machined into the face. For measurements at ESRF ID18, sample cells consisted of a Cu block with a machined 12 × 2.5 × 1.5 mm trough, which was coated with a thin polystyrene film to prevent direct contact of the sample with metallic Cu. The open faces of the well/trough of either sample cell were sealed with 1-mil (25 μM) polyimide tape prior to sample loading, which was performed using a Hamilton® syringe and stainless-steel needle.
:1 v/w) following manufacturer’s instructions, then the lysate was centrifuged at 45000 rpm using a Ti 70 rotor. The soluble fraction was loaded on a 10 mL gravity-flow Strep-tactin column previously equilibrated in buffer [Tris 20 mM pH 7.4, NaCl 200 mM]. The column was then washed with the same buffer until the flow-through did not contain any protein, and the protein was eluted with 30 mL of that buffer supplemented with 3 mM desthiobiotin. The elution fraction was concentrated using a 100 kDa MWCO centrifugal filter unit until a concentration of 80 mg mL−1. 5 mM Na dithionite was added to each sample before loading in NRVS sample cells. For measurements at SPring-8 BL19LXU, the sample cells consisted of a 16.6 × 3.6 × 2.4 mm (l × w × h) block Delrin® with a 10 × 3 × 1.2 mm (l × w × h) well machined into the face. For measurements at ESRF ID18, sample cells consisted of a Cu block with a machined 12 × 2.5 × 1.5 mm trough, which was coated with a thin polystyrene film to prevent direct contact of the sample with metallic Cu. The open faces of the well/trough of either sample cell were sealed with 1-mil (25 μM) polyimide tape prior to sample loading, which was performed using a Hamilton® syringe and stainless-steel needle.
NRVS data collection & analysis
57Fe NRVS spectra of holo-VFe, apo-VFe, holo-FeFe and apo-FeFe proteins were measured at SPring-8 BL19LXU, while measurements of holo-MoFe and apo-MoFe proteins were performed at ESRF ID18. Detailed descriptions of the experimental setups used at either beamline are provided in the ESI.† NRVS data analysis includes aligning, summing, and normalizing scans, deconvoluting the monochromator line shape function, subtracting the intensity from the elastic nuclear resonance, estimation of sample temperature by detailed balance fitting, removal of multi-phonon contributions, and conversion to the PVDOS. For spectra obtained at SPring-8 BL19LXU, these steps were performed using the padd and phox subroutines of the program PHOENIX v. 2.1.4.38,39 For spectra obtained at ESRF ID18, these steps were performed using the software package DOS40 updated with the graphical user interface nisGUI v. 1.2. Additionally, energy calibration was performed in MATLAB based on measurements of [Et4N]57FeCl4 based on the reported T2 bending mode at 138 cm−1 and asymmetric T2 stretching modes at 376 and 389 cm−1.41The derived FeMoco PVDOS was calculated using the normalized probability densities of the nuclear inelastic absorption spectra acquired for apo- and holo-MoFe. Specifically, the spectrum of apo-MoFe was scaled by 8/15ths (corresponding to 8 Fe of the P-cluster contributing to the 15 Fe contained in holo-MoFe) and numerically subtracted from the spectrum of holo-MoFe. The resulting difference spectrum was then processed using the phox subroutine of the program PHOENIX v. 2.1.4 to produce the PVDOS.38,39
QM/MM calculations of 57Fe PVDOS
Quantum mechanics/molecular mechanics (QM/MM) models of MoFe and VFe protein from previous studies were used.42,43 FeFeco QM/MM calculations were performed using the MoFe QM/MM model. All QM/MM calculations were performed with Chemshell44,45 with an interface to ORCA46,47 version 4.2.1 (QM program) and DL_POLY48 (MM program). MM calculations used the CHARMM36 (ref. 49) forcefield. All QM calculations employed the TPSSh density functional,50,51 with D3BJ dispersion correction52,53 and with the ZORA scalar relativistic approximation.54,55 The relativistically recontracted ZORA-def2 basis set family was used (ZORA-def2-TZVP on Mo, V, Fe, S and carbide and ZORA-def2-SVP on other atoms).56,57 The RIJCOSX approximation58,59 for Coulomb and HF exchange integrals was used with a decontracted auxiliary basis set.60 The QM/MM coupling was described using electrostatic embedding together with link atoms and a charge-shifting scheme.44 QM/MM geometry optimizations used the DL-FIND program.61 QM-regions of varying sizes were tested for FeMoco as well as different sized partial Hessians. In the case of [Fe4S4(SPh)4]2− and for QM-cluster calculations of FeMco, CPCM62 was used as a continuum solvation model, with ε = 4 for FeMco (simulating a protein environment) and ε = ∞ for [Fe4S4(SPh)4]2− (simulating a polar crystal). The ZORA-TPSSh electronic structure level of theory has previously been shown to well-reproduce the geometries (M–Fe distances and M–S bond lengths) of spin-coupled iron–sulfur dimers and the high-resolution X-ray crystal structure of FeMoco.63,64 Vibrational frequencies were calculated using a numerical one-point formula partial Hessian approach (of varying size) for QM/MM and numerical two-point formula QM-cluster calculations; a comparison of numerical one-point vs. two-point partial Hessian approaches for FeMoco is provided in Fig. S1.†57Fe normal mode composition factors were calculated and used to derive 57Fe PVDOS. Each calculated vibrational transition was broadened by a 12 cm−1 Gaussian (FWHM).Broken-symmetry states for the FeMco clusters, Mo N2ase P-cluster and [Fe4S4(SPh)4]2− were found using a high-spin ferromagnetic initial state. The geometry for each BS state was optimized and the Hessian calculated. For FeMoco and FeVco, 3 different determinants of the favorable BS7 class were found as previously described:42,43,65,66 BS7-235, BS7-346 and BS7-247 where the last 3 numbers refer to which Fe ions (X-ray structure numbering, Fig. S2†)67 are spin-down. A total charge of n = −1 was used when treating the total valency of FeMoco. As recent studies have suggested, extractions of VFe are comprised of a mixture of both EPR-active/catalytically inactive and EPR-silent/catalytically active components,21 FeVco cluster charges ([V-7Fe-8S-C-CO3]n) with n = −2 and −1 were calculated in spin states of MS = 3/2 and MS = 1, respectively, with a BS7-235 determinant, previously shown to be lowest in energy for FeVco.43 For FeFeco, no X-ray structure has been reported in the literature and the redox state is not well established. Models using a [8Fe-9S-C]n form with n = −2, −1, 0 with MS = 0, 1/2, and 1 spin states with a BS-0235 broken-symmetry determinant were calculated (where the 4 numbers refer to which Fe ions are spin-down, X-ray structure numbering as shown in Fig. S2†). For the P-cluster, an MS = 0 BS-1247 determinant was employed.
Results and discussion
NRVS of Mo N2ase
The 57Fe-enriched holo-MoFe protein from Azotobacter vinelandii contains two distinct metalloclusters, the P-cluster (8Fe-7S) and FeMoco ([Mo-7Fe-9S-C-homocitrate]). A ΔnifB strain of A. vinelandii was used to produce apo-MoFe, ergo containing the 57Fe-enriched [8Fe-7S] P-cluster while lacking FeMoco. The NRVS-derived 57Fe PVDOS of each apo-MoFe (corresponding to 8 unique Fe) and holo-MoFe (corresponding to 15 unique Fe) are presented in Fig. 2A. Additionally, the PVDOS of FeMoco, derived from the [holo-MoFe] − (8/15) × [apo-MoFe] difference spectrum is also shown.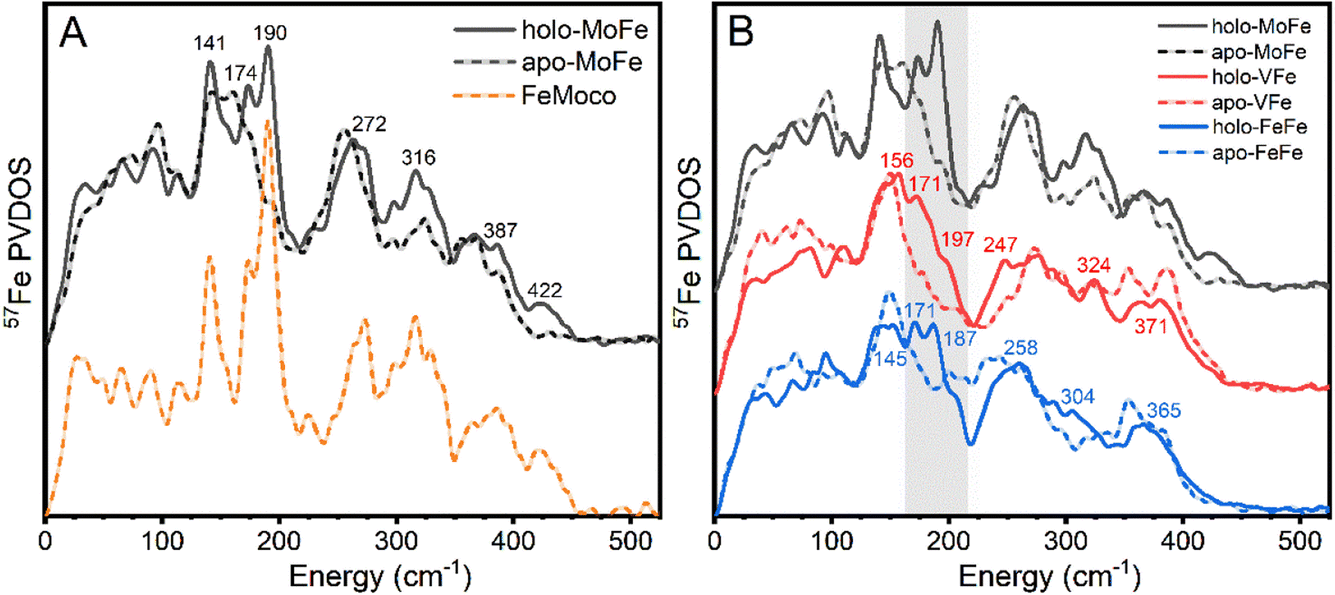 | ||
| Fig. 2 (A) Comparison of experimental 57Fe PVDOS of apo-MoFe (dashed, black) and holo-MoFe (solid, black). Additionally, the derived PVDOS of FeMoco is shown as an offset dashed orange line. (B) Comparison of the experimental 57Fe PVDOS of the three MFe proteins, in the holo- (solid lines) and the apo-forms (dashed lines). The shaded grey box indicates the primary distinct “FeMco” contribution region. Displayed numbers refer to outstanding features of the holo PVDOS, and carry the unit cm−1. | ||
The 57Fe PVDOS of holo-MoFe protein exhibits a set of intense characteristic vibrational bands around 141, 174, 190, 272, 316, 387, and 422 cm−1. These vibrational frequencies match well with the previously reported PVDOS of Mo N2ase – a comparison is provided in Fig. S3.†32,33 Similarly, the PVDOS of apo-MoFe (P-cluster only) also compares well with that previously reported, exhibiting relatively broad features ∼155, 255, 323, and 363 cm−1. The broadness of these features likely arises from the relatively low symmetry of the P-cluster, leading to distributions of concerted bending and stretching modes. By subtracting the apo-MoFe spectrum from the holo-MoFe spectrum, a FeMoco-only spectrum can be obtained (PVDOS shown as orange dashed line, Fig. 2A) which has several clear fingerprints and allows the differences between the apo and holo protein to be more clearly highlighted. Well-resolved features appear on top of the broad bands arising from apo-MoFe, specifically ∼140 and 270 cm−1, while features at 190 and 422 cm−1 appear as completely unique fingerprints to FeMoco. Additionally, a significant increase in intensity is observed for a series of features at ∼320 and 390 cm−1. Previous NRVS studies of [Fe4S4(SPh)4]2− support assignment of the feature at ∼140 cm−1 as a S–Fe–S bending vibration, while those at 267 and 290 cm−1 likely arise from a series of Fe–S stretching modes (Fig. S4†).68 Previously, the band appearing at ∼190 cm−1 was assigned as a symmetric Fe6C stretch referred to as a “breathing” mode of the FeMoco cluster.32 Meanwhile, the feature at 422 cm−1 has not been explicitly assigned.
NRVS of VFe and FeFe
To compare the vibrational features of the alternative N2ases with Mo N2ase, NRVS spectra of 57Fe-enriched samples of VFe and FeFe proteins in both holo- and the apo-forms (lacking FeVco and FeFeco, respectively) were obtained, which are shown as the derived 57Fe PVDOS in Fig. 2B. Significant vibrational bands appear around 156, 171, 197 (as a shoulder), 247, 324, and 371 cm−1 in holo-VFe. In apo-VFe, a primary feature ∼149 cm−1 is observed, along with several features spanning the Fe–S stretching regime, particularly at 272, 295, 319, 353, and 386 cm−1. Similar to apo-MoFe, apo-VFe lacks significant spectral contributions in the range of 170–240 cm−1; however, unlike apo-MoFe, spectral features in the ∼270 cm−1 regime of apo-VFe are significantly less intense, leading to a broad energetic distribution. Comparing holo- and apo-VFe, we see that the energetic ranges from 170–200 cm−1 and ∼250 cm−1 appear to be unique to the holo protein.In holo-FeFe, significant features appear around 143, 171, 187, 258, 304, and 365 cm−1, while the apo-FeFe PVDOS exhibits a distinct feature at 147 cm−1, along with very broad bands in the 200–340 range, and several distinct peaks at 354 and 383 cm−1. Like apo-MoFe and apo-VFe, the appearance of a significant band ∼150 cm−1 makes this a distinct feature common to the P-clusters of all three N2ases. However, unlike apo-MoFe and apo-VFe, significant intensity is still observed in the 200–250 cm−1 region of apo-FeFe, making the PVDOS of this protein particularly distinct from both apo-MoFe and apo-FeFe.
Comparing the PVDOS of MoFe, VFe, and FeFe together, several commonalities and differences become readily apparent. All three holo-proteins exhibit increased intensity in the 170–210 cm−1 region relative to their apo-forms, supporting that this region provides a strong, common fingerprint for all three FeM-cofactors. However, the bulk of intensity for this region is shifted to lower energy in holo-VFe relative to either holo-MoFe or FeFe. One notable difference between holo-MoFe and either VFe or FeFe is a distinct lack of the high-energy feature ∼422 cm−1 in the latter, implying a structural shift between MoFe and either VFe or FeFe.
Based on the reported high-resolution crystal structures of MoFe8 and VFe,9 we anticipated the P-clusters of apo-MoFe and apo-VFe (and by extension, apo-FeFe) to appear near-identical. However, we observe major discrepancies between the three apo-N2ase PVDOS. While these differences may arise from the unique protein environment-induced modulation of the P-cluster in each enzyme, we caution that the risk of sample heterogeneity due to the one-step affinity purification technique used for sample preparation cannot be ruled out. This technique is commonly employed and allows for fast sample preparation; however, it acts as a double-edged sword. Rapid purification significantly reduces the risk of protein denaturation and metallocluster damage, while simultaneously carrying the risk that a distribution of nitrogenase complexes in different maturation states may be present in the purified product. In MoFe isolated from wild-type A. vinelandii cells via one-step affinity purification, both the P-cluster and FeMoco are fully matured;69,70 however, it is not yet established if this is the case for VFe and FeFe purified when the same technique is applied, and specifically to how these compositions may vary between strains producing apo- vs. holo-VFe and FeFe. Moreover, the properties of the P-cluster in VFe and FeFe are not yet fully understood; notably, our EPR measurements of holo- and apo-VFe display a significant S = 1/2 signal, which may be tentatively attributed to either damaged P-cluster, a maturation intermediate, or even both (Fig. S5†).21,71 A similar signal has also been observed in the EPR spectrum of FeFe, as well as in the present study.26 A detailed investigation is currently underway in our lab to further understand these differences. Nevertheless, amid these cautions, we emphasize that there are general differences between all apo and holo proteins which allow us to clearly assign spectral regions that are dominated by FeMco cluster contributions.
Calculations of [Fe4S4(SPh)4]2−, P-cluster, and FeMco NRVS
Calculations of the 57Fe PVDOS require only the calculation of a mass-weighted Hessian matrix that can be obtained at the QM or QM/MM level of theory via the harmonic approximation. The harmonic vibrational energies come directly from the normal mode analysis as do the intensities (57Fe normal mode composition factors). A previous NRVS experiment on a [4Fe-4S] cubane cluster with (SPh) ligation ([Fe4S4(SPh)4]2−) was found to serve a useful purpose for calibration.68 More specifically, it shares some of the same basic structural features as the FeMco clusters, having weak-field tetrahedral Fe sites in FeII/FeIII oxidation states with a mixed-valence delocalized electronic structure and containing both inorganic μ3-sulfides and thiolates, while lacking a carbide and μ2-sulfides. The experimental PVDOS shown in Fig. 3 reveals NRVS intensity in most parts of the spectrum across the 0–400 cm−1 region, though notably lacking significant intensity at ∼190 cm−1. | ||
| Fig. 3 Calculated PVDOS of [Fe4S4(SPh)4]2− (red) vs. experimental PVDOS of [(n-Bu)4N]2[Fe4S4(SPh)4] (dark grey). Individual calculated modes and their intensities are represented as bars, while the solid line represents the 12 cm−1 FWHM broadened composite PVDOS. The experimental PVDOS of [(n-Bu)4N]2[Fe4S4(SPh)4] has been adapted from ref. 68 with permission from the Royal Society of Chemistry. | ||
As Fig. 3 also reveals, the calculated PVDOS of [Fe4S4(SPh)4]2− (modeled as a simple dianionic cluster surrounded by a polarizable continuum) can reproduce the main peaks in the experimental PVDOS well, demonstrating the applicability of the electronic structure approach (ZORA-TPSSh). No signs of systematic overestimation are indicated, and thus no empirical scaling factor has been introduced. According to the calculations, the 330–430 cm−1 region consists of Fe–S stretching modes, involving both μ3-sulfides and thiolates, some of them strongly coupled. The 200–300 cm−1 region consists of various types of bending modes with some Fe–S stretching character while the 90–150 cm−1 region primarily contains bending modes with much less Fe–S stretching character. The ESI† contains animations of vibrational modes with substantial iron contributions.
The apo-MoFe PVDOS should consist solely of the contribution of the P-cluster. The P-cluster, an [8Fe-7S] cluster, can be envisioned as a fusion of 2 [4Fe-4S] cubanes at a corner through an interstitial sulphide. While there are clear similarities between the [4Fe-4S] cubane PVDOS in Fig. 3 and the P-cluster PVDOS presented in Fig. 4A (intensity at ∼140, ∼270 and 380 cm−1), the P-cluster also gives rise to a broader spectral envelope, as would be expected from the more complex molecular structure, featuring both terminal and bridging thiolates, μ3-sulfides in distorted cubanes and an unusual μ6-sulfide. Visualization of the calculated vibrational modes reveal considerable complexity. Briefly, the 300–400 cm−1 region contains Fe–S stretching modes involving μ3-sulfides (346–426 cm−1) and thiolates (309–345 cm−1). Stretching modes involving the μ6-sulfide appear at 275–293 cm−1. Most of the individual stretching modes are localized to each sub-cubane of the P-cluster, however, some are delocalized over the whole cluster. The region of 120–270 cm−1 consists primarily of various bending modes (higher energy ones having some stretching thiolate character) that are delocalized over the whole cluster. Despite the additional complexity that arises in the P-cluster and the complex coupled nature of most of the modes (see ESI† for animations), the QM/MM calculation of MoFe protein with the P-cluster in the QM-region is reassuringly able to reproduce the main PVDOS features of the spectrum quite well.
 | ||
| Fig. 4 (A) Calculated P-cluster PVDOS from the MoFe QM/MM model, BS-1247, (red line) compared to the experimental apo-MoFe PVDOS (black). Calculations were performed using a 39 atom QM-region/Hessian. (B) Overlay of calculated FeMoco (red, solid) vs. derived experimental FeMoco (black, solid) PVDOS. Individual calculated modes and their intensities are represented as bars, while the solid line represents the 12 cm−1 FWHM broadened composite PVDOS. Calculations were performed considering 247 atoms in the QM-region/Hessian and a BS7-235 broken-symmetry solution. | ||
The FeMoco cluster of nitrogenase can also be approximately described as a fusion of two cubanes (e.g. [4Fe-4S] and [Mo-3Fe-4S]) but, importantly, contains an interstitial carbide that makes this cluster structurally distinct. The sensitivity of the calculated PVDOS of the FeMoco system was tested with respect to several calculation variables, including cluster-model vs. QM/MM, QM/MM with varying QM-region and partial Hessian sizes, and different broken-symmetry solutions. Overall, the use of QM/MM, rather than cluster model, is found to be critical (Fig. S6 of the ESI†) and while there is some sensitivity with respect to QM-region and size of partial Hessian, a small QM-region and Hessian region reproduces the main features of the largest calculation well (Fig. S7†). Furthermore, observed spectral improvements (compared to experiment) appear to arise more-so from a systematic improvement in geometry accuracy rather than the increased size of the partial Hessian.
Overall, the experimental PVDOS is well reproduced by QM/MM calculations (Fig. 4B), with the primary deviations being a lack of calculated intensity in the 360–370 cm−1 region (likely due to an overestimation of the calculated modes 380–440 cm−1 by 10–20 cm−1) and the appearance of an additional peak in the 200–210 cm−1 region. As mentioned earlier, the 170–210 cm−1 region appears particularly unique to FeMoco. Previous analysis of calculated PVDOS by Cramer and co-workers have described this region as arising from an Fe6X (X = C, N, O) “breathing” mode,32 where the relatively high energy (190 cm−1vs. 150 cm−1 as seen in other cubanes68) arises from the additional cluster rigidity conferred by the central atom. Our present analysis reveals an important reason why this region of the MoFe PVDOS is FeMoco-specific: the modes involve Fe–carbide stretching character. More precisely, the modes in this region involve a pair of Fe ions in each sub-cubane (Fe2–Fe6, Fe3–Fe7 and Fe4–Fe5) and can be described as a combination of anti-symmetric Fe–carbide stretching modes and bridging belt sulphide wagging, both being structural properties unique to the FeMoco cluster in MoFe. Calculated modes are available for visualization in the ESI.†
Closer inspection of the additional calculated peak in the 200–210 cm−1 region reveals that it maintains very similar character to those modes at 170–200 cm−1, with each having dominant Fe–carbide stretching character involving a pair of belt Fe ions. The reason for the higher-energy shift of the modes to 200–210 cm−1 arises from the additional involvement of the Fe4–Fe5 pair. In the specific broken-symmetry solution calculated, BS7-235, Fe4–Fe5 is best described as a pair of ferric Fe ions (with the other Fe ions being mixed-valence delocalized), as previously described.42 The difference in Fe oxidation state in the BS-state calculated thus offers an explanation for the appearance of the higher energy peak in the calculated PVDOS. There are two plausible explanations for why this occurs in our calculations: (i) our choice of density functional (TPSSh) overestimates the effective Fe oxidation state differences (i.e., the covalency is not captured well enough) and/or (ii) the broken-symmetry approach lacks the flexibility to fully describe the electronic structure.
Regarding density functional choice, we note that our electronic structure protocol has been previously shown to reproduce the high-resolution X-ray structure of FeMoco and related spin-coupled dimers very well,42,63 likely due to a balanced treatment of covalency in the Fe–S bonds. However, less is known about the quality of the electronic structure description regarding the Fe–carbide bonds, and any over/under estimation of Fe–C covalency may well lead to the observed deviations in the 170–200 cm−1 region.
Another plausible explanation arises from the implementation of spin-symmetry broken DFT. In particular, we find that a single determinant (BS7-235) leads to this additional calculated peak. There are 3 BS7 determinants (BS7-235, BS7-346 and BS7-247) that are effectively energetically equivalent at the TPSSh-level of theory (∼1 kcal mol−1 energy difference). These 3 determinants give rise to distinct geometric FeMoco structures which can be interpreted as 3 distinct electronic states, with BS7-235 providing the best agreement with the high-resolution X-ray structure. Alternatively, the true wavefunction of FeMoco could be conceived as a combination of these 3 determinants. As shown in Fig. S8,† calculating the PVDOS for each BS determinant leads to non-negligible changes (a direct result of the distinct geometries), including in the 190–210 cm−1 region. It is possible that the failure of our electronic structure protocol to fully describe this spectral region could be a result of the limitation of the BS-DFT approach, perhaps necessitating a weighted average of calculated PVDOS over all 3 determinants. These results thus serve as inspiration for improving the electronic structure description of FeMoco, which is currently limited to broken-symmetry DFT.
Finally, we turn to a comparison of the QM/MM calculated PVDOS for FeMoco, FeVco and FeFeco; as a crystallographic structure of FeFeco has not yet been reported, the protein environment of MoFe was employed in the case of the FeFe protein. For FeVco, both the [V-7Fe-8S-C-CO3]2− and [V-7Fe-8S-C-CO3]− redox states were calculated. Previous QM/MM calculations have shown that the [V-7Fe-8S-C-CO3]2− redox state (MS = 3/2) provides the best calculated structural agreement with the VFe protein X-ray structure43 (which may not be the resting state) while remaining consistent with the S = 3/2 EPR signal previously attributed to the VFe resting state. However, recent EPR studies have suggested that the resting state of active FeVco is actually EPR-silent, wherein the S = 1/2 EPR signal originates from the P-cluster or P-cluster maturation intermediates, while the two S = 3/2 signals are associated with inactive forms of FeVco.21 The redox state of FeFeco is also not confidently known, and a valency of [8Fe-9S-C]2− has been presently employed, as shown in Fig. 5; the calculated PVDOS for alternative redox state possibilities ([8Fe-9S-C]− and [8Fe-9S-C]0) are provided in the ESI (Fig. S9†).
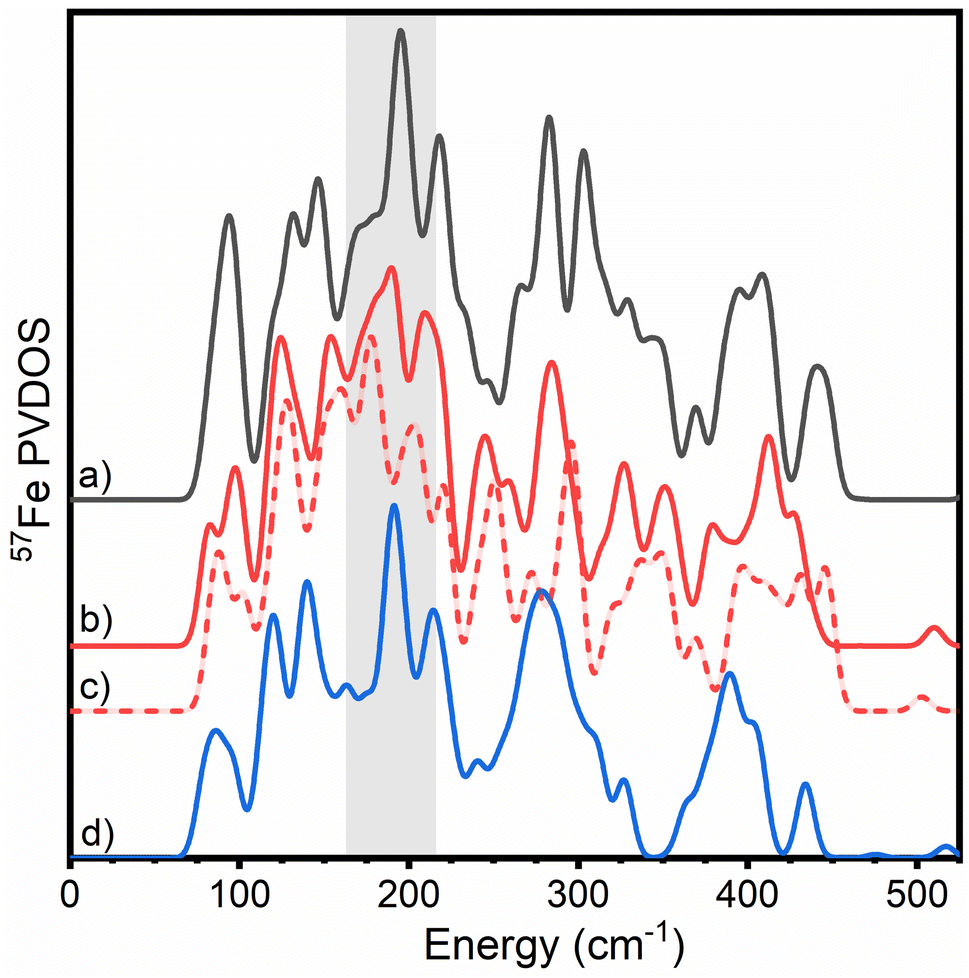 | ||
| Fig. 5 Overlay of calculated PVDOS of all three nitrogenase FeM-cofactors according to QM/MM calculations. (a) FeMoco ([Mo-7Fe-9S-C]−, MS = 3/2, BS7-235) (black), (b) FeVco ([V-7Fe-8S-C-CO3]2−, MS = 3/2, BS7-235) (red, solid), (c) ([V-7Fe-8S-C-CO3]−, MS = 1, BS7-235) (red, dashed) and (d) FeFeco ([8Fe-9S-C]2−, MS = 0, BS7-235) (blue). Calculations were carried out with 54 atoms in QM/Hessian region for FeMoco and FeFeco, and 57 atoms in QM/Hessian region for FeVco. Calculations of FeFeco employed a MoFe-based secondary coordination sphere. The region of interest described for the experimental N2ase PVDOS in Fig. 2 is highlighted in grey. | ||
Similar to our experimental observations, comparisons of QM/MM Hessian calculations of FeMoco, FeVco, and FeFeco reveal that structural differences of the cofactors translate into considerably different PVDOS. However, there is a closer correspondence between the PVDOS of FeMoco and FeFeco, with FeVco clearly being the most different of the three (regardless of redox state calculated). In particular, the region ranging from 170–210 cm−1 differs considerably for FeVco, likely due to the substitution of a belt sulphide for carbonate in FeVco, which would be expected to shift the energy of the modes in this region. There is also a sensitivity to which FeVco redox state is calculated; however, it remains unclear which spectrum is in better agreement with experiment. In the observed experimental PVDOS of VFe, the dominant intensity of this region is red-shifted to ∼170 cm−1 (as compared to ∼190 cm−1 in MoFe and FeFe). The observed variations within the 170–210 cm−1 region, combined with the (a) crystallographically demonstrated differences in belt atom identity and (b) high similarity of the PVDOS of FeFe and MoFe in this region supports the presence of three belt-sulphurs in the resting state of FeFeco.
The highest energy experimental feature at 422 cm−1 in the PVDOS of FeMoco presented in Fig. 4B is well reproduced by our QM/MM calculations (∼440 cm−1), and is plausibly assigned to an Fe–S stretching mode involving the belt sulphide of FeMoco, specifically the S2B sulphide bridging Fe2 and Fe6 (see ESI† for animated modes). The analogous modes of belt sulphides S5A and S3A are calculated to be lower in energy (350–400 cm−1). The origin of the high-energy of this specific Fe–S belt sulphide stretching mode is likely related to the environment around S2B in MoFe, with a directional hydrogen bond donated from His195. As shown in Fig. S6,† the CPCM-cluster model (lacking an explicit protein environment) does not produce this high-energy feature. The lack of this high-energy feature in the experimental VFe and FeFe PVDOS, however, is more likely related to different resting redox states of the cofactor, which can shift the energy of the feature as shown in Fig. 5. Among the FeVco redox states calculated, the [V-7Fe-8S-C-CO3]2− calculation is found to be more consistent with experiment (i.e., lacking a high-energy feature relative to FeMoco) than the [V-7Fe-8S-C-CO3]− calculation. As shown in Fig. S9,† the [8Fe-9S-C]2− redox state appears to be in better agreement with experiment than either [8Fe-9S-C]− or [8Fe-9S-C]0.
Recommendations and concluding remarks
Herein, we have presented a comparison of the NRVS data for all three forms of nitrogenase enzymes in both their holo and apo forms. The experimental data display distinct spectral features which can be correlated to contributions from the FeMco clusters in the 170–210 cm−1 region. The three holo protein PVDOS show subtle variations in this spectral region, with MoFe and FeFe being more similar to each other than VFe. In addition, holo MoFe shows a unique feature at 422 cm−1, which is absent in the other two holo proteins.Using DFT-based QM/MM calculations, we were able to obtain further insight into the origins of these spectral features. Our calculations have shown that both a simple 4Fe-4S model complex, as well as the P-cluster NRVS data can be well modelled using our BS-DFT based approach. Both the experimental data and calculations show the evolution of spectral complexity moving from a 4Fe-4S cubane to the P-cluster, and finally to the FeMco clusters. While the 4Fe-4S cluster and the P-clusters of MoFe protein are generally well reproduced by our calculations, modelling the FeMco clusters in terms of both valency and spin state shows greater variability. Specifically, for FeMoco, we have observed that the calculated PVDOS are very sensitive to the computational modelling protocol employed. It is clear that a QM/MM model, rather than a cluster model, is required to accurately capture primary spectral features. For instance, the clear band observed experimentally at ∼420 cm−1 is only reproduced computationally in the QM/MM model, demonstrating the importance of properly modelling the protein environment. We note that this feature is unique to FeMoco, and can be attributed to an Fe–S2B stretching mode. The identification of this feature is of great interest as the S2B position is thought to be potentially labile during catalysis.19,24,72–74 This assignment hence provides a spectroscopic signature for identifying its contributions, which may be of great utility in future studies of MoFe intermediates.
Our calculations have proven to be less sensitive to the size of the QM region, indicating that relatively small QM regions may represent a reasonable convergence of the Hessian. However, these calculations are also sensitive to the specific (almost isoenergetic) broken symmetry determinant used in the electronic structure calculations of FeMoco, particularly in the 170–210 cm−1 region. Presently, this dependence is not completely understood but may indicate that averaging over multiple broken symmetry determinants is necessary to fully capture the distinct experimental peak patterns of this region. The present findings thus further demonstrate the need to develop computational approaches that go beyond BS-DFT. Here, recent developments in wave function-based ab initio approaches to iron–sulphur clusters and to nitrogenase clusters are of great interest.75–77
The issues discussed here become even more complex for FeVco, where the ground state electronic structure remains a subject of debate.21 For FeFeco, the complexity is even further increased due to our present lack of understanding regarding the ground state electronic structure and the fact that a crystal structure is not currently available in the literature. In spite of these limitations, we are able to qualitatively capture the trends observed in our experimental data. We note, however, that these results highlight that caution must be exercised in using calculated PVDOS to quantitatively evaluate changes in the experimental PVDOS. In particular, using the discrete frequency of an observed feature to assign a given geometric/electronic structure state may be treacherous.
Finally, in closing, we note that these findings also have broad implications for the use of DFT cluster models to simulate the NRVS for many other metalloprotein systems. Specifically, the observations herein indicate that the failure to properly model the H-bonding from the protein environment may result not only in spectral shifts, but potentially even in the absence of certain spectral features. This provides an important cautionary note for the application of overly simplistic cluster models to calculate metalloprotein PVDOS – particularly in cases where open geometric and electronic structure questions may complicate the modelling.
Author contributions
CVS, RB and SD planned and designed the study. Expression and purification of nitrogenases was performed by LD, and sample preparation was performed by CVS and LD. Beamtime data collection was carried out by CVS, YY, DB and AC. Data analysis was carried out by CVS, AR, and SD. Computational studies were performed by BB under the guidance of RB. The manuscript was written by CVS, BB, AR, LD, RB, SD, and edited by all authors.Conflicts of interest
There are no conflicts to declare.Acknowledgements
We gratefully thank Prof. Dennis Dean and Valerie Cash (Virginia Polytechnic Institute and State University, USA) for providing the A. vinelandii strains used for this work. The authors acknowledge the Max Planck Society for funding. Additionally, SD and CVS acknowledge the DFG SPP 1927 “Iron–Sulfur for Life” (Project DE 1877/1-2 (SD)) for funding. Synchrotron radiation experiments at SPring-8 BL19LXU were performed with the approval of the Japan Synchrotron Radiation Research Institute (JASRI) (Proposal. Nos. 2019A1700, 2020A1413). Experiments were performed in part at beamline ID18 of the European Synchrotron Radiation Facility (ESRF), Grenoble, France. BB acknowledges support from the Teacher Assistant Grant of the University of Iceland. Open Access funding provided by the Max Planck Society. A. R. thanks the Alexander von Humboldt Foundation for a postdoctoral fellowship.Notes and references
- X. Zhang, B. B. Ward and D. M. Sigman, Chem. Rev., 2020, 120, 5308–5351 CrossRef CAS PubMed.
- D. Fowler, M. Coyle, U. Skiba, M. A. Sutton, J. N. Cape, S. Reis, L. J. Sheppard, A. Jenkins, B. Grizzetti, J. N. Galloway, P. Vitousek, A. Leach, A. F. Bouwman, K. Butterbach-Bahl, F. Dentener, D. Stevenson, M. Amann and M. Voss, Philos. Trans. R. Soc., B, 2013, 368, 20130164 CrossRef PubMed.
- F. Haber, Naturwissenschaften, 1922, 10, 1041–1049 CrossRef CAS.
- G. J. Leigh, in Catalysts for Nitrogen Fixation: Nitrogenases, Relevant Chemical Models and Commercial Processes, ed. B. E. Smith, R. L. Richards and W. E. Newton, Springer Netherlands, Dordrecht, 2004, pp. 33–54 Search PubMed.
- S. T. Stripp, B. R. Duffus, V. Fourmond, C. Léger, S. Leimkühler, S. Hirota, Y. Hu, A. Jasniewski, H. Ogata and M. W. Ribbe, Chem. Rev., 2022, 122, 11900–11973 CrossRef CAS PubMed.
- B. K. Burgess and D. J. Lowe, Chem. Rev., 1996, 96, 2983–3012 CrossRef CAS PubMed.
- L. C. Seefeldt, Z.-Y. Yang, D. A. Lukoyanov, D. F. Harris, D. R. Dean, S. Raugei and B. M. Hoffman, Chem. Rev., 2020, 120, 5082–5106 CrossRef CAS PubMed.
- T. Spatzal, M. Aksoyoglu, L. Zhang, S. L. A. Andrade, E. Schleicher, S. Weber, D. C. Rees and O. Einsle, Science, 2011, 334, 940 CrossRef CAS PubMed.
- D. Sippel and O. Einsle, Nat. Chem. Biol., 2017, 13, 956–960 CrossRef CAS PubMed.
- M. Varadi, S. Anyango, M. Deshpande, S. Nair, C. Natassia, G. Yordanova, D. Yuan, O. Stroe, G. Wood, A. Laydon, A. Žídek, T. Green, K. Tunyasuvunakool, S. Petersen, J. Jumper, E. Clancy, R. Green, A. Vora, M. Lutfi, M. Figurnov, A. Cowie, N. Hobbs, P. Kohli, G. Kleywegt, E. Birney, D. Hassabis and S. Velankar, Nucleic Acids Res., 2022, 50, D439–D444 CrossRef CAS PubMed.
- J. C. Setubal, P. dos Santos, B. S. Goldman, H. Ertesvag, G. Espin, L. M. Rubio, S. Valla, N. F. Almeida, D. Balasubramanian, L. Cromes, L. Curatti, Z. Du, E. Godsy, B. Goodner, K. Hellner-Burris, J. A. Hernandez, K. Houmiel, J. Imperial, C. Kennedy, T. J. Larson, P. Latreille, L. S. Ligon, J. Lu, M. Maerk, N. M. Miller, S. Norton, I. P. O’Carroll, I. Paulsen, E. C. Raulfs, R. Roemer, J. Rosser, D. Segura, S. Slater, S. L. Stricklin, D. J. Studholme, J. Sun, C. J. Viana, E. Wallin, B. Wang, C. Wheeler, H. Zhu, D. R. Dean, R. Dixon and D. Wood, J. Bacteriol., 2009, 191, 4534–4545 CrossRef CAS PubMed.
- H. L. Rutledge and F. A. Tezcan, Chem. Rev., 2020, 120, 5158–5193 CrossRef CAS PubMed.
- E. Krahn, B. Weiss, M. Kröckel, J. Groppe, G. Henkel, S. Cramer, A. Trautwein, K. Schneider and A. Müller, JBIC, J. Biol. Inorg. Chem., 2002, 7, 37–45 CrossRef CAS PubMed.
- C. Van Stappen, L. Decamps, G. E. Cutsail, III, R. Bjornsson, J. T. Henthorn, J. A. Birrell and S. DeBeer, Chem. Rev., 2020, 120, 5005–5081 CrossRef CAS PubMed.
- C. Van Stappen, R. Davydov, Z.-Y. Yang, R. Fan, Y. Guo, E. Bill, L. C. Seefeldt, B. M. Hoffman and S. DeBeer, Inorg. Chem., 2019, 58, 12365–12376 CrossRef CAS PubMed.
- J. T. Henthorn, R. J. Arias, S. Koroidov, T. Kroll, D. Sokaras, U. Bergmann, D. C. Rees and S. DeBeer, J. Am. Chem. Soc., 2019, 141, 13676–13688 CrossRef CAS PubMed.
- D. Lukoyanov, B. M. Barney, D. R. Dean, L. C. Seefeldt and B. M. Hoffman, Proc. Natl. Acad. Sci. U. S. A., 2007, 104, 1451–1455 CrossRef CAS PubMed.
- S. Raugei, L. C. Seefeldt and B. M. Hoffman, Proc. Natl. Acad. Sci. U. S. A., 2018, 115, E10521–E10530 CrossRef CAS PubMed.
- C. Van Stappen, A. T. Thorhallsson, L. Decamps, R. Bjornsson and S. DeBeer, Chem. Sci., 2019, 10, 9807–9821 RSC.
- B. M. Hoffman, D. Lukoyanov, Z.-Y. Yang, D. R. Dean and L. C. Seefeldt, Chem. Rev., 2014, 114, 4041–4062 CrossRef CAS PubMed.
- Z.-Y. Yang, E. Jimenez-Vicente, H. Kallas, D. A. Lukoyanov, H. Yang, J. S. Martin del Campo, D. R. Dean, B. M. Hoffman and L. C. Seefeldt, Chem. Sci., 2021, 12, 6913–6922 RSC.
- M. Rohde, K. Grunau and O. Einsle, Angew. Chem., Int. Ed., 2020, 59, 23626–23630 CrossRef CAS PubMed.
- D. Sippel, M. Rohde, J. Netzer, C. Trncik, J. Gies, K. Grunau, I. Djurdjevic, L. Decamps, S. L. A. Andrade and O. Einsle, Science, 2018, 359, 1484–1489 CrossRef CAS PubMed.
- M. Rohde, K. Laun, I. Zebger, S. T. Stripp and O. Einsle, Sci. Adv., 2021, 7, eabg4474 CrossRef CAS PubMed.
- J. A. Rees, R. Bjornsson, J. Schlesier, D. Sippel, O. Einsle and S. DeBeer, Angew. Chem., Int. Ed., 2015, 54, 13249–13252 CrossRef CAS PubMed.
- K. Schneider, U. Gollan, S. Selsemeier-Voigt, W. Plass and A. Muffler, Naturwissenschaften, 1994, 81, 405–408 CrossRef CAS PubMed.
- D. A. Lukoyanov, D. F. Harris, Z. Y. Yang, A. Perez-Gonzalez, D. R. Dean, L. C. Seefeldt and B. M. Hoffman, Inorg. Chem., 2022, 61, 5459–5464 CrossRef CAS PubMed.
- L. Decamps, D. B. Rice and S. DeBeer, Angew. Chem., Int. Ed., 2022, 61, e202209190 CrossRef CAS PubMed.
- S. G. MacArdle and D. C. Rees, J. Am. Chem. Soc., 2022, 144, 21125–21135 CrossRef CAS PubMed.
- K. M. Lancaster, M. Roemelt, P. Ettenhuber, Y. Hu, M. W. Ribbe, F. Neese, U. Bergmann and S. DeBeer, Science, 2011, 334, 974–977 CrossRef CAS PubMed.
- D. A. Lukoyanov, Z.-Y. Yang, A. Pérez-González, S. Raugei, D. R. Dean, L. C. Seefeldt and B. M. Hoffman, J. Am. Chem. Soc., 2022, 144, 18315–18328 CrossRef CAS PubMed.
- Y. Xiao, K. Fisher, M. C. Smith, W. E. Newton, D. A. Case, S. J. George, H. Wang, W. Sturhahn, E. E. Alp, J. Zhao, Y. Yoda and S. P. Cramer, J. Am. Chem. Soc., 2006, 128, 7608–7612 CrossRef CAS PubMed.
- A. D. Scott, V. Pelmenschikov, Y. Guo, L. Yan, H. Wang, S. J. George, C. H. Dapper, W. E. Newton, Y. Yoda, Y. Tanaka and S. P. Cramer, J. Am. Chem. Soc., 2014, 136, 15942–15954 CrossRef CAS PubMed.
- A. I. Chumakov, R. Rüffer, H. Grünsteudel, H. F. Grünsteudel, G. Grübel, J. Metge, O. Leupold and H. A. Goodwin, Europhys. Lett., 1995, 30, 427–432 CrossRef CAS.
- W. Sturhahn, T. S. Toellner, E. E. Alp, X. Zhang, M. Ando, Y. Yoda, S. Kikuta, M. Seto, C. W. Kimball and B. Dabrowski, Phys. Rev. Lett., 1995, 74, 3832–3835 CrossRef CAS PubMed.
- E. Jiménez-Vicente, J. S. Martin Del Campo, Z.-Y. Yang, V. L. Cash, D. R. Dean and L. C. Seefeldt, in Methods in Enzymology, ed. F. Armstrong, Academic Press, 2018, vol. 613, pp. 231–255 Search PubMed.
- D. F. Harris, E. Jimenez-Vicente, Z.-Y. Yang, B. M. Hoffman, D. R. Dean and L. C. Seefeldt, J. Inorg. Biochem., 2020, 213, 111278 CrossRef CAS PubMed.
- H. J. Lipkin, Phys. Rev. B: Condens. Matter Mater. Phys., 1995, 52, 10073–10079 CrossRef CAS PubMed.
- W. Sturhahn, Hyperfine Interact., 2000, 125, 149–172 CrossRef CAS.
- V. G. Kohn and A. I. Chumakov, Hyperfine Interact., 2000, 125, 205–221 CrossRef CAS.
- W. Dong, H. Wang, M. M. Olmstead, J. C. Fettinger, J. Nix, H. Uchiyama, S. Tsutsui, A. Q. R. Baron, E. Dowty and S. P. Cramer, Inorg. Chem., 2013, 52, 6767–6769 CrossRef PubMed.
- B. Benediktsson and R. Bjornsson, Inorg. Chem., 2017, 56, 13417–13429 CrossRef CAS PubMed.
- B. Benediktsson and R. Bjornsson, Inorg. Chem., 2020, 59, 11514–11527 CrossRef CAS PubMed.
- P. Sherwood, A. H. de Vries, M. F. Guest, G. Schreckenbach, C. R. A. Catlow, S. A. French, A. A. Sokol, S. T. Bromley, W. Thiel, A. J. Turner, S. Billeter, F. Terstegen, S. Thiel, J. Kendrick, S. C. Rogers, J. Casci, M. Watson, F. King, E. Karlsen, M. Sjøvoll, A. Fahmi, A. Schäfer and C. Lennartz, J. Mol. Struct., 2003, 632, 1–28 CrossRef CAS.
- S. Metz, J. Kästner, A. A. Sokol, T. W. Keal and P. Sherwood, Wiley Interdiscip. Rev.: Comput. Mol. Sci., 2014, 4, 101–110 CAS.
- F. Neese, Wiley Interdiscip. Rev.: Comput. Mol. Sci., 2012, 2, 73–78 CAS.
- F. Neese, Wiley Interdiscip. Rev.: Comput. Mol. Sci., 2018, 8, e1327 Search PubMed.
- W. Smith and T. R. Forester, J. Mol. Graphics, 1996, 14, 136–141 CrossRef CAS PubMed.
- R. B. Best, X. Zhu, J. Shim, P. E. M. Lopes, J. Mittal, M. Feig and A. D. MacKerell Jr, J. Chem. Theory Comput., 2012, 8, 3257–3273 CrossRef CAS PubMed.
- J. Tao, J. P. Perdew, V. N. Staroverov and G. E. Scuseria, Phys. Rev. Lett., 2003, 91, 146401 CrossRef PubMed.
- V. N. Staroverov, G. E. Scuseria, J. Tao and J. P. Perdew, J. Chem. Phys., 2003, 119, 12129–12137 CrossRef CAS.
- S. Grimme, J. Antony, S. Ehrlich and H. Krieg, J. Chem. Phys., 2010, 132, 154104 CrossRef PubMed.
- S. Grimme, S. Ehrlich and L. Goerigk, J. Comput. Chem., 2011, 32, 1456–1465 CrossRef CAS PubMed.
- E. van Lenthe, E. J. Baerends and J. G. Snijders, J. Chem. Phys., 1993, 99, 4597–4610 CrossRef CAS.
- C. van Wüllen, J. Chem. Phys., 1998, 109, 392–399 CrossRef.
- F. Weigend and R. Ahlrichs, Phys. Chem. Chem. Phys., 2005, 7, 3297–3305 RSC.
- D. A. Pantazis, X.-Y. Chen, C. R. Landis and F. Neese, J. Chem. Theory Comput., 2008, 4, 908–919 CrossRef CAS PubMed.
- F. Neese, F. Wennmohs, A. Hansen and U. Becker, Chem. Phys., 2009, 356, 98–109 CrossRef CAS.
- R. Izsák and F. Neese, J. Chem. Phys., 2011, 135, 144105 CrossRef PubMed.
- F. Weigend, Phys. Chem. Chem. Phys., 2006, 8, 1057–1065 RSC.
- J. Kästner, J. M. Carr, T. W. Keal, W. Thiel, A. Wander and P. Sherwood, J. Phys. Chem. A, 2009, 113, 11856–11865 CrossRef PubMed.
- V. Barone and M. Cossi, J. Phys. Chem. A, 1998, 102, 1995–2001 CrossRef CAS.
- B. Benediktsson and R. Bjornsson, J. Chem. Theory Comput., 2022, 18, 1437–1457 CrossRef CAS PubMed.
- A. T. Thorhallsson, B. Benediktsson and R. Bjornsson, Chem. Sci., 2019, 10, 11110–11124 RSC.
- B. Benediktsson, A. T. Thorhallsson and R. Bjornsson, Chem. Commun., 2018, 54, 7310–7313 RSC.
- D. Lukoyanov, V. Pelmenschikov, N. Maeser, M. Laryukhin, T. C. Yang, L. Noodleman, D. R. Dean, D. A. Case, L. C. Seefeldt and B. M. Hoffman, Inorg. Chem., 2007, 46, 11437–11449 CrossRef CAS PubMed.
- J. Kim and D. C. Rees, Science, 1992, 257, 1677–1682 CrossRef CAS PubMed.
- Y. Xiao, M. Koutmos, D. A. Case, D. Coucouvanis, H. Wang and S. P. Cramer, Dalton Trans., 2006, 2192–2201 RSC.
- J. Christiansen, P. J. Goodwin, W. N. Lanzilotta, L. C. Seefeldt and D. R. Dean, Biochemistry, 1998, 37, 12611–12623 CrossRef CAS PubMed.
- E. Jimenez-Vicente, Z. Y. Yang, W. K. Ray, C. Echavarri-Erasun, V. L. Cash, L. M. Rubio, L. C. Seefeldt and D. R. Dean, J. Biol. Chem., 2018, 293, 9812–9823 CrossRef CAS PubMed.
- C. Van Stappen, E. Jiménez-Vicente, A. Pérez-González, Z.-Y. Yang, L. C. Seefeldt, S. DeBeer, D. R. Dean and L. Decamps, Chem. Sci., 2022, 13, 3489–3500 RSC.
- T. Spatzal, K. A. Perez, O. Einsle, J. B. Howard and D. C. Rees, Science, 2014, 345, 1620–1623 CrossRef CAS PubMed.
- W. Kang, C. C. Lee, A. J. Jasniewski, M. W. Ribbe and Y. Hu, Science, 2020, 368, 1381–1385 CrossRef CAS PubMed.
- T. Spatzal, K. A. Perez, J. B. Howard and D. C. Rees, eLife, 2015, 4, e11620 CrossRef PubMed.
- Z. Li, J. Li, N. S. Dattani, C. J. Umrigar and G. K.-L. Chan, J. Chem. Phys., 2019, 150, 024302 CrossRef PubMed.
- Z. Li, S. Guo, Q. Sun and G. K.-L. Chan, Nat. Chem., 2019, 11, 1026–1033 CrossRef CAS PubMed.
- S. Sharma, K. Sivalingam, F. Neese and G. K.-L. Chan, Nat. Chem., 2014, 6, 927–933 CrossRef CAS PubMed.
Footnotes |
| † Electronic supplementary information (ESI) available. See DOI: https://doi.org/10.1039/d2fd00174h |
| ‡ These authors contributed equally to this work. |
| § Current address: Department of Chemistry, University of Texas at Austin, 105 E 24th St., Austin, TX 78712, USA. |
| ¶ Current address: Department of Energy Conversion and Storage, Technical University of Denmark, Anker Engelundsvej 1, Kgs. Lyngby, 2800, Denmark. |
| This journal is © The Royal Society of Chemistry 2023 |