 Open Access Article
Low temperature ammonia synthesis by surface protonics over metal supported catalysts
Yasushi
Sekine
 *
*
Waseda University, 3-4-1, Okubo, Shinjuku, Tokyo, Japan 1698555. E-mail: ysekine@waseda.jp
First published on 29th November 2022
Abstract
Low-temperature ammonia synthesis by applying an electric field to a solid heterogeneous catalyst was investigated to realize an on-demand, on-site catalytic process for converting distributed renewable energy into ammonia. By applying an electric field to the catalyst, even at low temperatures, the reaction proceeds efficiently by an “associative mechanism” in which proton-conducting species on the support surface promote the formation of N2Had intermediates through surface protonics. Kinetics, isotope exchange, infrared spectroscopy, X-ray spectroscopy, and AC impedance analysis were performed to clarify the effect of metal and catalyst support structure on the reaction, and an evaluation method for the surface protonics of the support was established to analyze the reaction mechanism, and further analysis using computational chemistry was also conducted. The elementary step determining catalytic activity changed from N2 dissociation to N2H formation, and this difference resulted in high activity for ammonia synthesis at low temperatures even when using base metal catalysts such as Fe and Ni.
Introduction
In recent years, technologies for converting electricity derived from renewable energy sources into hydrogen for storage and transportation have been attracting a lot of attention. Ammonia is anticipated for wider application as a useful hydrogen carrier because of its high hydrogen content (17.6 wt%), easy handling due to its high boiling point (240 K), and lack of CO2 emissions upon combustion. Ammonia synthesis is an exothermic reaction, as shown in the following equation: the Haber–Bosch process achieves high efficiency by thoroughly reusing the exothermic reaction heat through advanced heat exchange.1–6| N2(g) + 3H2(g) → 2NH3(g), ΔH = −92.4 kJ mol−1 | (1) |
Ammonia synthesis requires dissociation and activation of N2, but the activation energy is large because of the strong N2 triple bond, making it difficult to obtain a fast reaction rate at low temperatures. However, because ammonia synthesis is an exothermic reaction, the equilibrium conversion rate decreases considerably at high temperatures. Therefore, the reaction must occur under high-pressure conditions to maintain a high conversion rate at high temperatures.7–16 Because of these kinetic and equilibrium constraints, current industrial ammonia synthesis has been done under high-temperature and high-pressure conditions for more than 110 years, at 673 K and 250 bar. It is extremely energy efficient.
By contrast, renewable energy has to be dispersed, and supply and demand are difficult to match geographically and temporally. When considering future expansion of renewable energy usage, one option to consider is miniaturisation of ammonia synthesis processes – producing it on-site, and driving the reaction as needed. Small, dispersed processes are not compatible with conventional high-temperature, high-pressure Haber–Bosch methods because of the difficulty of heat exchange and thermal management.
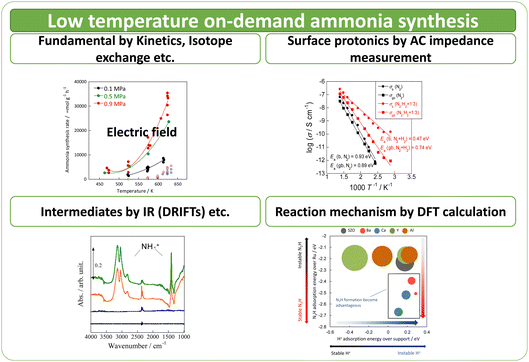
Here the author investigates a compact ammonia synthesis system using renewable energy for on-site and on-demand operation at low temperatures. For this purpose, the author has investigated ammonia synthesis using a novel process by which an electric field is applied to the reaction field to accelerate reactions.17–19 By applying an electric field to the reaction field, protonics can be developed on the surface of the support. Also, various reactions can be promoted in the low-temperature range. The effects of metal and catalyst support structure, evaluation of surface protonics on the supports, analysis of reaction mechanisms, and computational analysis and prediction of the catalytic reactions driven at low temperatures are summarised in this paper (Fig. 1).
Experimental and calculation methods
The catalyst is a heterogeneous solid catalyst consisting of a fine metal supported on a semiconducting support. Earlier reports in the literature describe catalyst preparation methods.17–19 For catalyst preparation, Ru, Fe, Co, Ni, Pd, or Pt are used as the metal. The precursors of the respective metals are Ru(acac)3, Fe(NO3)3–9H2O, Co(NO3)3–6H2O, Ni(NO3)3–6H2O, Pd(OCOCH3)2, and Pt(NH3)4(NO3). Also, CeO2, CexZr1−xO2, SrZrO3, and materials doped with different cations are used as supports. After the catalysts are impregnated, dried, and calcined, the powders were graded to particle sizes of 355–500 μm for the activity tests. A fixed-bed flow reactor was used. Then electrodes were inserted at both ends of the catalyst bed to provide DC potential of tens to hundreds of volts. The electric field was applied by passing a current of 3–9 mA through the catalyst itself. The catalyst bed temperature, which was set to 373–673 K, was measured by inserting a thermocouple directly into the catalyst bed. The temperature was evaluated using a NIR thermo-camera and Debye–Waller (DW) factor measurement of EXAFS to confirm that the effects of the electric field application were not caused by electrical heating (Joule heat). The currents and voltages between the electrodes were observed with probes and an oscilloscope (TDS 2001C; Tektronix Inc.).The obtained catalysts were structurally characterised before and after the reaction. The specific surface area was measured using the Brunauer–Emmett–Teller (BET) method, the crystal structure analysis using XRD, and the microstructure analysis of supported metals using TEM and EXAFS (SPring-8 BL14B2, Hyogo, Japan). The electronic structure was evaluated using XPS and XANES (SPring-8 BL14B2, Hyogo, Japan). Also, H2 adsorption–desorption was measured (BELCAT II; MicrotracBEL Corp.) to calculate the particle sizes of the active metals. As a pretreatment, reduction was performed under the following conditions: H2![[thin space (1/6-em)]](https://www.rsc.org/images/entities/char_2009.gif) :
:![[thin space (1/6-em)]](https://www.rsc.org/images/entities/char_2009.gif) Ar = 3
Ar = 3![[thin space (1/6-em)]](https://www.rsc.org/images/entities/char_2009.gif) :
:![[thin space (1/6-em)]](https://www.rsc.org/images/entities/char_2009.gif) 1, 60 SCCM total flow rate, 973 K, 0.5 h, followed by H2 adsorption at 323 K for 15 min, with purging of the remaining H2 gas in the gas phase by flowing Ar at the same temperature. The temperature was then raised to 773 K with a ramping rate of 10 K min−1 under an Ar atmosphere. The amount of H2 during desorption was detected. For the analysis of reaction rates, TOF was calculated in two ways: the TOF-surface (TOF-s) was calculated by dividing the metallic surface area of each active metal surface using eqn (2) below. The TOF-perimeter (TOF-p) was calculated from eqn (3) by dividing the number of moles at the metal–support interface. The reasons for employing two methods for calculating TOF are discussed later.
1, 60 SCCM total flow rate, 973 K, 0.5 h, followed by H2 adsorption at 323 K for 15 min, with purging of the remaining H2 gas in the gas phase by flowing Ar at the same temperature. The temperature was then raised to 773 K with a ramping rate of 10 K min−1 under an Ar atmosphere. The amount of H2 during desorption was detected. For the analysis of reaction rates, TOF was calculated in two ways: the TOF-surface (TOF-s) was calculated by dividing the metallic surface area of each active metal surface using eqn (2) below. The TOF-perimeter (TOF-p) was calculated from eqn (3) by dividing the number of moles at the metal–support interface. The reasons for employing two methods for calculating TOF are discussed later.
 | (2) |
 | (3) |
To evaluate proton conduction at the catalyst surface, the surface impedance was measured using the AC impedance method in different atmospheres. Earlier reports in the literature describe the method.20–24 The sample was pressurised with CeO2 (about 60% relative density), the measurement cell (Probostat; NorECs AS) – with a two-electrode four-wire method setup – was used with an impedance analyser, an alpha-A impedance with a ZG4 and an interface (Novocontrol Technologies). Then Pt was applied for electrodes using a sputtering method. The measurement frequency was 106–10−2 Hz. The voltage amplitude was 0.5 V rms. The hydrogen partial pressure was varied to extract only surface conduction. An H/D isotope exchange test was also performed to ensure the surface protonics.
Computational density functional theory (DFT) calculations were used to evaluate the stability of the intermediates on the catalyst surface and the proton conduction on the support. The dissociation energies of the N2 molecule on the active metal surface and the formation energies of the N2H intermediates were calculated. As software, the Vienna ab initio simulation package (VASP) 5.4.1 was used. Also, the projector-augmented wave (PAW) method was used. The functional was GGA-RPBE. The k-point mesh was 0.04 Å−1, with cut-off energy of 400 eV, and van der Waals force using “zero damping DFT-D3 method of Grimme.” Spin was considered in all calculations.25–29 The slab models were Ru_hcp(0001), Fe_bcc(110), Co_hcp(0001), Ni_fcc(111), Pd_fcc(111), Pt_fcc(111) (vacuum layer 15 Å, surface 16 atoms × 4 layers, top 2 layers relaxed) for each metal. For dissociation energies and N2H dissociation energies, the author first calculated the adsorption energies of N2ad, Nad, and N2Had species using eqn (4) below.
| ΔE(molecule adsorption) = E(molecule/slab) − E(slab) − E(molecule) | (4) |
The adsorption values of N2 and N2H were calculated for both end-on and side-on types. Then the reaction energies were compared between the initial and final states of the reaction. The N2 dissociation was calculated from the difference of the reaction energies according to the following eqn (5).
| ΔE(N2 dissociation) = ΔE(N adsorption) − ΔE(N2 adsorption) | (5) |
Because the catalyst support is fixed (e.g., CeO2 or SrZrO3) in the activity test, the nature of the proton on the support is assumed to be the same for each active metal. The N2H production energy is calculated from the following eqn (6).
| Pseudo-ΔE(N2H formation) = ΔE(N2H adsorption) − ΔE(N2 adsorption) | (6) |
Results and discussion
Characteristic features of catalytic reaction in the electric field
Using a catalyst with a semiconductor as a metal support and applying a DC electric field as described above, a sufficiently high ammonia synthesis rate was obtained even at low temperatures of 373–573 K, where the reaction does not proceed with heating. The catalyst temperature was measured using multiple methods with thermocouples – a NIR thermo-camera, and even DW factor measurement by operando-EXAFS – which clarified that the effects of electric field application enhancing catalyst performance, were not attributable to catalyst Joule heating. The temperature increase by Joule heating was negligible to the reaction promotion. Furthermore, the partial pressure dependence and isotope effects in the electric field differed from those in the heating case, indicating that the reaction mechanisms under heating and electric field, differ. Various operando-characterisations and DFT calculations provided detailed physicochemical evidence for the effects of electric field application. The author discusses each topic based on the detailed data in the following sections, and thereafter deepens the discussion of electric field application effects.Temperature dependence of reaction rates of ammonia synthesis on ruthenium-supported catalysts
When applying an electric field, the catalyst support must be a semiconducting material. The reason for this necessity is described later. Therefore, SrZrO3 perovskite and CeO2 were selected as the catalyst supports. Also, catalysts with supported metals were used for both heating and electric field applications. Reactions were performed at different temperatures with a 3![[thin space (1/6-em)]](https://www.rsc.org/images/entities/char_2009.gif) :
:![[thin space (1/6-em)]](https://www.rsc.org/images/entities/char_2009.gif) 1 hydrogen and nitrogen gas mixture. Based on results of pre-screening, a 9.9 wt% Cs/5.0 wt% Ru/SrZrO3 catalyst was selected, which showed high performance even when heated. The reaction rates were compared under heating and when subjected to an electric field. The results are presented in Fig. 2 and indicate that the catalyst exhibits high activity at low temperatures when subjected to the electric field. Moreover, the catalyst achieved a high reaction rate of 30 mmol g−1 h−1 at 643 K and 0.9 MPa, almost 10 times faster than that of heating, with an apparent activation energy of 121 kJ mol−1 in the case of heating, to 37 kJ mol−1 in the case of an electric field.30
1 hydrogen and nitrogen gas mixture. Based on results of pre-screening, a 9.9 wt% Cs/5.0 wt% Ru/SrZrO3 catalyst was selected, which showed high performance even when heated. The reaction rates were compared under heating and when subjected to an electric field. The results are presented in Fig. 2 and indicate that the catalyst exhibits high activity at low temperatures when subjected to the electric field. Moreover, the catalyst achieved a high reaction rate of 30 mmol g−1 h−1 at 643 K and 0.9 MPa, almost 10 times faster than that of heating, with an apparent activation energy of 121 kJ mol−1 in the case of heating, to 37 kJ mol−1 in the case of an electric field.30
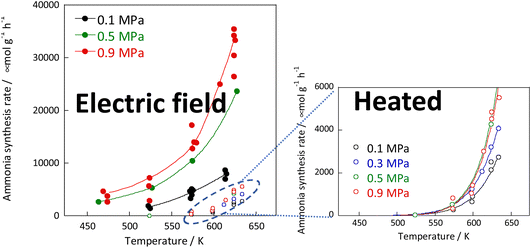 | ||
Fig. 2 Reaction rates of ammonia synthesis over 9.9 wt% Cs/5.0 wt% Ru/SrZrO3 catalyst with and without the electric field: 200 mg catalyst, 0 or 6 mA current, H2![[thin space (1/6-em)]](https://www.rsc.org/images/entities/char_2009.gif) : :![[thin space (1/6-em)]](https://www.rsc.org/images/entities/char_2009.gif) N2 = 3 N2 = 3![[thin space (1/6-em)]](https://www.rsc.org/images/entities/char_2009.gif) : :![[thin space (1/6-em)]](https://www.rsc.org/images/entities/char_2009.gif) 1, 240 SCCM total flow rate. 1, 240 SCCM total flow rate. | ||
The detailed reasons for the higher activity at lower temperatures when an electric field is applied are investigated further. The catalyst support was changed to CeO2, which is highly active especially at low temperatures; Ru was supported similarly. Details of the reaction at low-temperature were investigated by heating and by applying an electric field. The temperature dependence was evaluated using an Arrhenius type method (Fig. 3). For heating, a general linear Arrhenius plot was obtained. However, when the electric field was applied, the specific temperature dependence of the anti-Arrhenius type was observed only at 373–473 K, where the rate of ammonia synthesis was greater at lower temperatures. At temperatures above 573 K and below 373 K, results conform to the Arrhenius law.31
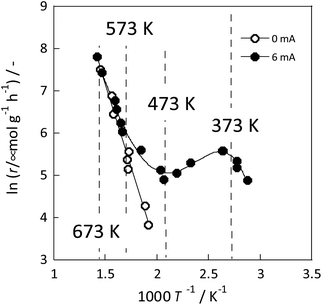 | ||
Fig. 3 Reaction rate of ammonia synthesis over 1 wt% Ru/CeO2 catalyst with and without the electric field: 100 mg catalyst, 0 or 6 mA current, H2![[thin space (1/6-em)]](https://www.rsc.org/images/entities/char_2009.gif) : :![[thin space (1/6-em)]](https://www.rsc.org/images/entities/char_2009.gif) N2 = 3 N2 = 3![[thin space (1/6-em)]](https://www.rsc.org/images/entities/char_2009.gif) : :![[thin space (1/6-em)]](https://www.rsc.org/images/entities/char_2009.gif) 1, 240 SCCM total flow rate.31 1, 240 SCCM total flow rate.31 | ||
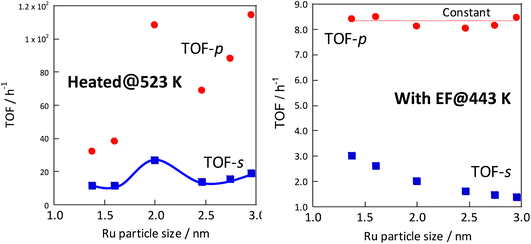
In each case, the TOF was calculated and compared by dividing the reaction rate by the number of active sites during heating or in the case of applying an electric field. The number of active sites divided by the number of active sites per metal surface area, which is the most commonly used method, is designated as TOF-s (eqn 2). The number of active sites divided by the length of the interface between the supported metal and the catalyst support is designated as TOF-p (eqn 3). The particle size of the supported metal was changed by changing the catalyst preparation conditions. The activity at each particle size was measured using TOF-s and TOF-p both with and without the electric field, as shown in Fig. 4. Results indicate that, in the case of catalytic reaction by heating without the applied electric field, TOF-s showed a maximum value of metal particle size around 2 nm. No significant difference was found for other regions. This result is consistent with earlier reports describing that the percentage of step sites (B5 sites) on the Ru surface reaches a maximum at a particle size of about 2 nm.32,33 At the same time, the catalytic reaction under heating showed little correlation with respect to TOF-p. However, surprisingly, in the case of electric field application (performed at 443 K to suppress catalytic activity from heating), no dependence was found for TOF-s, which decreases monotonically and where TOF-p takes a constant value. This finding is evidence that the catalytic reaction mechanism under heating differs from that with electric field application. The TOF-s-dependent catalytic reaction upon heating indicates that the reaction proceeds on the Ru metal. However, the TOF-p-dependent electric-field catalysed reaction presumably proceeds at the Ru–substrate interface.
Kinetics study to elucidate the reaction mechanism
The rates of ammonia synthesis were then measured on the Ru catalyst at various partial pressures of hydrogen, nitrogen, and ammonia for heating and with application of an electric field. Results show that the partial pressure dependence can be obtained using eqn (7) for heating and in the case of electric field application, eqn (8). In the case of heating, the rate was compared at 623 K because the rate is too low at low temperatures. In the case of electric field application, the rate was compared at 473 K, where the thermal activity is zero, because a heating effect appears at high temperatures.| Without electric field (623 K): r = kPN20.7PH2−0.2PNH3−0.1 | (7) |
| With electric field (473 K): r = kPN20.2PH20PNH3−0.3 | (8) |
Consequently, on the same Ru catalyst, the partial pressure dependence at 623 K on heating was strongly dependent on nitrogen and negative order of hydrogen. This dependence might be attributable to the conventional effect of hydrogen poisoning on Ru metal during ammonia synthesis.8 However, in the case of electric field application, the partial pressure of hydrogen was almost zero with respect to the reaction rate for 373–473 K. With electric field application, order variation was observed at different temperatures. As shown in Fig. 5, hydrogen had a positive effect at the low-temperature side and a negative effect at the high-temperature side because of the concomitant heated catalytic reaction.
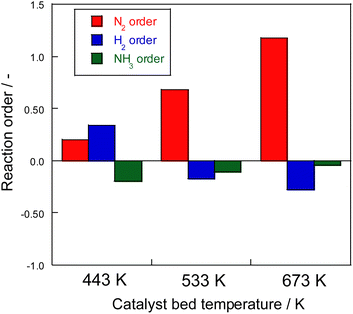 | ||
| Fig. 5 Reaction order of ammonia synthesis over 1 wt% Ru/CeO2 catalyst with the electric field: 100 mg catalyst, 0 or 6 mA current, 240 SCCM total flow rate. | ||
Effects of metal type on electric field ammonia synthesis
Up to this point, the author has investigated details of the activity on the Ru catalyst for ammonia synthesis in an electric field. Results indicate that the reaction rate depends on TOF-p when the electric field is applied, suggesting that ammonia might be formed at the metal periphery by collision with hydrogen on the catalyst support. Therefore, the author wondered if such a reaction might proceed over various metals. The author compared the respective degrees of activity of metal catalysts other than Ru. For this study, CeO2 was used as a catalyst support. Six active metals (Ru, Fe, Ni, Co, Pd, and Pt) were impregnated. The order of activity was examined. Before the reaction, the reactants were pre-treated by reduction at N2![[thin space (1/6-em)]](https://www.rsc.org/images/entities/char_2009.gif) :
:![[thin space (1/6-em)]](https://www.rsc.org/images/entities/char_2009.gif) H2 = 1
H2 = 1![[thin space (1/6-em)]](https://www.rsc.org/images/entities/char_2009.gif) :
:![[thin space (1/6-em)]](https://www.rsc.org/images/entities/char_2009.gif) 3 (total 240 SCCM), 973 K for 0.5 h. An earlier study confirmed that Co is reduced completely under these reduction conditions.34 The Ellingham diagram shows that other metals are reduced more easily than Co.35
3 (total 240 SCCM), 973 K for 0.5 h. An earlier study confirmed that Co is reduced completely under these reduction conditions.34 The Ellingham diagram shows that other metals are reduced more easily than Co.35
The results are presented in Fig. 6. In the case of heating, comparison was made at 723 K because the activity is too low at lower temperatures. When using an electric field, the comparison was made at 373 K, where the reaction does not proceed with heat because the heating effect is concurrent at higher temperatures.
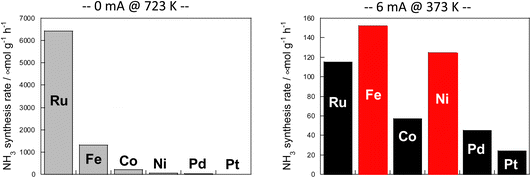 | ||
Fig. 6 Reaction rates of ammonia synthesis over various metal catalysts supported on CeO2 (left) without and (right) with an electric field: 100 mg catalyst amount; 0 or 6 mA imposed current; H2![[thin space (1/6-em)]](https://www.rsc.org/images/entities/char_2009.gif) : :![[thin space (1/6-em)]](https://www.rsc.org/images/entities/char_2009.gif) N2 = 3 N2 = 3![[thin space (1/6-em)]](https://www.rsc.org/images/entities/char_2009.gif) : :![[thin space (1/6-em)]](https://www.rsc.org/images/entities/char_2009.gif) 1; 240 SCCM total flow rate.36 1; 240 SCCM total flow rate.36 | ||
Results show that the ordinal order of activity was confirmed as follows in the case of heating. The findings are the same as earlier reported results for catalytic activity for ammonia synthesis.36
The heated catalysts showed activities in the order Ru > Fe > Co > Ni > Pd = Pt = 0.
The activity sequence is completely different when the electric field is applied. More surprisingly, Co and Ni, which are not active at all under thermal conditions, also show high activity.
In the electric field, the order changed drastically (Fe > Ni > Ru > Co > Pd > Pt).
From these facts, results suggest that under heat, a metal with the ability to dissociate nitrogen is necessary for the reaction to proceed by the conventionally known dissociative mechanism, but with application of the electric field, nitrogen dissociation proceeds along a different path. The reaction can proceed if the metal has only hydrogenation potential.
Analysis of reaction mechanisms
The “dissociative mechanism” conventionally known for ammonia synthesis is shown in eqn (9)–(11) below.| H2(g) + 2* ↔ 2H* | (9) |
| N2(g) + 2* ↔ 2N* | (10) |
| N* + 3H* ↔ NH3(g) + 4* | (11) |
Therefore, the behaviour of the Ru catalyst with a transient supply of 15N was compared in the case of heating and in the case of an applied electric field. The results obtained from transient response tests using 28N2 and switching to 30N2 are shown in Fig. 7. When 30N2 was supplied in the presence of the electric field at 473 K, 29N2 formation was observed. However, tests with heating showed that 29N2 was not detected, even at reaction temperatures as high as 673 K. For the isotope test during application of the electric field, the electric field could not be applied stably without hydrogen supply. This phenomenon might be attributable to the fact that hydrogen-containing species play the role of surface ion conductors in the application of the electric field, thereby enabling stable application of the electric field.
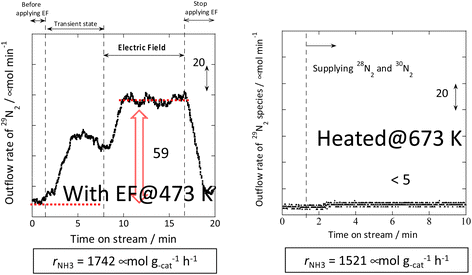 | ||
Fig. 7 Isotope exchange tests using 30N2: (left) with the electric field at 473 K and (right) without the electric field at 673 K. Catalyst, 9.9 wt% Cs/5.0 wt% Ru/SrZrO3, 200 mg; flow, 28N2![[thin space (1/6-em)]](https://www.rsc.org/images/entities/char_2009.gif) : :![[thin space (1/6-em)]](https://www.rsc.org/images/entities/char_2009.gif) 30N2 30N2![[thin space (1/6-em)]](https://www.rsc.org/images/entities/char_2009.gif) : :![[thin space (1/6-em)]](https://www.rsc.org/images/entities/char_2009.gif) H2 H2![[thin space (1/6-em)]](https://www.rsc.org/images/entities/char_2009.gif) : :![[thin space (1/6-em)]](https://www.rsc.org/images/entities/char_2009.gif) Ar = 6 Ar = 6![[thin space (1/6-em)]](https://www.rsc.org/images/entities/char_2009.gif) : :![[thin space (1/6-em)]](https://www.rsc.org/images/entities/char_2009.gif) 6 6![[thin space (1/6-em)]](https://www.rsc.org/images/entities/char_2009.gif) : :![[thin space (1/6-em)]](https://www.rsc.org/images/entities/char_2009.gif) 36 36![[thin space (1/6-em)]](https://www.rsc.org/images/entities/char_2009.gif) : :![[thin space (1/6-em)]](https://www.rsc.org/images/entities/char_2009.gif) 12 SCCM; either 0 or 6 mA current.30 12 SCCM; either 0 or 6 mA current.30 | ||
In addition, the intermediates were evaluated using in situ DRIFTS with Ru catalyst for the heating and electric field cases.
DRIFT spectra were measured with and without the electric field applied to the catalyst layer using an infrared cell that had been customised to allow gas flow while applying the electric field. The in situ DRIFT spectra obtained under the respective conditions are portrayed in Fig. 8. As shown in Fig. 8(A), no peak was observed when only N2 and H2 were supplied at 473 K. When the electric field was applied, four sharp peaks were detected around 3146, 3046, 2819, and 1406 cm−1. These peaks were not observed when only N2 was supplied with the electric field (C) or when ammonia was synthesised at 648 K without the electric field (D). Consequently, these four peaks were observed only when the electric field was applied to the catalyst bed. They were assigned to the stretching, combination tone, overtone, and bending modes of the N–H vibration which originated from NH4+. These NH4+ were generated from synthesised NH3 and protons. The protons were formed from H2. The reaction is thought to have proceeded by collision of surface protons with nitrogen adsorbed onto the metal when the electric field was applied. Fig. 8(E) is an in situ DRIFT spectrum using D2. No isotope-derived peaks appeared when D2 was supplied simply by heating the generated ammonium ions. However, upon application of the electric field, two peaks assigned to the ND4+ combination tone and overtone mode were observed at around 2252 and 2131 cm−1. These peaks were weakened when H2 flowed again in the presence of the electric field. These observations suggest that when the electric field is applied to the catalyst bed, protons contribute to the isotope exchange through the catalyst support. In this case, the electric field could not be applied without supplying H2. Fig. 8(B) also shows that surface protonation contributes only when the forward reaction of ammonia synthesis proceeds in the presence of the electric field. This result suggests that when the electric field is applied, the reaction proceeds via an “associative mechanism” that is already known for nitrogenase, and others via surface protonics.
 | (12) |
 | (13) |
 | (14) |
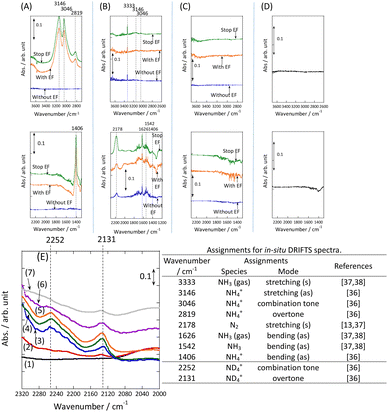 | ||
Fig. 8
In situ DRIFTS spectra with, without, and after switching the electric field off (EF): (A) N2![[thin space (1/6-em)]](https://www.rsc.org/images/entities/char_2009.gif) : :![[thin space (1/6-em)]](https://www.rsc.org/images/entities/char_2009.gif) H2 = 15 H2 = 15![[thin space (1/6-em)]](https://www.rsc.org/images/entities/char_2009.gif) : :![[thin space (1/6-em)]](https://www.rsc.org/images/entities/char_2009.gif) 45 SCCM at 473 K; (B) 10% NH3/He 45 SCCM at 473 K; (B) 10% NH3/He![[thin space (1/6-em)]](https://www.rsc.org/images/entities/char_2009.gif) : :![[thin space (1/6-em)]](https://www.rsc.org/images/entities/char_2009.gif) Ar = 1 Ar = 1![[thin space (1/6-em)]](https://www.rsc.org/images/entities/char_2009.gif) : :![[thin space (1/6-em)]](https://www.rsc.org/images/entities/char_2009.gif) 59 SCCM at 473 K; (C) N2 59 SCCM at 473 K; (C) N2![[thin space (1/6-em)]](https://www.rsc.org/images/entities/char_2009.gif) : :![[thin space (1/6-em)]](https://www.rsc.org/images/entities/char_2009.gif) Ar = 15 Ar = 15![[thin space (1/6-em)]](https://www.rsc.org/images/entities/char_2009.gif) : :![[thin space (1/6-em)]](https://www.rsc.org/images/entities/char_2009.gif) 45 SCCM at 473 K; (D) N2 45 SCCM at 473 K; (D) N2![[thin space (1/6-em)]](https://www.rsc.org/images/entities/char_2009.gif) : :![[thin space (1/6-em)]](https://www.rsc.org/images/entities/char_2009.gif) H2 = 15 H2 = 15![[thin space (1/6-em)]](https://www.rsc.org/images/entities/char_2009.gif) : :![[thin space (1/6-em)]](https://www.rsc.org/images/entities/char_2009.gif) 45 SCCM at 648 K (without EF, catalytic reaction); (E) experiments using an isotope (D2) at 473 K – (1) after imposing EF with N2 and H2, (2) D2 (15 SCCM) was supplied, (3) D2 with EF (10 mA), (4) after imposing EF with D2, (5) H2 (15 SCCM) was supplied again, (6) H2 with EF (10 mA), (7) after imposing EF with H2 and catalyst (9.9 wt% Cs/5.0 wt% Ru/SrZrO3; current, 0, 6, or 10 mA).30 45 SCCM at 648 K (without EF, catalytic reaction); (E) experiments using an isotope (D2) at 473 K – (1) after imposing EF with N2 and H2, (2) D2 (15 SCCM) was supplied, (3) D2 with EF (10 mA), (4) after imposing EF with D2, (5) H2 (15 SCCM) was supplied again, (6) H2 with EF (10 mA), (7) after imposing EF with H2 and catalyst (9.9 wt% Cs/5.0 wt% Ru/SrZrO3; current, 0, 6, or 10 mA).30 | ||
Correlation between surface protonics and temperature dependence of reactions
This study has shown that ammonia synthesis proceeds even at low temperatures when an electric field is applied, that the hydrogen order is positive in the electric field at low temperatures, that N2 activation is readily induced by hydrogen in the electric field from isotope exchange by 15N and D, and that the metal periphery is the active site in this case. These findings are thought to be attributable to the fact that protons on the catalyst support surface facilitate the dissociation of N2 through a specific reaction mechanism when the electric field is applied. In other words, application of the electric field promotes the NH3 synthesis reaction by surface proton conduction even in a dry atmosphere.23Based on these results, the author predicts that the previously described peculiar temperature dependence of the anti-Arrhenius type at low temperatures, when the electric field is applied, might depend on the amount of surface protons contributing to the reaction. Therefore, in situ FT-IR measurements were taken to elucidate the temperature dependence of the concentration of surface hydroxyl groups derived from hydrogen adsorption on the catalyst surface in dry (i.e., ammonia synthesis atmosphere) conditions. The relative value was calculated from the equation based on the OH peak area.
| θ(T) = area(T)/area(323 K) | (15) |
As Fig. 9 shows, the concentration of hydroxyl groups on the catalyst surface decreased concomitantly with increasing temperature, especially in the temperature range where NH3 synthesis activity exhibited anti-Arrhenius behaviour. The concentration was saturated below 373 K because the adsorption phenomenon is more favourable at lower temperatures (because ΔG = ΔH − TΔS, and ΔH < 0, ΔS < 0 for the adsorption). Based on these results, the total reaction rate rcalc.(T) was calculated assuming that it is the sum of the conventional heated reaction rate proceeding by direct dissociation of N2 (rdissociative(T)) and the reaction rate via the reaction between protons and N2 when the electric field is applied (rassociative(T)) as shown in eqn (16). The active sites of these reactions of two types are separated into two systems because they differ in terms of the active metal or the three-phase interface.
| rcalc.(T) = rconventional(T) + θ(T) × rOH(T) | (16) |
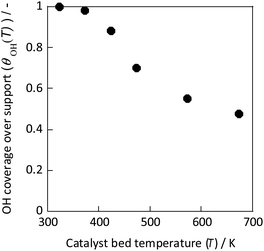 | ||
| Fig. 9 OH coverage over CeO2 at various temperatures measured using IR.31 | ||
In eqn (17), the first term represents the reaction rate promoted by heating. The second term stands for the reaction rate promoted by the electric field. The reaction by heating proceeds on the active metal, whereas the reaction by the application of the electric field proceeds at the three-phase interface (gas phase–support–active metal interface). The rdissociative(T) is extrapolated from the high-temperature region (573–673 K), and the rassociative(T) from the low-temperature region (323–373 K). Assuming a proportional relation between the reaction rate and surface hydroxyl concentration, the activity upon application of the electric field was expressed as the product of rassociative(T) and the dimensionless hydroxyl concentration. The calculated value based on this assumption shows good agreement with the experimentally obtained value (Fig. 10). These results indicate that the amount of protons on the catalyst surface play an important role in the electric-field ammonia synthesis, resulting in a peculiar temperature dependence of the reaction rate, which increases at lower temperatures of around 373–473 K.31
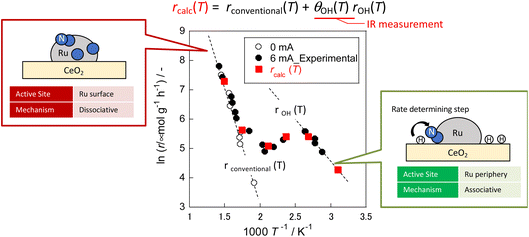 | ||
| Fig. 10 Reaction rates of ammonia synthesis with and without an electric field over Ru/CeO2 based on OH coverage over CeO2 at various temperatures measured using IR.31 | ||
Investigation of support structure effects on ammonia synthesis in an electric field
Because it is concluded from above-described results, that the protons conducting on the support promote N2 dissociation, the state of protons on the surface of the solid catalyst also has a marked effect on the rate of ammonia synthesis under the electric field. In addition to the amount of protons adsorbed onto the support, the conductivity and reactivity of the protons are important factors. Therefore, the author attempted to improve the reaction rate by doping different cations into the catalyst support and by changing their chemical properties.First, the author investigated the different cation doping effects on the ammonia synthesis rate in the electric field using a SrZrO3 support that has shown good catalytic performance in earlier studies. Ba2+, Ca2+, Al3+, and Y3+ were selected as dopants for SrZrO3. The catalysts were prepared by doping 12.5 mol% of different cations (Sr0.875Ba0.125ZrO3−δ, Sr0.875Ca0.125ZrO3−δ, SrZr0.875Y0.125O3−δ, SrZr0.875Al0.125O3−δ) into SrZrO3. These were synthesised using the complex polymerisation method. The rate of ammonia synthesis with these catalysts was measured at 423 K when the electric field was applied. The activity test results are presented in Fig. 11.38 It was confirmed that doping Ba2+ or Ca2+ into SrZrO3 doubled the reaction rate. However, no marked change was found in the reaction rate when Al3+ and Y3+ were doped. The results of Ru particle size evaluation using electron microscopy (FE-TEM) showed no remarkable difference in the size distribution of Ru particles supported by the respective dopants. The electronic state of Ru particles was also the same among these. The response voltage and imposed electric power when the electric field was applied was also the same. From these results, it can be inferred that the increase in the reaction rate by Ba2+ and Ca2+ doping is attributable to the change in the formation energy of the N2H intermediate, which is the rate-limiting step, by the change in the properties of the support.
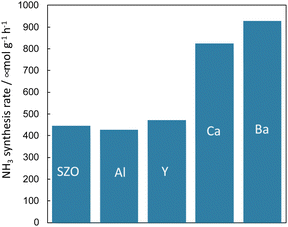 | ||
Fig. 11 Effects of different cation doping into SrZrO3 support on the ammonia synthesis rate in the electric field using Ru as a supported metal: 100 mg catalyst, 6 mA current, H2![[thin space (1/6-em)]](https://www.rsc.org/images/entities/char_2009.gif) : :![[thin space (1/6-em)]](https://www.rsc.org/images/entities/char_2009.gif) N2 = 3 N2 = 3![[thin space (1/6-em)]](https://www.rsc.org/images/entities/char_2009.gif) : :![[thin space (1/6-em)]](https://www.rsc.org/images/entities/char_2009.gif) 1, 240 SCCM total flow rate.38 1, 240 SCCM total flow rate.38 | ||
Evaluation of surface protonics in an ammonia synthesis atmosphere on a supported oxide
Results showed that the rate of electric field ammonia synthesis increases with the amount of surface protons, and indicated that a higher proton donating capacity from the catalyst support is related to greater amounts of N2H intermediates formed and to a higher reaction rate. Consequently, proton conduction at the catalyst support surface plays an important role in the electric field ammonia synthesis. To elucidate the surface protonics, the author evaluated surface proton conduction by alternating current (AC) impedance measurements (EIS) of oxide supports in the ammonia synthesis atmosphere.First, two pellets with different relative densities, porous SrZrO3 (60% relative density) and dense SrZrO3 (90% relative density), were prepared to extract proton conduction on the surface. In general, pellets with relative density of 50–60% are suitable for extracting surface conduction species.20,23,37 In fact, from the FE-SEM images, sufficient surface sites were observed on the porous SrZrO3. Using these samples, AC impedance measurements were taken at various temperatures under N2 and H2 atmospheres (Fig. 12). A decrease in the apparent activation energy and an increase in the conductivity were observed for the porous SrZrO3 when the N2 atmosphere was changed to H2. However, little change in conductivity was observed for dense SrZrO3. The difference between these sample behaviours can be attributed to the difference in proton conduction at the surface.
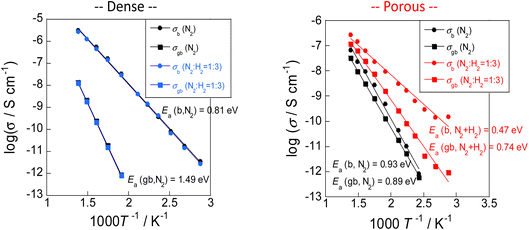 | ||
| Fig. 12 AC impedance measurements taken at various temperatures under N2 and H2 atmospheres.23 | ||
The conducted protons are thought to be generated by dissociative adsorption of hydrogen, triggered by the Pt electrodes. To investigate the contribution of adsorbed hydrogen to surface proton conduction, hydrogen partial pressure tests were performed on porous SrZrO3. Results show that the conductivity was positively correlated with the hydrogen partial pressure. These results suggest that the dominant conduction carriers under an N2 atmosphere are electrons in the bulk, and surface protons under an H2 atmosphere.
Subsequently, H/D isotope exchange tests were performed to confirm that the dominant conduction carrier in the H2 atmosphere is indeed a proton. Results show no isotope effect in dense SrZrO3, although a primary isotope effect was found in porous SrZrO3. These results indicate the occurrence of proton conduction on the oxide surface in an H2 atmosphere.23
Discussion
Computational chemistry study of the correlation between metal species and activity
When the reaction proceeds by the conventional dissociative mechanism, the order of activity is known to be determined by the dissociative adsorption enthalpy of N2.32,33 In conventional ammonia synthesis, because the structural form of the adsorbed species Nad is similar for each active metal, the Brønsted–Evans–Polanyi (BEP) rule equation shown in eqn (17) is applicable. As the active metal changes, the reaction enthalpy ΔH of N2 dissociation changes. The adsorption stability of Nad also changes.| ΔEa = E0 + αΔH | (17) |
However, the reaction mechanism changes when the electric field is applied. Then the reaction proceeds via the N2H intermediate. Correlation between the N2 dissociation energy and the TOF-s of the catalytic reaction upon heating, and the correlation when the electric field is applied are presented, respectively, in Fig. 13(a) and (b).36 By plotting the TOF-s of the catalytic reaction on heating against ΔE(N2 dissociation), a volcano-shaped curve is confirmed. This finding is consistent with previously reported behaviour of heterogeneous systems,32,33 confirming that the factor which determines the activity is the dissociation energy of N2. However, no correlation was found between the activity TOF-s and ΔE(N2 dissociation) when the electric field was applied. This apparent lack of correlation confirms that the N2 dissociation energy is not a factor that determines the activity when the electric field is applied. Next, the correlation between TOF-p and N2H formation energy “pseudo-ΔE (N2H formation)” is shown in Fig. 13(c).36 A linear relation was found between these two variables. A similar trend was also observed when other catalyst supports such as CeO2-based materials were used. These results indicate that the reaction mechanism is changed considerably by application of the electric field to the reaction, and indicate that the formation energy of the N2Had intermediate is a factor that determines the activity.
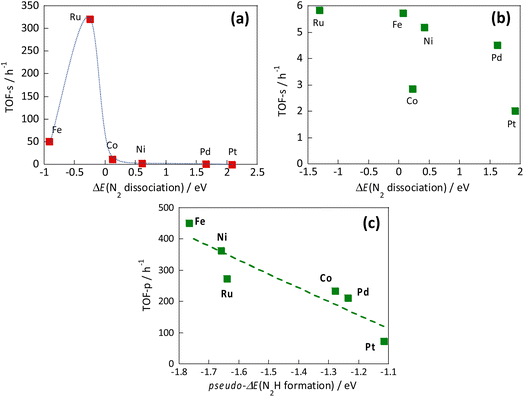 | ||
| Fig. 13 Correlation between the N2 dissociation energy and the TOF-s of the catalytic reaction upon heating (a), correlation when the electric field is applied (b), and correlation between N2H formation energy and TOF-p (c).36 | ||
Computational chemistry study of the correlation between catalyst support structure and activity
Next, the relation between the catalyst support structure and the rate of ammonia synthesis when the electric field is applied was examined using computational DFT calculations. Because formation of N2H intermediates is the rate-limiting step in the “associative mechanism” under the application of the electric field, the author surmised that the N2H formation energy is correlated with the reaction rate under application of the electric field. The author investigated effects of the catalyst support structure on ΔEN2H formation. The N2H intermediate is formed when N2 on the active metal accepts a proton supplied from the catalyst support surface. Based on the experimentally obtained results of the effect of the catalyst support structure described above, the author investigated effects of the structure of SrZrO3 and SrZrO3 doped with 12.5 mol% of different cations (Sr0.875Ba0.125ZrO3−δ, Sr0.875Ca0.125ZrO3−δ, SrZr0.875Y0.125O3−δ, SrZr0.875Ba0.125ZrO3−δ and SrZr0.875Al0.125O3−δ). Then correlation between ΔEN2H formation, ΔEN2H adsorption, and ΔEH adsorption was investigated based on computational chemistry. The results are portrayed in Fig. 14. Here, the circle size represents the N2H formation energy. When the N2H intermediate is formed more easily, the circle is smaller. The results indicate that the formation of N2H intermediates is more favourable when ΔEN2H adsorption is small and ΔEH adsorption is large, i.e., when N2H intermediates are stably adsorbed and their ability to donate hydrogen atoms is high. The results presented above show that doping Ba or Ca into SrZrO3 decreases the N2H production energy and increases the electric field ammonia synthesis rate. Moreover, they show that the N2H production energy dominates the electric field ammonia synthesis rate, which is determined by the stability of the N2H intermediate on Ru and by its ability to donate a proton from the catalyst support.38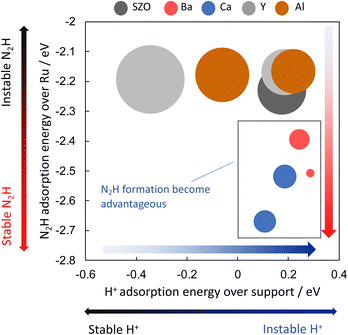 | ||
| Fig. 14 Correlation between ΔEN2H formation, ΔEN2H adsorption, and ΔEH adsorption by DFT.38 | ||
Experimental and computational chemistry have indicated that when perovskite-type oxides SrZrO3 are doped with Ba or Ca, the proton donation capacity increases when the electric field is applied. The rate of ammonia synthesis is enhanced. Therefore, details of the effects of different cation doping on the proton-donating capacity of the catalyst support were investigated using DFT calculations.
The hydrogen atom adsorption energies were calculated for Sr1−xBaxZrO3 (0 ≤ x ≤ 0.5) using DFT calculations. The results presented in Fig. 15 show that the hydrogen atom adsorption energy is large at x = 0.25, indicating that adsorption is unfavourable. The Bader charge analysis was then performed to elucidate effects of the Sr/Ba ratio on the electronic state of the lattice oxygen atoms. Results showed that the lattice oxygen atoms near Ba2+ on the x = 0.25 surface are electron-rich. In general, hydrogen atoms are adsorbed easily onto electron-poor oxygen atoms because the electrons of hydrogen atoms are easily transferred to oxygen atoms.39–41 Therefore, the adsorption of hydrogen atoms near Ba2+ on the electron-rich x = 0.25 surface is regarded as weak. The hydrogen atom donation ability from lattice oxygen to active metal is regarded as large. Furthermore, from the obtained DOS geometry, the positions of the valence band (derived from O2p) and the conduction band (derived from Zr4d) shifted toward the higher energy levels only for x = 0.25. This change is regarded as caused by local lattice distortion. Earlier reports have described that the energy levels of highly anisotropic d orbitals change with symmetry lowering in perovskite-type oxides (Jahn–Teller effect).42,43 Consequently, the adsorption of hydrogen atoms on Sr1−xBaxZrO3 (0.00 ≤ x ≤ 0.50) is governed by the local lattice distortion, which can be tuned by the Sr/Ba ratio.
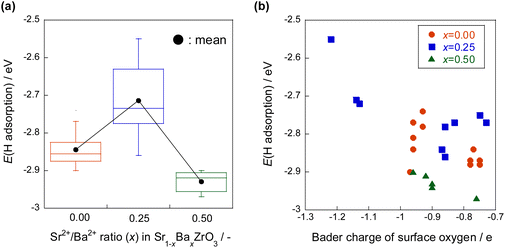 | ||
| Fig. 15 Hydrogen atom adsorption energies for Sr1−xBaxZrO3 (0 ≤ x ≤ 0.5) by DFT calculations, (a) the effect of Sr/Ba ratio, (b) the effect of Bader charge of surface oxygen.44 | ||
From DFT calculations, it was estimated that the Sr1−xBaxZrO3 support with x ≈ 0.25 has the highest proton-donating capacity, and that it exhibits a high electric field ammonia synthesis rate. Therefore, the ammonia synthesis rate under the electric field was measured using Ru/Sr1−xBaxZrO3 (0 ≤ x ≤ 0.5). The highest ammonia synthesis rate was observed at x = 0.2, which is consistent with DFT calculations indicating that a small amount of Ba doping improves the proton-donating ability of the catalyst. These results indicate that the catalytic performance of ammonia synthesis using surface proton conduction under the electric field can be controlled by doping different cationic species, and that the catalytic performance can be predicted using DFT calculations.44
Conclusions and future outlook
Consequently, in the ammonia synthesis in the electric-field catalytic reaction, the proton-conducting species on the support promote the formation of N2Had intermediates, indicating that the reaction mechanism has changed from the conventional one to a different one. This change in turn alters the factor determining activity from the N2 dissociation energy in conventional catalytic reactions to the N2H formation energy. Because of this difference, base metal catalysts such as Fe and Ni exhibit higher activity than catalysts using the noble metal Ru. Moreover, they are confirmed to have great potential as future catalysts for electric-field ammonia synthesis. If base metal catalysts reach the level where they can be used practically in a new ammonia synthesis process, then ammonia will become more cheaply producible as an energy carrier. Ammonia could then be used widely as a future energy carrier. The electric field catalytic reaction is expected to be useful for improving the efficiencies of various catalytic processes.Conflicts of interest
There are no conflicts to declare.Acknowledgements
This work was supported by JST-CREST and JST-MIRAI.Notes and references
- U. B. Demirci and P. Miele, Energy Environ. Sci., 2011, 4, 3334 RSC.
- H. Stoltze and J. K. Nerskiv, Phys. Rev. Lett., 1985, 55(22), 2502 CrossRef PubMed.
- C. J. H. Jacobsen, Chem. Commun., 2000, 12, 1057 RSC.
- G. Ertl, et al. , J. Catal., 1983, 79, 359 CrossRef CAS.
- K. Aika, et al. , J. Catal., 1972, 27, 424 CrossRef CAS.
- K. Aika, et al. , J. Catal., 1985, 92, 305 CrossRef CAS.
- O. Hinrichsen, Catal. Today, 1999, 53, 177 CrossRef CAS.
- F. Rosowski, et al. , Appl. Catal., A, 1997, 151, 443 CrossRef CAS.
- S. E. Siporin and R. J. Davis, J. Catal., 2004, 225, 359 CrossRef CAS.
- Z. Wang, et al. , Appl. Catal., A, 2013, 458, 130 CrossRef CAS.
- H. Bielawa, et al. , Angew. Chem., Int. Ed., 2001, 40, 1061 CrossRef CAS PubMed.
- K. Sato, et al. , Chem. Sci., 2017, 8, 674–679 RSC.
- M. Kitano, et al. , Nat. Chem., 2012, 4, 934 CrossRef CAS PubMed.
- M. Kitano, et al. , Nat. Commun., 2015, 6, 1 Search PubMed.
- M. Kitano, et al. , Chem. Sci., 2016, 7, 4036 RSC.
- Y. Inoue, et al. , ACS Catal., 2016, 6, 7577 CrossRef CAS.
- Y. Sekine and R. Manabe, Faraday Discuss., 2021, 229, 341–358 RSC.
- M. Torimoto, et al. , Bull. Chem. Soc. Jpn., 2019, 92(10), 1785–1792 CrossRef CAS.
- Y. Hisai, et al. , Chem. Commun., 2021, 57, 5737–5749 RSC.
- S. Ø. Stub, et al. , J. Phys. Chem. C, 2017, 121, 12817–12825 CrossRef CAS.
- S. Ø. Stub, et al. , J. Mater. Chem. A, 2018, 6, 8265–8270 RSC.
- R. Manabe, et al. , Solid State Commun., 2018, 270, 45–49 CrossRef CAS.
- Y. Hisai, et al. , Chem. Commun., 2020, 56, 2699–2702 RSC.
- T. Matsuda, et al. , Chem. Commun., 2022, 58, 10789–10792 RSC.
- G. Kresse and J. Hafner, Phys. Rev. B: Condens. Matter, 1993, 47, 558 CrossRef CAS PubMed.
- G. Kresse and J. Hafner, Phys. Rev. B: Condens. Matter, 1994, 49, 14251 CrossRef CAS PubMed.
- G. Kresse and J. Furthmüller, Comput. Mater. Sci., 1996, 6(1), 15–50 CrossRef CAS.
- G. Kresse and J. Furthmüller, Phys. Rev. B: Condens. Matter, 1996, 54, 11169 CrossRef CAS PubMed.
- G. Kresse and D. Joubert, Phys. Rev. B: Condens. Matter, 1999, 59(3), 1758 CrossRef CAS.
- R. Manabe, et al. , Chem. Sci., 2017, 8, 5434–5439 RSC.
- K. Murakami, et al. , Chem. Commun., 2020, 56, 3365–3368 RSC.
- S. Dahl, et al. , Appl. Catal., A, 2001, 222, 19–29 CrossRef CAS.
- C. J. Jacobsen, et al. , J. Mol. Catal. A: Chem., 2000, 163, 19–26 CrossRef CAS.
- A. Gondo, et al. , Catal. Lett., 2018, 148(7), 1929–1938 CrossRef CAS.
- H. J. T. Ellingham, et al. , J. Soc. Chem. Ind., 1994, 63, 125–133 Search PubMed.
- K. Murakami, et al. , Catal. Today, 2020, 351, 119–124 CrossRef CAS.
- S. Miyoshi, et al. , Chem. Mater., 2014, 26, 5194 CrossRef CAS.
- K. Murakami, et al. , J. Chem. Phys., 2019, 151, 064708 CrossRef.
- K. Murakami, et al. , Phys. Chem. Chem. Phys., 2021, 23, 4509 RSC.
- Z. Hu, et al. , J. Phys. Chem. C, 2011, 115, 3065 CrossRef CAS.
- E. W. McFarland and H. Metiu, Chem. Rev., 2013, 113, 4391 CrossRef CAS PubMed.
- J. A. Alonso, et al. , Inorg. Chem., 2000, 39, 917 CrossRef CAS PubMed.
- J. M. Rondinelli and N. A. Spaldi, Adv. Mater., 2011, 23, 3363 CrossRef CAS PubMed.
- Y. Tanaka, et al. , RSC Adv., 2021, 11, 7621 RSC.
| This journal is © The Royal Society of Chemistry 2023 |

