Synthesis of Pt3Zn1 and Pt1Zn1 intermetallic nanocatalysts for dehydrogenation of ethane†
Zhuoran
Gan
a,
Zheng
Lu
b,
Muntaseer
Bunian
a,
Larissa B.
Lagria
a,
Christopher L.
Marshall
b,
R. Michael
Banish
a,
Sungsik
Lee
c and
Yu
Lei
 *a
*a
aDepartment of Chemical and Materials Engineering, University of Alabama in Huntsville, Huntsville, AL 35899, USA. E-mail: yu.lei@uah.edu; Tel: +1-256-824-6527
bChemical Sciences and Engineering Division, Argonne National Laboratory, Lemont, IL 60439, USA
cX-ray Science Division, Advanced Photon Source, Argonne National Laboratory, Lemont, IL 60439, USA
First published on 1st February 2023
Abstract
Pt3Zn1 and Pt1Zn1 intermetallic nanoparticles supported on SiO2 were synthesized by combining atomic layer deposition (ALD) of ZnO, incipient wetness impregnation (IWI) of Pt, and appropriate hydrogen reduction. The formation of Pt1Zn1 and Pt3Zn1 intermetallic nanoparticles was observed by both X-ray diffraction (XRD) and synchrotron X-ray absorption spectroscopy (XAS). STEM images showed that the 2–3 nm Pt-based intermetallic nanoparticles were uniformly dispersed on a SiO2 support. The relationships between Pt–Zn intermetallic phases and synthesis conditions were established. In situ XAS measurements at Pt L3 and Zn K edges during hydrogen reduction provided a detailed image of surface species evolution. Owing to a combined electronic and geometric effect, Pt1Zn1 exhibited much higher reactivity and stability than Pt3Zn1 and Pt in both the direct dehydrogenation and oxidative dehydrogenation of ethane to ethylene reactions.
1. Introduction
Single-atom alloys (SAA) are a form of single-atom catalysts that consist of atomically dispersed active sites in a host metal.1 When the metal active sites and the host metal form a random alloy (i.e., solid solution), atomic dispersion can be achieved by maintaining a low density of active sites.2 High-density, monodispersed active sites can be achieved if the binary system forms an intermetallic phase.3 Intermetallic alloys are a type of bimetallic compound that forms a finite stoichiometry and ordered atomic structure which warrants uniform catalytic active sites. Although intermetallic catalysts exhibit greater active site density than the solid solution, the thermodynamically favored intermetallic phases could theoretically resist segregation under heat and chemical adsorption.4 These features make intermetallic catalysts attractive for applications in well-defined catalysis systems. A Pt–Sn intermetallic alloy is the most studied alloy system in the dehydrogenation of alkanes and has been commercialized.5 Adding a second metal to Pt can reduce the particle size thus effectively suppressing side reactions, for example, hydrogenolysis and coking.6 Various new Pt-based intermetallic nanocatalysts, such as Pt–Zn, Pt–In, and Pt–V, have demonstrated enhanced activity and selectivity in alkane dehydrogenation.7 However, the intrinsic contributions of these add-metals to Pt are still in question, due to the difficulties in the preparation of Pt-based intermetallic nanoparticles with a targeted crystal structure.8Pt–Zn intermetallic nanoparticles have exhibited excellent catalytic performance in electrooxidation,9 hydrogenation,10 and dehydrogenation.11 Catalytic dehydrogenation of light alkanes, such as ethane and propane, is an on-purpose production method that exclusively yields the desired alkene of polymer-quality purity rather than a mixture of products.12 Cybulskis and coworkers have shown that the intermetallic Pt1Zn1 nanoparticles are more active, selective, and stable than the un-promoted Pt nanoparticles in the dehydrogenation of ethane.7a They ascribed the improved performance to both electronic and geometric effects. Nevertheless, how exactly these two factors affect the ethane dehydrogenation activity, selectivity, and stability were not well established with the limited examples of Pt1Zn1 and metallic Pt. Also, as their work and many recent studies on alkane dehydrogenation using PtZn nanocatalysts11,13 focused on more characterization on the Pt side, the information on the changes of Zn species was lacking, this might overlook some important aspects for the successful synthesis of active phases. The Pt1Zn1 catalyst they prepared utilized incipient wetness impregnation, a relatively rapid method widely used in catalyst synthesis. However, this method is known to produce nanoparticles with broad size distribution. A controlled synthesis method may offer a well-defined catalyst system to establish precise structure and performance relationships.
Chemical methods used to synthesize intermetallic alloy nanoparticles include impregnation, colloidal synthesis, and chemical vapor deposition. Atomic layer deposition (ALD) has emerged as an important technique for thin film deposition.14 It produces conformal coatings of materials via self-limiting chemical reactions between the precursors. By controlling ALD parameters such as dose time, the number of cycles, and deposition temperature, we can quantitatively design catalysts with the desired thickness, loading, and microstructures. ZnO ALD, as one of the well-developed ALD processes,15 can potentially aid in the design of mono-dispersed nanoscale Pt–Zn intermetallic alloys, such as Pt3Zn1, Pt1Zn1, Pt3Zn10, Pt1Zn8, etc.,16 which will provide more information regarding Pt site isolation and electronic states with the addition of Zn.
Herein, we synthesized silica-supported Pt3Zn1 and Pt1Zn1 intermetallic nanocatalysts by sequential deposition of ZnO via atomic layer deposition (ALD) and Pt via incipient wetness impregnation (IWI) on SiO2 with H2 reduction. The synthesis method was examined using standard characterization techniques as well as synchrotron X-ray absorption spectroscopy (XAS) under hydrogen reduction conditions. We revealed that ZnO reduction is a key step in the synthesis of the Pt1Zn1 phase by providing a detailed picture of Pt and Zn speciation kinetics under H2 reduction via in situ XAS. Silica-supported Pt3Zn1, Pt1Zn1, and Pt monometallic nanocatalysts were tested in both dehydrogenation of ethane (DHE) and oxidative dehydrogenation of ethane (ODHE), and the electronic and geometric effects on the catalytic performance of PtZn intermetallic nanocatalysts are discussed thoroughly. The Pt1Zn1 intermetallic nanocatalysts exhibited improved selectivity and a production rate one order of magnitude greater than those of supported Pt and Pt3Zn1 with similar Pt loading and particle sizes for the dehydrogenation of ethane. Enhanced catalyst stability was also observed.
2. Experimental section
2.1 Synthesis
2.2 Characterization
The thickness of the ZnO film deposited onto the Si(100) wafer was determined by spectroscopic ellipsometry (SE) using a J. A. Woollam alpha-SE variable angle spectroscopic ellipsometer. X-ray Diffraction (XRD) was performed on a Rigaku MiniFlex 600 powder X-ray diffractometer operated at 40 kV and 15 mA. XRD patterns were scanned from 2θ = 10° to 90° with a scanning speed of 1° min−1. Brunauer–Emmett–Teller (BET) surface area measurements were performed using a gas sorption analyzer (Autosorb iQ, Quantachrome Instruments) at 77 K. In a typical experiment, the sample was outgassed at 350 °C for 10 h. The specific surface area was calculated using the Brunauer–Emmett–Teller (BET) method and the pore volume and size were obtained using the Barrett–Joyner–Halenda (BJH) method. Pt dispersions based on H2 chemisorption were also estimated using the Autosorp iQ gas sorption analyzer. All samples were heated in situ to 600 °C, held for 2 h under H2 (Airgas, 99.999%), and evacuated for 2 h before cooling to 40 °C for chemisorption. The STEM images were taken at the Center for Nanoscale Materials within the Argonne National Laboratory using a FEI Talos scanning transmission electron microscope. A TEM grid was first mixed with the sample inside a vial by shaking rigorously. Images were then taken using a high-angle annular dark-field (HAADF) detector at 300 kV. The energy-dispersive X-ray (EDX) spectra of the catalysts were taken using a JEOL 2100 TEM equipped with a Gatan camera at an accelerating voltage of 200 kV. Inductively coupled plasma optical emission spectroscopy (ICP-OES) was carried out using an Agilent 5110 SVDV ICP-OES spectrometer.X-ray absorption spectroscopy (XAS) measurements were conducted at 12-BM of the Advanced Photon Source (APS) at the Argonne National Laboratory. Transmission mode spectra were taken at the Pt L3 edge (∼11![[thin space (1/6-em)]](https://www.rsc.org/images/entities/char_2009.gif) 564 eV) and the Zn K edge (∼9659 eV). For the ex situ measurements, Pt/SiO2, Pt1Zn1/SiO2, and Pt3Zn1/SiO2 samples were first reduced in 3.5% H2 with balance He at 600 °C for 30 min to remove any surface oxides which formed due to sample transfer. The samples were then cooled and measured in helium at RT. For the in situ XAS study, the Pt/ZnO/SiO2 precatalyst was reduced by 3.5% H2/He at the designated temperature for 15 min and then measured at RT under helium protection. The XANES linear combination fittings were processed from Athena in the normalized μ(E) space, with Pt metal foil and PtO2 used as references. The fittings were done in the range of 10 eV below and 40 eV above the Pt L3 edge. EXAFS regime data fittings were performed using Artemis in the IFEFFIT software package.
564 eV) and the Zn K edge (∼9659 eV). For the ex situ measurements, Pt/SiO2, Pt1Zn1/SiO2, and Pt3Zn1/SiO2 samples were first reduced in 3.5% H2 with balance He at 600 °C for 30 min to remove any surface oxides which formed due to sample transfer. The samples were then cooled and measured in helium at RT. For the in situ XAS study, the Pt/ZnO/SiO2 precatalyst was reduced by 3.5% H2/He at the designated temperature for 15 min and then measured at RT under helium protection. The XANES linear combination fittings were processed from Athena in the normalized μ(E) space, with Pt metal foil and PtO2 used as references. The fittings were done in the range of 10 eV below and 40 eV above the Pt L3 edge. EXAFS regime data fittings were performed using Artemis in the IFEFFIT software package.
2.3 Catalytic performance
Direct dehydrogenation of ethane (DHE) and oxidative dehydrogenation of ethane (ODHE) were carried out in a quartz tube reactor (10 mm I.D.) at 550 °C under atmospheric pressure. The quartz tube was placed in an electric furnace and sealed with Ultra Torr fittings. A K-type thermocouple was used to measure the temperature of the catalyst bed. The catalyst particles sieved between 180 to 250 μm were mixed with 500 mg 60/80 mesh quartz chips. For DHE, the catalyst weight is fixed at 100 mg to achieve a weight hourly space velocity (WHSV) of 7.2 h−1. The reactant feed used in DHE was composed of 18% C2H6 (Matheson, 99.99%) and 82% He (nexAir, 99.999%), for a total flow of 50 mL min−1. For ODHE, the reactant feed contained 22.3% ethane and 1.7% oxygen with balance helium. Due to the rapid deactivation in ODHE, various amounts of catalysts were used to achieve ∼10% initial conversion. The amount used for Pt, Pt1Zn1, and Pt3Zn1 were 250 mg, 10 mg, and 90 mg, respectively. The effluent line was heated to temperatures above 80 °C to prevent condensation of byproducts. Before each reaction, the catalyst was reduced by 5% H2/He at 600 °C for 30 min. The effluents were analyzed on a gas chromatograph (SRI, 310C) equipped with a ShinCarbon ST column and a thermal conductivity detector (TCD).3. Results and discussion
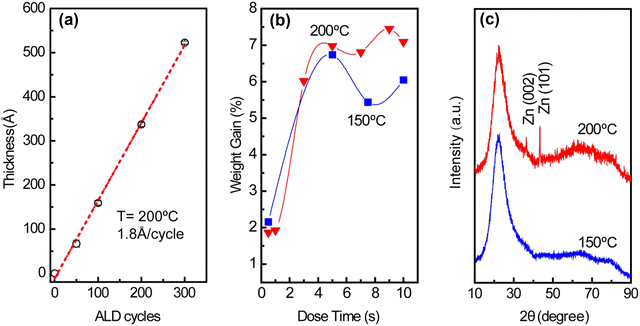
Uniform ZnO thin films formed on SiO2 support via atomic layer deposition acted as the source of Zn for the preparation of nano-sized Pt–Zn intermetallic alloys. As shown in Fig. 1(a), the linear growth behavior of ZnO thin films yielded a growth per cycle (GPC) of ∼1.8 Å per cycle. This growth rate is consistent with the 1.5–1.9 Å per cycle range within the 50–300 °C temperature range found in the literature.17 The saturation exposure of DEZ for deposition of ZnO on high surface area SiO2 powder was determined by varying the DEZ exposure time from 0.5 to 10 s, as shown in Fig. 1(b). The saturation weight gain was ∼7 wt% when the dose time of DEZ reached 5 s (∼6.7 wt% at 150 °C, ∼7.0 wt% at 200 °C). The formation of metallic Zn within the thin films was observed at 200 °C (Fig. 1(c)). This incorporation of metallic Zn was likely due to the thermal decomposition of DEZ on the substrate,18 but the saturation weight gain suggests that the nature of the ZnO growth was within the ALD regime.19 Based on the surface area of SiO2 and the density of ZnO, the theoretical saturated weight gain is calculated to be ∼9.7 wt%. The weight gain is lower than expected, which indicates that ZnO ALD precursors cannot access the entire surface of SiO2 due to steric hindrance.15 The time sequence of 5-200–37.5-200 s and deposition temperature of 200 °C were used to prepare ZnO/SiO2. Pt nanoparticles were subsequently deposited on the ZnO-covered SiO2 surface via incipient wetness impregnation (IWI).The Pt–Zn intermetallic phases were generated by reducing Pt/ZnO/SiO2 in hydrogen. The optimal reduction temperature was determined by varying the temperature between 600 °C and 800 °C, while the optimal reduction time was determined by varying the length of time at which Pt/ZnO/SiO2 was reduced, from 15 min to 10 h, as shown in Fig. S1 (ESI†). The best preparation conditions to generate Pt1Zn1 and Pt3Zn1 phases were determined to be 6 h reduction at 600 °C and 8 h reduction at 800 °C, respectively. The stoichiometry of the as-prepared Pt1Zn1 and Pt3Zn1 intermetallics were confirmed using EDX (Fig. S2, ESI†) and ICP-OES. Fig. 2(a) shows that the shape of the XRD pattern of Pt3Zn1 (JCPDS no. 65-3257) resembles that of the monometallic Pt phase (JCPDS no. 65-2868) but the peaks are positioned at higher diffraction angles, as shown in the detailed scans in Fig. 2(b) and (c). The shifts in peak location in the Pt3Zn1 XRD pattern are evidence that Zn has been incorporated into Pt's face-centered cubic (FCC) structure since Zn has a smaller atomic radius.20 Based on the XRD patterns, the lattice parameters are calculated to be 3.92 Å for FCC Pt and 3.89 Å for the L12 Pt3Zn1, respectively, and 4.03 Å and 3.49 Å for the a and c unit vectors, respectively, of the AuCu L10 tetragonal structured Pt1Zn1 (JCPDS no. 06-0604). The Pt–Pt bond distance for Pt/SiO2, Pt3Zn1/SiO2, and Pt1Zn1/SiO2 nanoparticles are calculated to be 2.77 Å, 2.75 Å, and 2.85 Å (Table S1, ESI†), respectively, which are similar to literature values.7a,9c,21
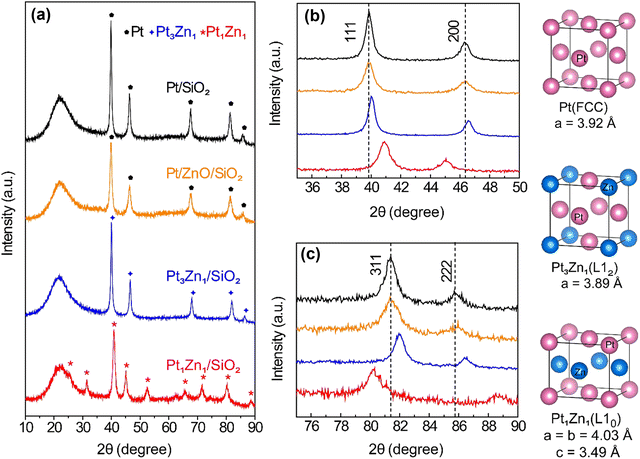 | ||
| Fig. 2 (a) XRD patterns of Pt/SiO2, pre-catalyst Pt/ZnO/SiO2, Pt3Zn1/SiO2 and Pt1Zn1/SiO2. Detailed scans of XRD patterns of the four samples between (b) 35–50° and (c) 75–90°. | ||
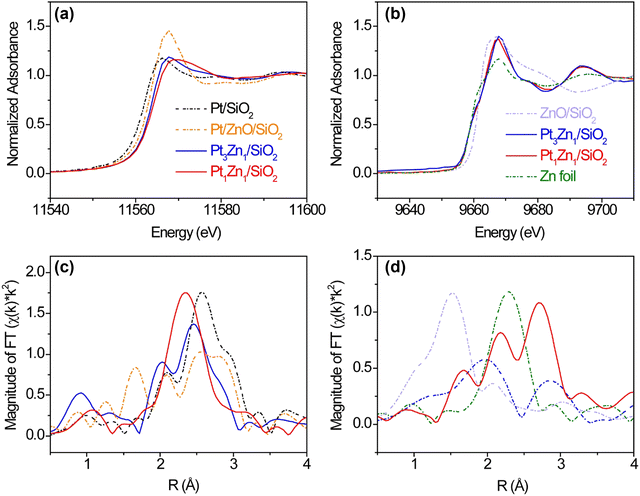
The formation of Pt–Zn intermetallic alloys was further investigated using XAS measurements at Pt L3 (11.564 keV) and Zn K (9.659 keV) edges. Prior to carrying out XAS measurements, the Pt-containing samples were reduced by 3.5% hydrogen at 600 °C for 30 min to remove any surface oxides that formed due to sample transfer. As compared with the Pt L3 XANES spectrum of Pt/SiO2, the whiteline intensities (2p → 5d transition) of Pt3Zn1/SiO2 and Pt1Zn1/SiO2 remain nearly the same but their edge positions shift to higher photon energies by 1.5 and 2.4 eV, respectively. These positive shifts indicate changes in hybridization and lower 5d electronic density (Fig. 3(a)).7a,21,22 At the Zn K-edge, whitelines of Pt3Zn1/SiO2 and Pt1Zn1/SiO2 do not show obvious shifts as compared with metallic Zn, but their intensities are higher (Fig. 3(c)). This feature, corresponding to the 1s → 4p transition, is sensitive to the change of coordination of Zn and bond distance due to the formation of the Pt–Zn intermetallic phase.23
The Pt L3 edge EXAFS spectrum of Pt/ZnO/SiO2 in Fig. 3(b) shows a Pt–O peak at ∼ 1.7 Å and three peaks between 2 Å and 3 Å, indicating the Pt was partially oxidized. The EXAFS spectrum of Pt1Zn1 shows a Pt–Zn single peak at ∼2.4 Å (uncorrected) while the Pt3Zn1 spectrum contains a cluster of three peaks between 2 Å and 3 Å resembling that of Pt owing to their similar crystalline structure. Data fitting in Table S2 and Fig. S3 (ESI†) shows that each Pt atom on Pt/SiO2 has an average of 10.5 nearest neighbors at a bond distance of 2.76 Å. With the incorporation of Zn, the number of nearest Pt neighbors surrounding one Pt atom in Pt3Zn1/SiO2 decreases to 6.1 and the Pt–Pt bond distance is shortened to 2.73 Å. In Pt1Zn1 nanoparticles, the Pt–Pt bond distance is elongated to 2.85 Å and each Pt atom has an average of 3.1 nearest Pt neighbors, indicating that these Pt atoms were structurally more isolated. The bond distances determined by EXAFS data fittings are comparable to those obtained from XRD patterns. In the Zn K edge EXAFS spectra (Fig. 3(d)) and data fitting (Table S3 and Fig. S4, ESI†), ZnO and Zn have single peaks at ∼1.5 Å (Zn–O) and 2.3 Å (Zn–Zn), respectively. In the bulk structure of metallic Zn, each Zn atom has 6 Zn neighbors, with a bond distance of 2.64 Å between atoms. The Zn–Pt bond distances in Pt3Zn1 and Pt1Zn1 are 2.73 Å and 2.65 Å, respectively, consistent with the bond distances derived from Pt L3 EXAFS data fitting (Table S2, ESI†) and XRD patterns (Table S1, ESI†).
Fig. 4 shows the STEM images and particle size distribution histograms of Pt/SiO2, Pt3Zn1/SiO2, and Pt1Zn1/SiO2. The nanoparticles were well dispersed on the SiO2 support. The particle size distribution, calculated for more than 500 nanoparticles, demonstrates that the average diameter of Pt/SiO2, Pt1Zn1/SiO2, and Pt3Zn1/SiO2 nanoparticles are all about 2.2 nm. In the EDX mapping, all Pt and Zn co-locate at the same spots, suggesting a homogeneous formation of Pt–Zn alloys.
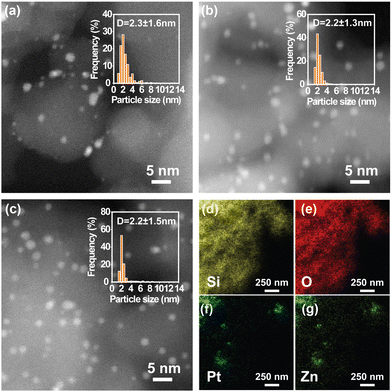 | ||
| Fig. 4 (a) and (b) HAADF-STEM images and particle size distribution histograms of (a) Pt/SiO2, (b) Pt3Zn1/SiO2, (c) Pt1Zn1/SiO2, and (d)–(g) EDX mapping of Pt1Zn1/SiO2. | ||
In situ XAS spectra at Pt L3 and Zn K edge were measured during hydrogen reduction to determine the surface species evolution. The measurements were obtained by quickly switching between Pt L3 and Zn K edges (<1 min), and thus the data on both edges were taken almost simultaneously. Fig. 5 shows the XANES and EXAFS spectra at Pt L3 and Zn K edges during reduction of Pt/ZnO/SiO2 from 25 °C to 800 °C. The in situ XAS spectra clearly show the transition from the initial oxidation state to the final intermetallic phase. In Fig. 5(a) and (b), the Pt L3 edge whiteline gradually shifts to a higher energy, accompanied by the shift of Zn K edge to a lower energy. In the EXAFS spectra in Fig. 5(c) and (d), Pt–Zn bonds arise with the elimination of Pt–O and Zn–O bonds. The quantitative changes to an atom's nearest neighbors and the associated bond distance with respect to Pt and Zn are summarized in Tables S4 and S5 (ESI†), and the fitting quality is shown in Fig. S5–S8 (ESI†).
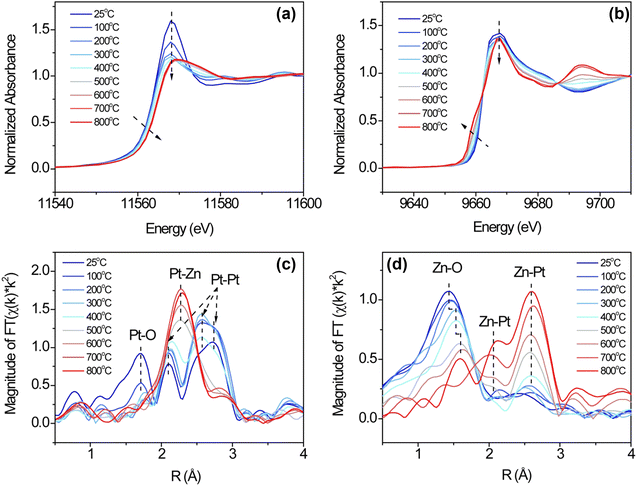 | ||
| Fig. 5 Pt L3 edge (a) XANES, (b) EXAFS Fourier transform of Pt/ZnO/SiO2 during in situ hydrogen reduction at elevated temperatures and their Zn K edge XANES (e) and (d) EXAFS counterparts. | ||
XANES linear combination fittings (LCF, Fig. 6) are consistent with the EXAFS fittings summarized in Tables S4 and S5 (ESI†). The as-prepared Pt/ZnO/SiO2 sample was initially partially oxidized, containing 69% metallic Pt and 31% PtO2, while all the zinc was in the form of ZnO. PtO2 was completely reduced to the metallic state at 200 °C, coinciding with the formation of the Pt–Zn phase and conforming to previous studies on hydrogen reduction of Pt/ZnO/Al2O3 and Pd/ZnO.24 The hydrogen reduction was likely catalyzed by platinum, which was able to reduce Zn at such a low temperature. Upon increasing temperature from 200 °C to 600 °C, more Pt–Zn phase formed as more ZnO was reduced. The formation of Pt1Zn1 seems to be limited by the catalytic reduction rate of ZnO instead of Zn atom diffusion into Pt. At 600 °C, all platinum existed in the form of Pt1Zn1 phase while excess ZnO remained. The excess ZnO could be removed by long reduction or vaporization at higher temperature, i.e., 800 °C. Note that it was still in the Pt1Zn1 phase as it took 8 hours at 800 °C to form the Pt3Zn1 phase (Fig. S1b, ESI†).
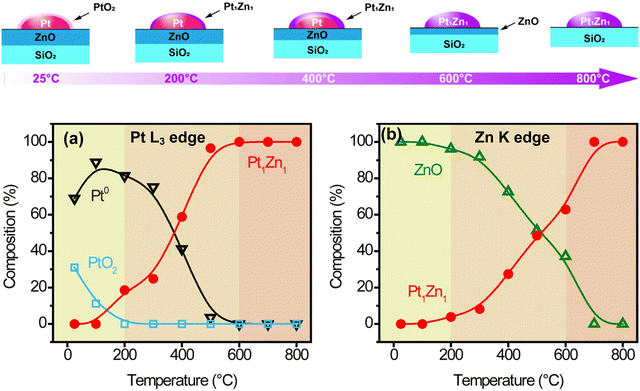 | ||
| Fig. 6 (a) Scheme of surface species evolution, and XANES linear combination fitting (LCF) of (b) Pt L3 and (c) Zn K edges. | ||
There are three main concerns regarding the reduction of the Pt/ZnO/SiO2 sample to Pt3Zn1/SiO2 at 800 °C in hydrogen. The first concern is the possible collapse of the porous SiO2 support, which will cause a close encapsulation of platinum and prevent reactants from accessing the catalyst's active sites. The second concern is the occurrence of sintering of platinum nanoparticles due to diffusion-coalescence at high temperatures and a hydrogen environment, again leading to the loss of active sites for catalytic reactions. The last concern is the potential formation of the Pt–Si phase induced by platinum-catalyzed SiO2 reduction. The latter two concerns were observed in an in situ TEM study of Pt/SiO2 reduction at 800 °C in hydrogen.25 The diameter of Pt nanoparticles increased from 2 nm to 4.8 nm, which is associated with the formation of Pt3Si after being reduced in hydrogen at 800 °C. In our study, these three concerns were ruled out as evidenced by combining BET surface area analysis, XRD patterns, and EXAFS spectra. As shown in Fig. S9 and Table S6 (ESI†), the surface area, pore diameter, and pore volume are consistent between Pt/ZnO/SiO2, Pt1Zn1/SiO2, and Pt3Zn1/SiO2, indicating that the structural integrity of SiO2 support was maintained. Neither any Pt–Si phase was observed in XRD patterns, nor was Pt–Si present in the EXAFS spectra. As the SiO2 support was uniformly covered by ZnO deposited by ALD, it may have prevented the contact between Pt and SiO2 and the possible subsequent formation of Pt3Si.
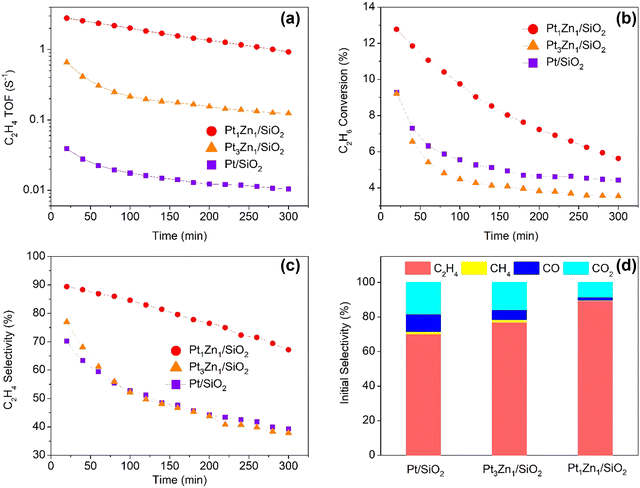
The dehydrogenation of ethane reaction at 550 °C with a WHSV of 7.2 h−1 was used to evaluate the catalytic performance of the Pt–Zn intermetallic nanoparticles. Catalytic performance results are shown in Fig. 7. Based on the Pt dispersion (Table S6, ESI†), the initial ethylene turnover frequency (TOF), normalized per surface Pt was 0.56 s−1 for Pt1Zn1/SiO2, much higher than the Pt-rich Pt3Zn1/SiO2 (0.48 s−1) and the monometallic Pt/SiO2 (0.04 s−1). Although all three catalysts had close to 100% C2H4 selectivity, the Pt1Zn1 catalyst exhibited significantly improved stability. The Pt1Zn1 catalyst maintained at a higher conversion (∼24.5%) during the reaction period as compared to the Pt3Zn1 whose conversion rapidly decreased from 7% to 1.7%.
As shown in Fig. 8, the Pt1Zn1 catalysts also exhibited the best performance in terms of C2H4 TOFs, conversion, and selectivity in the ODHE. The time-on-stream catalytic tests demonstrate that Pt/SiO2 has an initial C2H4 TOF of 0.04 s−1 and a C2H4 selectivity of 70.2%, and the selectivity decays rather quickly during the first hour, with 39.3% left after 5 h. The Pt-rich Pt3Zn1/SiO2 exhibited better initial C2H4 TOF (0.66 s−1) and selectivity (77%) as compared to Pt/SiO2, but after 2 h the selectivity drops steeply and almost follows the decay path of Pt/SiO2. Pt1Zn1/SiO2 shows not only improved initial C2H4 TOF (2.79 s−1, 70 times higher than Pt/SiO2) and C2H4 selectivity (89.4%), but also more stable. Its selectivity did not show a drastic decrease and remained at 67.2% after 5 h. It is shown in Fig. 8d that the main by-products for ODHE are CO, CO2, and CH4, the CO plus CO2 initial selectivity for Pt/SiO2 is the highest, revealing that Pt monometallic is favorable for the combustion reaction path.
The improved performance may be caused by the combined electronic and geometry effects due to the presence of Zn in Pt.7a,24a Cybulskis observed that Pt1Zn1/SiO2 was more active and stable than Pt/SiO2 in dehydrogenation of ethane. By using density functional theory (DFT) calculations and synchrotron resonant inelastic X-ray spectroscopy (RIXS), they attributed the improvement to the electronic effect where the structure of Pt 5d valence orbitals changed due to the presence of Zn. Our studies by including the performance of an additional Pt3Zn1/SiO2 intermetallic catalysts support their conclusion. The improved performance of Pt1Zn1/SiO2 is more likely due to a combined electronic and geometric effect. In other words, the electronic states of Pt 5d are changed by adding the Zn element. As shown by XANES in Fig. 3(a), the Pt L3 edge position of Pt1Zn1 and Pt3Zn1 shifted to higher energy by 2.4 eV and 1.5 eV, respectively, compared with Pt monometallic. Those shifts in edge energy reflect an upward shift of unfilled Pt 5d bands, which also cause a downward shift of filled 5d bands. These energy changes are related to the bonding of Pt and the adsorbate, which in turn affects the catalytic turnover on the Pt active site. These results are consistent with the initial performance of the catalyst in the order of Pt1Zn1 > Pt3Zn1 > Pt/SiO2 in both DHE and ODHE reactions. Regarding the geometric effect, the Pt atoms are atomically more isolated in Pt1Zn1 (CNPt–Pt = 3.1, RPt–Pt = 2.85 Å) than in either Pt3Zn1 (CNPt–Pt = 6.1, RPt–Pt = 2.73 Å) or Pt (CNPt–Pt = 10.5, RPt–Pt = 2.76 Å). The C2H4 TOF for both DHE and ODHE are compared with those state-of-the-art Pt-based catalysts from the literature (Tables S7 and S8, ESI†), Pt1Zn1/SiO2 shows comparable or enhanced C2H4 TOF with other Pt–Zn or Pt–Sn nanocatalysts, considering our reaction temperature and space velocity. The more isolated Pt in Pt1Zn1 may be responsible for the improved catalyst stability as it slows the coke deposition. The use of intermetallic alloys could be a promising approach to synthesize well-defined, atomically dispersed catalysts.
4. Conclusions
Pt1Zn1/SiO2 and Pt3Zn1/SiO2 intermetallic nanocatalysts were synthesized by sequential deposition of ZnO (by ALD) and Pt (by IWI) on a SiO2 support, followed by hydrogen reduction with suitable temperature and length of time. In particular, the hydrogen reduction of Pt/ZnO/SiO2 was investigated using in situ synchrotron X-ray absorption spectroscopy at both Pt L3 and Zn K edges. The Pt1Zn1 intermetallic phase was formed at temperatures as low as 200 °C by the platinum catalyzed reduction. The formation rate of Pt1Zn1 was controlled by the ZnO reduction, not by diffusion of the metallic Zn into Pt. All Pt was completely in the Pt1Zn1 phase at 600 °C while excess ZnO still existed on the support. A higher temperature (at 800 °C for 15 min) or longer reduction time (at 600 °C for 6 h) is necessary to remove the excess ZnO and reach the Pt![[thin space (1/6-em)]](https://www.rsc.org/images/entities/char_2009.gif) :
:![[thin space (1/6-em)]](https://www.rsc.org/images/entities/char_2009.gif) Zn = 1
Zn = 1![[thin space (1/6-em)]](https://www.rsc.org/images/entities/char_2009.gif) :
:![[thin space (1/6-em)]](https://www.rsc.org/images/entities/char_2009.gif) 1 stoichiometry on the surface. Further reduction at 800 °C for 8 h will result in the Pt3Zn1 phase.
1 stoichiometry on the surface. Further reduction at 800 °C for 8 h will result in the Pt3Zn1 phase.
Pt1Zn1/SiO2 exhibited an ethylene TOF much higher than those of Pt3Zn1/SiO2 and Pt/SiO2 in direct dehydrogenation and oxidative hydrogenation of ethane to ethylene. The Pt1Zn1/SiO2 catalysts also exhibited considerably enhanced stability. The presence of Zn in Pt–Zn intermetallic alloys leads to both electronic structure and geometric structure changes of Pt. The electronic structure of Pt 5d orbitals, which concerns and influences the nanoparticle's catalytic properties, is similar in both Pt1Zn1 and Pt3Zn1, as determined by the Pt L3 XAS spectra. This may explain the initial high TOF of both catalysts as compared to the Pt catalyst. The improved stability of Pt1Zn1 is likely associated with the geometric effect, as the Pt atoms in Pt1Zn1 are significantly more atomically isolated than the Pt atoms in Pt3Zn1 and Pt.
Conflicts of interest
There are no conflicts of interest to declare.Acknowledgements
This work is sponsored by the American Chemical Society Petroleum Research Fund (56197-DNI5). Z. G. gratefully acknowledges a fellowship from the Alabama EPSCoR Graduate Research Scholars Program. This research used resources of the Advanced Photon Source, a U.S. Department of Energy (DOE) Office of Science User Facility, operated for the DOE Office of Science by Argonne National Laboratory under contract no. DE-AC02-06CH11357.References
- G. Giannakakis, M. Flytzani-Stephanopoulos and E. C. H. Sykes, Single-Atom Alloys as a Reductionist Approach to the Rational Design of Heterogeneous Catalysts, Acc. Chem. Res., 2019, 52(1), 237–247 CrossRef CAS PubMed
.
-
(a) X. Zhang, G. Cui, H. Feng, L. Chen, H. Wang, B. Wang, X. Zhang, L. Zheng, S. Hong and M. Wei, Platinum–copper single atom alloy catalysts with high performance towards glycerol hydrogenolysis, Nat. Commun., 2019, 10(1), 5812 CrossRef CAS PubMed
; (b) P. Aich, H. Wei, B. Basan, A. J. Kropf, N. M. Schweitzer, C. L. Marshall, J. T. Miller and R. Meyer, Single-Atom Alloy Pd–Ag Catalyst for Selective Hydrogenation of Acrolein, J. Phys. Chem. C, 2015, 119(32), 18140–18148 CrossRef CAS
; (c) J. Liu, F. R. Lucci, M. Yang, S. Lee, M. D. Marcinkowski, A. J. Therrien, C. T. Williams, E. C. H. Sykes and M. Flytzani-Stephanopoulos, Tackling CO Poisoning with Single-Atom Alloy Catalysts, J. Am. Chem. Soc., 2016, 138(20), 6396–6399 CrossRef CAS PubMed
.
-
(a) S. Furukawa and T. Komatsu, Intermetallic Compounds: Promising Inorganic Materials for Well-Structured and Electronically Modified Reaction Environments for Efficient Catalysis, ACS Catal., 2017, 7(1), 735–765 CrossRef CAS
; (b) A. Dasgupta and R. M. Rioux, Intermetallics in catalysis: An exciting subset of multimetallic catalysts, Catal. Today, 2019, 330, 2–15 CrossRef CAS
.
-
(a) R. J. Meyer, Q. Zhang, A. Kryczka, C. Gomez and R. Todorovic, Perturbation of Reactivity with Geometry: How Far Can We Go?, ACS Catal., 2018, 8(1), 566–570 CrossRef CAS
; (b) K. Kovnir, M. Armbrüster, D. Teschner, T. V. Venkov, F. C. Jentoft, A. Knop-Gericke, Y. Grin and R. Schlögl, A new approach to well-defined, stable and site-isolated catalysts, Sci. Technol. Adv. Mater., 2007, 8(5), 420–427 CrossRef CAS
.
-
(a) H. N. Pham, J. J. Sattler, B. M. Weckhuysen and A. K. Datye, Role of Sn in the Regeneration of Pt/gamma-Al(2)O(3) Light Alkane Dehydrogenation Catalysts, ACS Catal., 2016, 6(4), 2257–2264 CrossRef CAS PubMed
; (b) N. Kaylor and R. J. Davis, Propane dehydrogenation over supported Pt–Sn nanoparticles, J. Catal., 2018, 367, 181–193 CrossRef CAS
.
- J. J. H. B. Sattler, J. Ruiz-Martinez, E. Santillan-Jimenez and B. M. Weckhuysen, Catalytic Dehydrogenation of Light Alkanes on Metals and Metal Oxides, Chem. Rev., 2014, 114(20), 10613–10653 CrossRef CAS PubMed
.
-
(a) V. J. Cybulskis, B. C. Bukowski, H.-T. Tseng, J. R. Gallagher, Z. Wu, E. Wegener, A. J. Kropf, B. Ravel, F. H. Ribeiro, J. Greeley and J. T. Miller, Zinc Promotion of Platinum for Catalytic Light Alkane Dehydrogenation: Insights into Geometric and Electronic Effects, ACS Catal., 2017, 7(6), 4173–4181 CrossRef CAS
; (b) E. C. Wegener, Z. Wu, H.-T. Tseng, J. R. Gallagher, Y. Ren, R. E. Diaz, F. H. Ribeiro and J. T. Miller, Structure and reactivity of Pt–In intermetallic alloy nanoparticles: Highly selective catalysts for ethane dehydrogenation, Catal. Today, 2018, 299, 146–153 CrossRef CAS
; (c) S. C. Purdy, P. Ghanekar, G. Mitchell, A. J. Kropf, D. Y. Zemlyanov, Y. Ren, F. Ribeiro, W. N. Delgass, J. Greeley and J. T. Miller, Origin of Electronic Modification of Platinum in a Pt3V Alloy and Its Consequences for Propane Dehydrogenation Catalysis, ACS Appl. Energy Mater., 2020, 3(2), 1410–1422 CrossRef CAS
.
- C. Ye, M. Peng, Y. Wang, N. Zhang, D. Wang, M. Jiao and J. T. Miller, Surface Hexagonal Pt1Sn1 Intermetallic on Pt Nanoparticles for Selective Propane Dehydrogenation, ACS Appl. Mater. Interfaces, 2020, 12(23), 25903–25909 CrossRef CAS PubMed
.
-
(a) Z. Qi, C. Xiao, C. Liu, T. W. Goh, L. Zhou, R. Maligal-Ganesh, Y. Pei, X. Li, L. A. Curtiss and W. Huang, Sub-4 nm PtZn Intermetallic Nanoparticles for Enhanced Mass and Specific Activities in Catalytic Electrooxidation Reaction, J. Am. Chem. Soc., 2017, 139(13), 4762–4768 CrossRef CAS PubMed
; (b) Q. Chen, J. Zhang, Y. Jia, Z. Jiang, Z. Xie and L. Zheng, Wet chemical synthesis of intermetallic Pt3Zn nanocrystals via weak reduction reaction together with UPD process and their excellent electrocatalytic performances, Nanoscale, 2014, 6(12), 7019–7024 RSC
; (c) Y. Kang, J. B. Pyo, X. Ye, T. R. Gordon and C. B. Murray, Synthesis, Shape Control, and Methanol Electro-oxidation Properties of Pt–Zn Alloy and Pt3Zn Intermetallic Nanocrystals, ACS Nano, 2012, 6(6), 5642–5647 CrossRef CAS PubMed
; (d) A. Miura, H. Wang, B. M. Leonard, H. D. Abruña and F. J. DiSalvo, Synthesis of Intermetallic PtZn Nanoparticles by Reaction of Pt Nanoparticles with Zn Vapor and Their Application as Fuel Cell Catalysts, Chem. Mater., 2009, 21(13), 2661–2667 CrossRef CAS
.
- S. Iihama, S. Furukawa and T. Komatsu, Efficient Catalytic System for Chemoselective Hydrogenation of Halonitrobenzene to Haloaniline Using PtZn Intermetallic Compound, ACS Catal., 2016, 6(2), 742–746 CrossRef CAS
.
- J. Camacho-Bunquin, M. S. Ferrandon, H. Sohn, A. J. Kropf, C. Yang, J. Wen, R. A. Hackler, C. Liu, G. Celik, C. L. Marshall, P. C. Stair and M. Delferro, Atomically Precise Strategy to a PtZn Alloy Nanocluster Catalyst for the Deep Dehydrogenation of n-Butane to 1,3-Butadiene, ACS Catal., 2018, 8(11), 10058–10063 CrossRef CAS
.
-
(a) M. W. Schreiber, C. P. Plaisance, M. Baumgartl, K. Reuter, A. Jentys, R. Bermejo-Deval and J. A. Lercher, Lewis-Bronsted Acid Pairs in Ga/H-ZSM-5 To Catalyze Dehydrogenation of Light Alkanes, J. Am. Chem. Soc., 2018, 140(14), 4849–4859 CrossRef CAS PubMed
; (b) J. J. H. S. Ruiz-Martinez, J. Santillan-Jimenez and B. M. Weckhuysen, Catalytic Dehydrogenation of Light Alkanes on Metals and Metal Oxides, Chem. Rev., 2014, 114, 10613–10653 CrossRef PubMed
.
-
(a) L. Rochlitz, K. Searles, J. Alfke, D. Zemlyanov, O. V. Safonova and C. Copéret, Silica-supported, narrowly distributed, subnanometric Pt–Zn particles from single sites with high propane dehydrogenation performance, Chem. Sci., 2020, 11(6), 1549–1555 RSC
; (b) P. Ingale, K. Knemeyer, P. Preikschas, M. Ye, M. Geske, R. Naumann d’Alnoncourt, A. Thomas and F. Rosowski, Design of PtZn nanoalloy catalysts for propane dehydrogenation through interface tailoring via atomic layer deposition, Catal. Sci. Technol., 2021, 11(2), 484–493 RSC
.
-
(a) S. M. George, Atomic Layer Deposition: An Overview, Chem. Rev., 2010, 110(1), 111–131 CrossRef CAS PubMed
; (b) B. S. Lim, A. Rahtu and R. G. Gordon, Atomic Layer Deposition of Transition Metals, Nat. Mater., 2003, 2(11), 749–754 CrossRef CAS PubMed
.
- J. A. Libera, J. W. Elam and M. J. Pellin, Conformal ZnO coatings on high surface area silica gel using atomic layer deposition, Thin Solid Films, 2008, 516(18), 6158–6166 CrossRef CAS
.
- Z. Moser, The Pt–Zn (Platinum-Zinc) system, J. Phase Equilib., 1991, 12(4), 439–443 CrossRef CAS
.
- J. W. Elam and S. M. George, Growth of ZnO/Al2O3 Alloy Films using Atomic Layer Deposition Techniques, Chem. Mater., 2003, 15(4), 1020–1028 CrossRef CAS
.
- J. D. Ferguson, A. W. Weimer and S. M. George, Surface chemistry and infrared absorbance changes during ZnO atomic layer deposition on ZrO2 and BaTiO3 particles, J. Vac. Sci. Technol., A, 2005, 23(1), 118–125 CrossRef CAS
.
- H. H. Sønsteby, A. Yanguas-Gil and J. W. Elam, Consistency and reproducibility in atomic layer deposition, J. Vac. Sci. Technol., A, 2020, 38(2), 020804 CrossRef
.
- J. Zhu, X. Zheng, J. Wang, Z. X. Wu, L. L. Han, R. Q. Lin, H. L. L. Xin and D. L. Wang, Structurally ordered Pt–Zn/C series nanoparticles as efficient anode catalysts for formic acid electrooxidation, J. Mater. Chem. A, 2015, 3(44), 22129–22135 RSC
.
- Y. Lei, J. Jelic, L. C. Nitsche, R. Meyer and J. T. Miller, Effect of Particle Size and Adsorbates on the L3, L2 and L1 X-ray Absorption Near Edge Structure of Supported Pt Nanoparticles, Top. Catal., 2011, 54, 334–348 CrossRef CAS
.
- J. M. Ramallo-López, F. G. Requejo, A. F. Craievich, J. Wei, M. Avalos-Borja and E. Iglesia, Complementary methods for cluster size distribution measurements: supported platinum nanoclusters in methane reforming catalysts, J. Mol. Catal. A: Chem., 2005, 228(1), 299–307 CrossRef
.
- T. J. Penfold, J. Szlachetko, F. G. Santomauro, A. Britz, W. Gawelda, G. Doumy, A. M. March, S. H. Southworth, J. Rittmann, R. Abela, M. Chergui and C. J. Milne, Revealing hole trapping in zinc oxide nanoparticles by time-resolved X-ray spectroscopy, Nat. Commun., 2018, 9(1), 478 CrossRef PubMed
.
-
(a) Y. Lei, S. Lee, K.-B. Low, C. L. Marshall and J. W. Elam, Combining Electronic and Geometric Effects of ZnO-Promoted Pt Nanocatalysts for Aqueous Phase Reforming of 1-Propanol, ACS Catal., 2016, 6(6), 3457–3460 CrossRef CAS
; (b) K. Fottinger, J. A. Van Bokhoven, M. Nachtegaal and G. Rupprechter, Dynamic Structure of a Working Methanol Steam Reforming Catalyst: In Situ Quick-EXAFS on Pd/ZnO Nanoparticles, J. Phys. Chem. Lett., 2011, 2, 428–433 CrossRef CAS
.
- F. Behafarid, S. Pandey, R. E. Diaz, E. A. Stach and B. R. Cuenya, An in situ transmission electron microscopy study of sintering and redispersion phenomena over size-selected metal nanoparticles: environmental effects, Phys. Chem. Chem. Phys., 2014, 16(34), 18176–18184 RSC
.
Footnote |
| † Electronic supplementary information (ESI) available: XRD patterns, EDX spectrum, EXAFS fitting, and N2 absorption–desorption isotherms. See DOI: https://doi.org/10.1039/d2cp04173a |
| This journal is © the Owner Societies 2023 |

