DOI:
10.1039/D1CP00909E
(Perspective)
Phys. Chem. Chem. Phys., 2021,
23, 27159-27170
Mechanical behaviour of inorganic solid-state batteries: can we model the ionic mobility in the electrolyte with Nernst–Einstein's relation?
Received
27th February 2021
, Accepted 15th November 2021
First published on 1st December 2021
Abstract
Inorganic solid-state lithium–metal batteries could be the next-generation batteries owing to their non-flammability and higher specific energy density. Many research efforts have been devoted to improving the ionic conductivity of inorganic solid electrolytes. For a wide range of electrolytes including liquid and solid polymer electrolytes, an independent measurement or calculation of both electrolyte conductivity and diffusion coefficient is often time-consuming and challenging. As a result, Nernst–Einstein's relation has been used to relate the ionic conductivity to ionic diffusivity after the determination of either parameter. Although Nernst–Einstein's relation has been used for different electrolytes, we demonstrate in this perspective that this relation is not directly transferable to describe the ionic mobility for many inorganic solid electrolytes. The fundamental physics of Nernst–Einstein's relation shows that the relationship between the diffusion coefficient and electrolyte conductivity is derived for ionic mobility in a viscous or a gaseous medium. This postulation contradicts state-of-the-art experimental studies measuring the mechanical behaviour of inorganic solid electrolytes, which show that inorganic solid electrolytes are usually brittle rather than viscoelastic at ambient room temperature. The measurement of loss tangent is required to justify the use of Nernst–Einstein's relation. The outcome of such measurement has two implications. First, if the loss tangent of inorganic solid electrolytes is less than unity in the range of batteries operating temperatures, the impacts of using Nernst–Einstein's relation in modelling the ionic mobility should be quantified. Secondly, if the measured loss tangent is comparable to that of solid polymers and lithium metal, inorganic solid electrolytes may behave in a viscoelastic manner as opposed to the brittle behaviour usually suggested.
1 Introduction
The inorganic solid electrolyte is a unique class of electrolyte that promises a lower risk of flammability and higher specific energy density when combined with a Li negative electrode.1,2 Examples of inorganic solid electrolytes include Lithium Phosphorus OxyNitride (LiPON), cubic-phase Li7La3Zr2O12 (c-LLZO), Li1+xAlxGe2–x(PO4)3 (LAGP), Li2S-P2S5 (LPS) and Li10GeP2S12 (LGPS). Unlike liquid electrolytes, which usually have an area specific impedance in the range of mΩ cm2 and Ω cm2, the impedance of current inorganic solid electrolytes can be several orders of magnitude higher.3–8 Therefore, increasing the conductivity of inorganic solid electrolytes to achieve an ionic conductivity comparable to that of liquid electrolytes (10−2 S cm−1) has become an important research target.7–13 For a wide range of electrolytes, the ionic conduction often depends on the ionic diffusion coefficient. A higher diffusion coefficient increases the electrolyte conductivity. However, an independent measurement of both electrolyte conductivity and diffusion coefficient is challenging. Therefore, many existing studies use Nernst–Einstein's relation to estimate the ionic conductivity after the determination of the diffusion coefficient or vice versa.13–23 Nevertheless, the validity of this relation is questionable in describing the ionic mobility for many inorganic solid electrolytes.
In general, Nernst–Einstein's model relates the diffusion coefficient of an uncorrelated ion to the electrolyte's ionic conductivity. The failure of Nernst–Einstein's relation in modelling the ionic mobility was demonstrated by Marcolongo and Marzari.25 Due to the high concentration of mobile ionic species in solid electrolytes, they showed that ionic correlations could act to increase the cooperative ionic motion and subsequently the ionic conductivity.25,26 Therefore, the application of Nernst–Einstein's model without considering the ionic interactions leads to an underestimation of the ionic conductivity.25 As a result, the Haven's ratio or the collective correlation factor were proposed to account for the ion–ion correlations.26 However, these studies have not considered the physical meaning of the forces governing ionic mobility. How would the correlation factor change if the fundamental forces determining the ionic mobility for many inorganic solid electrolytes deviate from those assumed in the derivation of Nernst–Einstein's relation?
By revisiting the original derivations proposed by Einstein27 and later expounded by Brett et al.,28 Feynman et al.29 and Peskir,30 we study the fundamental assumptions of the Einstein's and Nernst–Einstein's relations as well as their validity in describing the ionic mobility for inorganic solid electrolytes. Despite the popular applications of these two relations in a wide range of electrolytes, in the absence of viscoelastic measurements as a function of temperatures, Nernst–Einstein's relation may not be directly transferable to model the ionic mobility for many inorganic solid electrolytes.
2 Fundamental physics of Nernst–Einstein's relation
The Einstein's relation shows that the diffusion coefficient, D, is directly proportional to the mobility, μ [(m2 mol) (J s)−1]:31where Rgas is the universal gas constant and T is the absolute temperature. By considering a displacement distribution function, the mean displacement of a suspended particle can be expressed as a function of the diffusion coefficient via32| |  | (2) |
where x represents the vector displacement of an atom, and  denotes the mean displacement over all possible routes in time t. Eqn (2) was also derived by Smoluchowski and therefore, this equation is known as Einstein–Smoluchowski relation.32 The relationship between
  and t was later verified experimentally by Perrin, who measured the sedimentation equilibrium in a colloidal suspension.32,33 Experiments were performed with different colloidal materials and solvent viscosities under various external conditions to demonstrate the kinetic theory of fluids.33
The diffusion coefficient, D, can be further related to the equivalent electrolyte conductivity, λ [(S cm2) equiv.−1], through Nernst–Einstein's relationship given by31
| |  | (3) |
It should be noted that
eqn (3) is only valid for non-interacting particles,
i.e. when the ionic hopping are completely random.
34 If the hopping probability depends on the direction of the previous hops, the diffusion coefficient becomes correlated.
26,34 In this case,
eqn (3) can be expressed as
34| |  | (4) |
where
c is the site fraction and
μ is the chemical potentials of the particle.
The detailed derivations of the Einstein's, Einstein–Schmoluchowski and Nernst–Einstein's relation can be found in the works of Brett and co-worker,28 Feynman et al.,29 Islam32 and Peskir.30
2.1 Governing forces in Nernst–Einstein's relation
Einstein27 developed the theory of diffusion to describe the mobility of small particles in a fluid, where the fluid indicates either a liquid or a gas. The term diffusion denotes the collective motion of all Brownian particles in the fluid.27 Einstein determined the diffusion coefficient of a suspended single particle from the dynamic equilibrium condition, which considers the superposition of two processes in opposite directions. In the absence of an external electric field, the first process describes the movement of a suspended single particle under the influence of a force, whereas the second process describes the diffusion due to the thermal molecular movement.27 The force considered in Einstein's model is the viscous force, ![[F with combining right harpoon above (vector)]](https://www.rsc.org/images/entities/i_char_0046_20d1.gif) :27
:27| | ![[F with combining right harpoon above (vector)]](https://www.rsc.org/images/entities/i_char_0046_20d1.gif) = 6πηvrv, = 6πηvrv, | (5) |
where r [m] is the radius of the particle, ηv [Pa s] is the dynamic viscosity of the fluid and v [m s−1] is the velocity vector of the single particle. The dynamic viscosity is a measure of the fluid resistance to flow (see the bottom left panel of Fig. 1). By considering the dynamic equilibrium of the thermal molecular movement and molecular drift due to viscous force, Einstein demonstrated that the diffusion coefficient depends on the fluid viscosity and the size of suspended particle.27
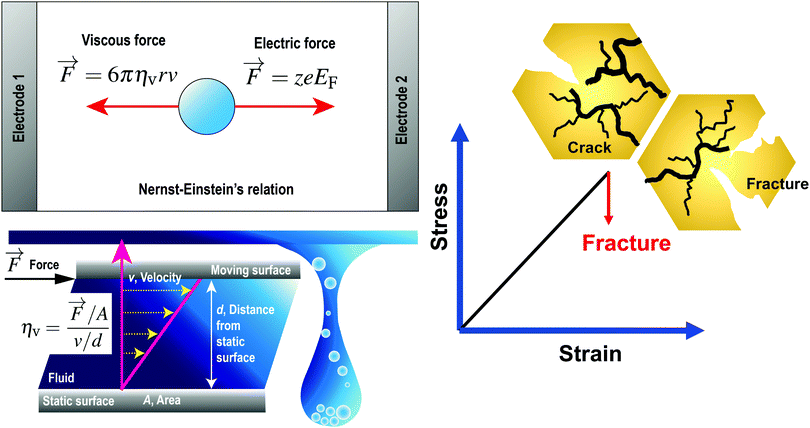 |
| | Fig. 1 (Top left) Governing forces given by Nernst–Einstein's relationship, where the forward electric force is in a dynamic equilibrium with the backward viscous force. (bottom left) The dynamic viscosity is a measure of the fluid resistance to flow. (right) For brittle inorganic solid electrolytes characterised by cracks formation and electrolyte fracture, the stress–strain relationship before the electrolyte fracture can be approximated as linear. Reproduced with permission from ref. 24, Copyright (2021), CC-BY. | |
In the presence of an external electric field, the backward viscous force is counterbalanced by the forward electric force:28
| |  | (6) |
in which
ze is the charge of each ion and
EF is the applied electric field between two metallic plates. The top left panel of
Fig. 1 illustrates the mobility of an isolated ion in an electric field between two parallel electrodes, where the movement of the ion is governed by a forward electric force and a backward viscous force. Therefore, the drift velocity of the single-particle can be described by
28| |  | (7) |
where
u [(C m) (N s)
−1] is the proportionality coefficient between the velocity and electric field strength.
u can be related to the ionic mobility,
μ, from
eqn (1)via μ =
u/(
zF), where
F is the Faraday's constant.
2.2 Diffusion coefficients in gaseous media
For gaseous media involving the acceleration and collisions of gaseous molecules, Feynman et al.29 demonstrated that the drift velocity of the gas particles could be derived by considering the drift due to an externally applied force, ![[F with combining right harpoon above (vector)]](https://www.rsc.org/images/entities/i_char_0046_20d1.gif)
![[thin space (1/6-em)]](https://www.rsc.org/images/entities/char_2009.gif) [(kg m) s−2]. In this case, the drift velocity becomes29
[(kg m) s−2]. In this case, the drift velocity becomes29| | v = μgas![[F with combining right harpoon above (vector)]](https://www.rsc.org/images/entities/i_char_0046_20d1.gif) , , | (8) |
where μgas [s kg−1] is the constant of proportionality denoted as the gaseous mobility. This equation is derived based on the assumption that gaseous particles accelerate under the applied external force:29| |  | (9) |
in which a [m s−2] is the acceleration of the gaseous particles, τ [s] is the mean time between collisions and m [kg] is the mass of the gas molecule. By comparing eqn (8) and (9), the gaseous mobility is defined by τ/m. μgas can be further related to the diffusion coefficient (D = μgaskT) through the kinetic theory of gases:29| |  | (10) |
where vrms [m s−1] is the root-mean-square velocity of gas molecules and k [J K−1] is the Boltzmann's constant (k = Rgas/NA). Eqn (10) can be derived from the ideal gas law under the assumption that the volume of gaseous molecules is negligible compared to the total volume, in which the gas is contained.
By examining the fundamental assumptions in these derivations, it is evident that the relationship between the diffusion coefficient and electrolyte conductivity can only be established in a viscous or a gaseous medium.
2.3 Diffusion measurements in inorganic solid electrolytes
Hayamizu and Aihara37 have measured the diffusion coefficient and ionic conductivity of 7Li-ion in sulfide-based solid electrolyte, (Li2S)7(P2S5)3 using PGSE NMR method and AC impedance spectroscopy independently. By using the PGSE NMR method, the diffusion coefficient can be determined from the Stejskal and Tanner equation, where the echo attenuation depends on the gradient strength, g [T m−1], interval between the leading edges of the gradient pulse, Δ [ms] and pulse duration, δ [ ms].37,39,40 The 7Li-ion diffusion measured by the PGSE-NMR method is determined by the migration of the 7Li-ion during a time interval Δ.39 The first signal encodes the target 7Li-ion, and the second signal detects the encoded species after an interval Δ.39 The measured signal attenuations usually have a standard deviation of 2–5% for 7Li-ion.35,36
Fig. 2(a) shows the temperature-dependent diffusion coefficient between 303 K and 353 K. The apparent diffusion coefficient measured by the PGSE NMR method shows a qualitative agreement with the estimated diffusion coefficient from the measured ionic conductivity using Nernst–Einstein's relation (i.e. both measured and estimated diffusion coefficients become larger with increasing temperature). However, the diffusion coefficients measured with the PGSE NMR method deviate significantly from the estimated diffusion coefficient using Nernst–Einstein equation.
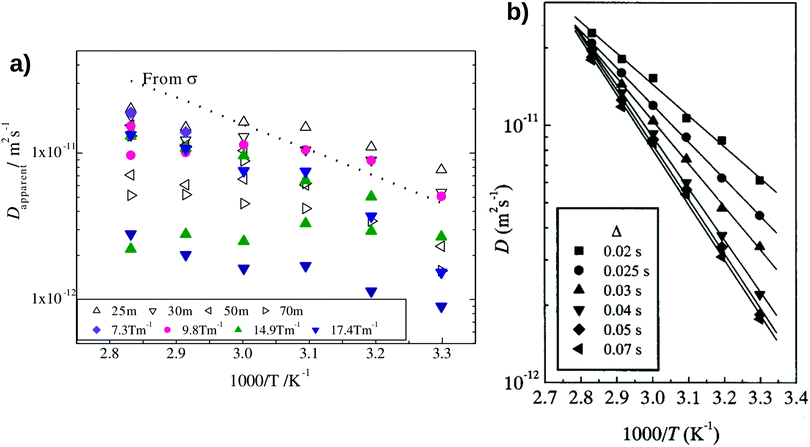 |
| | Fig. 2 The degree of scattering observed in the Pulse-Gradient Spin-Echo (PGSE)-NMR diffusion measurements of (a) inorganic solid electrolytes and (b) solid polymer electrolytes. (a) The opened triangles represent the diffusion measurements using different intervals between two gradient pulses, Δ, whereas the filled markers denote the diffusion measurements using different magnitudes of gradient strength, g. The standard notation to denote pulse delays of milliseconds (Δ) is “ms” instead of “m”. The dotted line is the estimated diffusion coefficient from the ionic conductivity measurement using Nernst–Einstein's equation. The standard deviations of a typical 7Li-ion PGSE-NMR measurement are between 2–5%.35,36 Reproduced with permission from ref. 37, Copyright (2013), Elsevier. (b) The temperature-dependent diffusion measurement as a function of Δ in solid polymer electrolytes. Reproduced with permission from ref. 38, Copyright (2000), Elsevier. | |
Due to the strong dependence on the g- and Δ-values, the PGSE-NMR measurement method shows no unique apparent diffusion coefficient in the sulfide-based solid electrolyte. For instance, Fig. 2(a) shows that at the same gradient strength of g = 14.9 T m−1 and the same interval of Δ = 30 ms, different diffusion coefficients were obtained for all temperatures.37 Two modes of a fixed δ with varying g and a fixed g with varying δ yield different echo attenuation plots.39 Such observations differ from the diffusion measurements taken in polymer electrolytes, organic solvents and ionic liquids, where the measured signal attenuations can be quantified reliably.35,38,41–43Fig. 2(b) shows the diffusion measurement in solid polymer electrolytes. Unlike the strong degree of scattering observed in the diffusion measurement of (Li2S)7(P2S5)3 inorganic solid electrolytes (Fig. 2a), the temperature-dependent diffusion coefficients do not scatter depending on measuring conditions.38 The scattered ionic diffusions in (Li2S)7(P2S5)3 (for example, the diffusion measurement at the gradient strength g = 9.8 T m−1 denoted by the pink circles in Fig. 2a) also reveal that the dependence of diffusion coefficients on ionic conductivity is non-linear.37 Such behaviour is different from the estimated diffusion coefficient using Nernst–Einstein's relation (eqn (3)), where the diffusion coefficient is predicted to be linearly proportional to the electrolyte conductivity.
Even with a better-controlled measuring condition, Hayamizu et al.39 showed that the simple application of Nernst–Einstein's equation in inorganic solid electrolytes is still questionable. They showed that a PGSE-NMR diffusion measurement with a longer time interval, Δ, could reduce the degree of scattering observed in inorganic solid electrolytes.39 However, the diffusion coefficient calculated from Nernst–Einsteins equation is larger than the equilibrated diffusion coefficient obtained by the PGSE-NMR measurements.39,40 As a result, the Ncarrier calculated from the experimental ionic conductivity and equilibrated diffusion coefficient through Nernst–Einsteins relation were found to be higher than the values estimated by the molecular formula and experimental density.39,40 In addition, an equilibrated measurement of the diffusion coefficient may not be representative of the fast ionic transport across the solid electrolyte.
By comparing the echo-attenuation plots obtained in single crystals and powders, grain morphologies were shown to cause such unusual diffusive behaviour in inorganic solid electrolytes.40 Nevertheless, another possible reason could be the lack of viscoelastic behaviour in an inorganic solid electrolyte. In reality, the viscosity, ηv, is an important parameter determining the ionic diffusion coefficient.35,36,42,43 For instance, Hayamizu et al.35 showed that the diffusion coefficients of 12 organic solvents are directly correlated to the inverse of viscosity (Fig. 3). A good correlation can be found between the viscosity diffusion coefficient (Dη) and viscosity (ηv) according to Stokes–Einstein's equation:35
| |  | (11) |
where
r is the effective hydrodynamic radius.
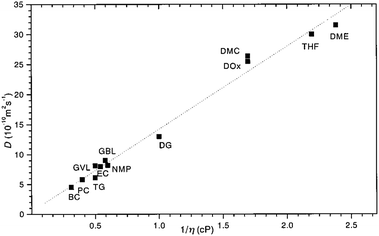 |
| | Fig. 3 The relationship between the diffusion coefficient and viscosity of 12 organic solvents. Reproduced with permission from ref. 35, Copyright (1999), American Chemical Society. | |
3 Mechanical behaviour of inorganic solid electrolytes
In a broad sense, the family of inorganic solid electrolytes consists of two sub-branches: (i) ceramic-based solid electrolytes and (ii) glassy solid electrolytes. By using Nernst–Einstein's relation to describe the mobility of Li+ ions in inorganic solid electrolytes, one assumes that the transport of Li+ ions through inorganic solid electrolytes can be described as viscous flow or viscoelastic behaviour. However, many of the existing experimental results measuring the mechanical behaviour of inorganic solid electrolytes usually indicate that inorganic solid electrolytes are brittle and ceramic-like rather than viscoelastic.44–49
3.1 Characteristics of brittle and viscoelastic solids
A brittle solid typically exhibits a linear stress–strain relationship with very few plastic deformation signs before a catastrophic crack or fracture. This phenomenon is caused by the low capacity of ceramics in absorbing the applied energy before they fracture.50,51 Unlike a viscoelastic solid, stress in a brittle material is independent of the rate of strain. This relationship before failure can be described by Hooke's law asin which σst [Pa] is the applied stress, ε [−] is the corresponding strain, and E [Pa] is the proportionality constant known as Young's modulus. Fig. 4(a) shows the stress–strain relationship for brittle ceramics such as ZTA, Y-PSZ, Mg-PSZ and Syalon +BN.50 Gogotsi et al.50 introduced a brittleness measure, χ, to characterise the elastic behaviour of ceramics. He considered a ceramic as linearly elastic if the brittleness measure χ = 1 or inelastic if χ < 1. While materials such as ZTA and Y-PSZ have a χ-value of 1, he showed that the mechanical behaviour of Mg-PSZ and Syalon + BN can deviate slightly from the linearly elastic regime.50 Nevertheless, for a wide range of temperatures, the mechanical behaviour of brittle ceramics can be approximated with Hooke's law, as shown by Fig. 4(b).
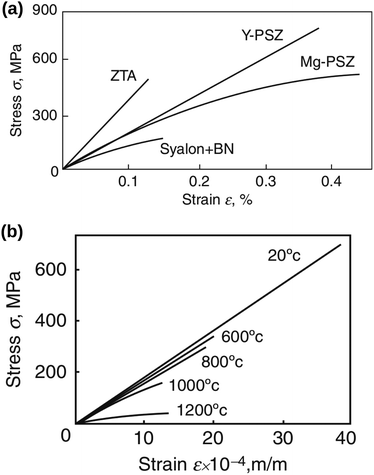 |
| | Fig. 4 (a) Illustration of the stress–strain relationship for brittle ceramics: ZTA and Y-PSZ have a brittleness measure of 1, whereas Syalon + BN and Mg-PSZ have a brittleness measure of 0.70 and 0.44, respectively. (b) The stress–strain relationship for Y-PSZ ceramics at different temperatures. Reproduced from ref. 50, Copyright (2014), with permission from Springer. | |
In contrast, viscoelastic solids such as polymers and Li metal exhibit mechanical behaviour, in which both solid-like and liquid-like characteristics are prevalent.52–55 As a result, these materials can undergo significant deformations before failure (see the inset of Fig. 6d). Stress is always proportional to the rate of strain, indicating a time-dependent deformation or a viscous behaviour. For an ideal viscous material, the stress–strain relationship can be represented by
| |  | (13) |
where
ηv is the dynamic viscosity – a key parameter influencing the viscous force in
eqn (5).
Vincent56 illustrated the stress–strain relationships for different mechanical behaviours (Fig. 5). As shown by the top left panel in Fig. 5, an elastic material will return to its original shape on removal of the load. However, due to dissipation of the deformation energy, a plastic material will not return to its original shape after the load is removed (see bottom left panel). While an elastic–plastic mechanical behaviour shows a combination of elasticity and permanent deformation, a viscoelastic material will return to its original shape on removal of the load. Nevertheless, compared to the pure elastic mechanical behaviour, a time-dependent deformation occurs due to the contribution of the viscous component to the viscoelastic response.56
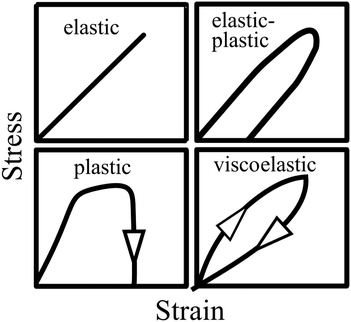 |
| | Fig. 5 Illustration of stress–strain relationships for different types of mechanical behaviours: elastic, elastic–plastic, plastic and viscoelastic characteristics. Reproduced with permission from ref. 56, Copyright (2012), Princeton University Press. | |
3.2 The effects of operating temperatures
Temperature plays a significant role in determining the viscoelastic behaviour of a solid. Brittle material such as inorganic solids also have different stress–strain relationships at room temperature compared to at high temperature. While a linear stress–strain relationship is usually observed before an immediate crack or a fracture through the material at ambient room temperature, at high temperatures such as 200–400 °C, the stress–strain relationship has been found to be non-linear even before a crack or fracture.51
Lewis et al.49 illustrated the crack formation in the LAGP solid electrolyte captured by low-magnification cross-sectional SEM images (see Fig. 6a), when the LAGP cells were cycled until failure at 0.1 mA cm−2 and 0.5 mA cm−2. As the applied current densities increase, they showed that the horizontal cracks at the interface penetrated deeper into the bulk solid electrolyte. These images portray cracks propagating in the absence of plastic deformation signs, indicating that LAGP is brittle and has a ceramic-like mechanical behaviour.49 Typical deformation behaviour is characterised by an irreversible change in volume in response to exerted forces, as portrayed in the inset of Fig. 6(c). In Fig. 6(b), Korte and Clegg51 showed the fracture of ceramic micropillars into multiple fragments when compressed with a nano-indenter at room temperature, corroborating the conclusion that ceramic-like electrolyte is brittle. Nevertheless, when the same material was compressed at elevated temperatures such as 200 °C and 400 °C, considerable deformation rather than a brittle fracture was observed.51 In contrast, Fig. 6(c) shows that a viscoelastic solid such as Li metal deformed significantly even at room temperature when it was compressed.55
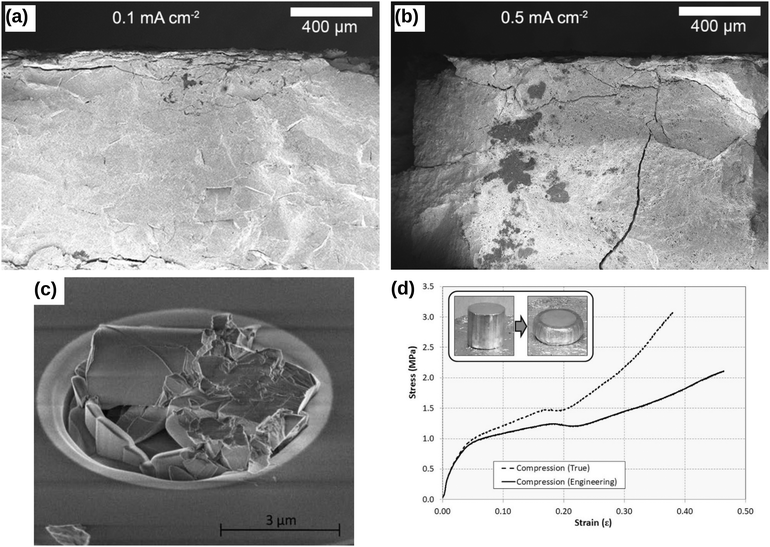 |
| | Fig. 6 Comparison of the brittle and viscoelastic material behaviour: cross-sectional SEM images of Li1+xAlxGe2–x(PO4)3 (LAGP) solid electrolyte cycled until failure at (a) 0.1 mA cm−2 and (b) 0.5 mA cm−2 current densities. Reprinted from ref. 49, Copyright (2019), with permission from American Chemical Society. (c) The fracture of ceramic micropillars upon compression with a nano-indenter at room temperature. Reprinted from ref. 51, Copyright (2009), with permission from Elsevier. (d) The compressive stress–strain behaviour of a solid Li at room temperature during a loading cycle. The inset shows that Li metal deforms significantly when subjected to compressive stress, indicating that Li metal could exhibit a viscoelastic mechanical behaviour.† Reprinted from ref. 55, Copyright (2019), with permission from Springer Nature. | |
While high operating temperatures improve the ionic transport across the inorganic solid electrolyte, the temperature increment is capped by the (i) interfacial decomposition at high temperatures and (ii) the low melting point of Li metal. Firstly, due to the low interfacial stability, the rate of decomposition at both interfaces was shown to increase at high temperatures.57–59 For instance, Wang et al.57 showed that a solid-state cell cycled at 80 °C lost about 35% of the initial capacity after 250 cycles while the cell cycled at 25 °C maintained the same initial capacity. By using TEM and STEM-EELS analysis, they showed that the decrease in the capacity at 80 °C was caused by the decomposition reaction in the disordered LiCoO2 layer at the interface.57,60 Secondly, if pure metallic Li is used as the negative electrode to boost the gravimetric and volumetric energy density,1 one should note that Li melts at 180 °C. This limitation indicates that a solid-state cell with a Li electrode cannot be operated at temperatures approaching 180 °C. Therefore, within this limited operating temperature range, ceramic-based inorganic solid electrolytes are expected to demonstrate a brittle rather than a viscoelastic mechanical behaviour.
3.3 Glassy solid electrolytes
However, due to different chemical compositions, structures and processing conditions, one should also note that the brittleness of inorganic solid electrolytes cannot be generalised for all different solid electrolytes. While solid electrolytes such as c-LLZO, LLTO and LATP have a low fracture toughness comparable to that of brittle inorganic materials (≈1 MPa m−2) (see Fig. 7(a)),61 Kalnaus et al.61 demonstrated recently that glassy solid electrolytes such as LiPON portrayed nanoscale ductility and time-dependent deformation behaviour. By using nanoindentation, they observed accommodation of stress via pile-up rather than by cracking in LiPON, as shown by Fig. 7b.61
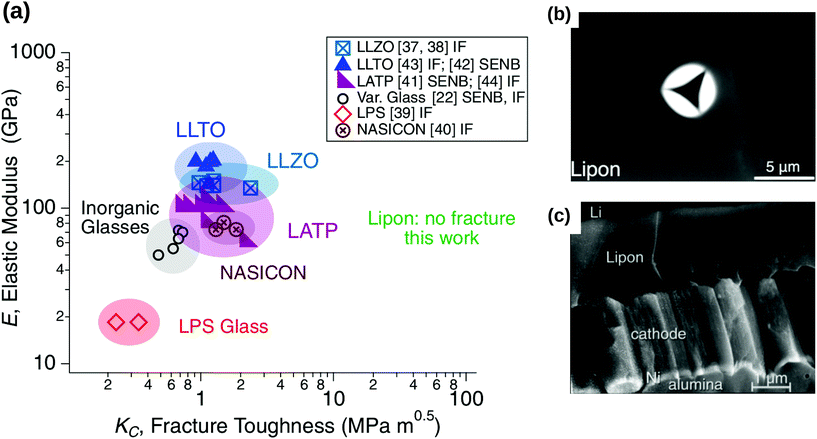 |
| | Fig. 7 (a) Stiffness versus fracture toughness of ceramic-based and glassy solid electrolyte. The typical fracture toughness of brittle materials is approximately 1 MPa m−2. When LiPON was subjected to the nanoindentation in the works of Kalnaus et al.,61 no fracture was observed throughout the experiments. Reprinted from ref. 61, Copyright (2021), with permission from Springer. (b) Under nanoindentation experiments, a significant pile-up instead of cracking was observed in LiPON. Reprinted from ref. 61, Copyright (2021), with permission from Springer. (c) The micrograph of a cross-sectional crack observed in LiPON. Reprinted from ref. 62, Copyright (2000), with permission from Elsevier. | |
Unlike ceramics, glasses consist of network formers such as SiO2 and network modifiers such as alkali oxides.63 At high temperatures, a glass-forming melt behaves as a liquid and becomes a glassy solid upon cooling below the glass-transition temperature.64 The viscosity of glasses depends strongly on the temperature, which has been usually described by the Vogel–Fulcher–Tamman's relation:65
| |  | (14) |
where
η0 is the constant,
Dfrag is the fragility index of glasses and
T0 is the temperature, at which the liquid ceases to flow. Glasses such as soda-lime glasses have very high glass-transition temperature at 840–900 K.
66 As a result, the viscosity-temperature behaviour was determined for temperatures ranging from 793 K to 1772 K.
66
Some glasses like oxide glasses are ionic conductors, which imply that their ionic conductivity can be measured by the impedance spectroscopy.63 Mehrer et al.63 measured the temperature-dependent diffusion coefficients of a soda-lime silicate glass for temperatures ranging from approximately 450 K to 1600![[thin space (1/6-em)]](https://www.rsc.org/images/entities/char_2009.gif) K (see Fig. 8). In their works, the charge diffusion coefficient or sometimes also denoted as the conductivity diffusion coefficient, Dσ is the diffusion coefficient determined from Nernst–Einstein's relation, where the particles were assumed to be non-interacting (eqn (3)). They obtained the tracer diffusion coefficient of radioisotopes 22Na and 45Ca with the radiotracer technique.63 By comparing the conductivity diffusion coefficient to the tracer diffusion coefficient of 22Na and 45Ca radioisotopes, they concluded that the ionic conductivity of a soda-lime glass is caused predominantly by the mobility of Na ions.63 They also determined the viscosity diffusion coefficient by Stokes–Einstein's relation (eqn (11)), which corresponded to the mobility of the network-forming units.63 Nevertheless, as discussed in Section 3.2, operating temperatures ranging from 450 K to 1600 K are not feasible for inorganic solid-state Li–metal batteries. Therefore, future works are required to quantify the viscoelastic behaviour of glassy solid electrolytes and the interplay with their ionic conduction mechanisms at ambient temperatures.
K (see Fig. 8). In their works, the charge diffusion coefficient or sometimes also denoted as the conductivity diffusion coefficient, Dσ is the diffusion coefficient determined from Nernst–Einstein's relation, where the particles were assumed to be non-interacting (eqn (3)). They obtained the tracer diffusion coefficient of radioisotopes 22Na and 45Ca with the radiotracer technique.63 By comparing the conductivity diffusion coefficient to the tracer diffusion coefficient of 22Na and 45Ca radioisotopes, they concluded that the ionic conductivity of a soda-lime glass is caused predominantly by the mobility of Na ions.63 They also determined the viscosity diffusion coefficient by Stokes–Einstein's relation (eqn (11)), which corresponded to the mobility of the network-forming units.63 Nevertheless, as discussed in Section 3.2, operating temperatures ranging from 450 K to 1600 K are not feasible for inorganic solid-state Li–metal batteries. Therefore, future works are required to quantify the viscoelastic behaviour of glassy solid electrolytes and the interplay with their ionic conduction mechanisms at ambient temperatures.
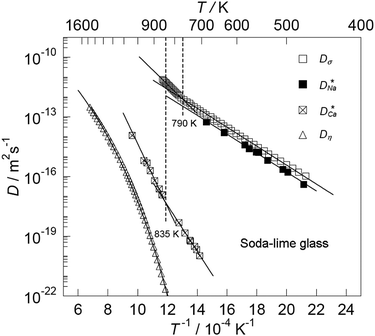 |
| | Fig. 8 The temperature-dependent charge diffusion coefficient (Dσ), tracer diffusion coefficients of  and and  and viscosity diffusion coefficient (Dη) for a soda-lime silicate glass. Reproduced from ref. 63, Copyright (2008), with permission from IOP Publishing. and viscosity diffusion coefficient (Dη) for a soda-lime silicate glass. Reproduced from ref. 63, Copyright (2008), with permission from IOP Publishing. | |
3.4 Loss tangent measurements
Although the nanoscale micrograph of LiPON reveals the accommodation of stress via pile-up, the value of fracture toughness for LiPON remains unknown.61 Moreover, a fracture rather than a deformation was observed in another micrograph of LiPON (Fig. 7c),62 thus suggesting that LiPON may have different mechanical behaviour at different length scales. It is also worth noting that not all glassy materials exhibit time-dependent deformations. While metallic glasses are likely to yield plastically under an opening stress, oxide glasses have a very low fracture toughness (<1![[thin space (1/6-em)]](https://www.rsc.org/images/entities/char_2009.gif) MPa m1/2) and were shown to exhibit brittle cracks.67,68
MPa m1/2) and were shown to exhibit brittle cracks.67,68
Since the viscoelastic behaviour is a time- and frequency-dependent deformation, the value of the loss tangent can be used as the indication of a viscoelastic characteristic.52,69 In a viscoelasticity measurement, the material is perturbated with a small oscillating strain and the resulting stress is measured.56Fig. 9 illustrates the sinusoidal applied strain and the resultant stress response observed in an elastic and a viscoelastic material.56 If the material depicts a linearly elastic mechanical behaviour, the strain will be proportional to the stress, as shown by Fig. 9(a).56 However, if the material behaves in a viscoelastic manner, a phase shift between the applied strain and resultant stress will be observed, as illustrated by Fig. 9(b).56 The loss tangent, tan![[thin space (1/6-em)]](https://www.rsc.org/images/entities/char_2009.gif) δ, is then the ratio between the loss modulus E′′ [Pa] and the storage modulus E′ [Pa]:70,71
δ, is then the ratio between the loss modulus E′′ [Pa] and the storage modulus E′ [Pa]:70,71
| |  | (15) |
where
| |  | (16) |
Here,
σst,0 and
ε0 are the peak amplitudes of stress
σst and strain
ε, whereas
δ is the phase shift between stress and strain.
70 An elastic solid has a loss tangent of zero, indicating that the applied stress and the resulting strain are in phase. In contrast, a viscoelastic solid such as polymers and rubbers can have a loss tangent exceeding unity.
53,54,69,72,73 Although the loss tangents of inorganic solid electrolytes have not been measured experimentally, similar behaviour can be expected from them as measured in other ceramic materials such as alumina, which has a loss tangent of 9 × 10
−4 at room temperature.
69 Compared to the loss tangent of polymers and rubbers, this low magnitude of loss tangent shows that ceramic-based materials exhibit a negligible viscoelastic behaviour at room temperature.
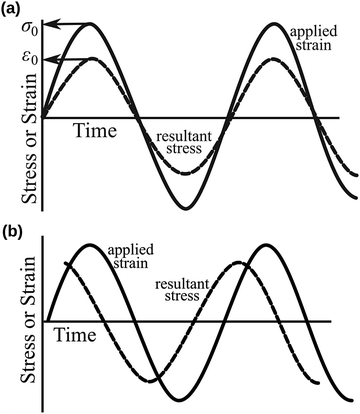 |
| | Fig. 9 Sinusoidal applied strain and the resultant stress response observed in (a) an elastic material and (b) a viscoelastic material. Reproduced with permission from ref. 56, Copyright (2012), Princeton University Press. | |
However, as discussed in Section 3.3, due to a large variation in the chemical compositions of inorganic solid electrolytes,13 we note that the brittle behaviour cannot be generalised for different types of these solid electrolytes. Different classes of inorganic solid electrolytes may exhibit different mechanical behaviour, which requires an individual mechanical characterisation.
4 Alternatives to Nernst–Einstein's relation
By using time-resolved operando neutron depth profiling methods, Han et al.74 measured the Li concentration profiles in three different representative classes of inorganic solid electrolytes (e.g. LiPON, c-LLZO and Li3PS4) at different temperatures. Their experimental measurements showed a near-zero concentration gradient across the bulk solid electrolytes (see Fig. 10). A near-zero concentration gradient implies that the macroscopic diffusion overpotential in an inorganic solid electrolyte is negligible.60 The migration of mobile cations by hopping between lattice sites is the principal conduction mechanism governing the ionic mobility in an inorganic solid electrolyte.60 Therefore, the ionic conductivity can be measured directly from the impedance measurement, thus implicitly including the effects of correlations between the mobile cations.6,11,12
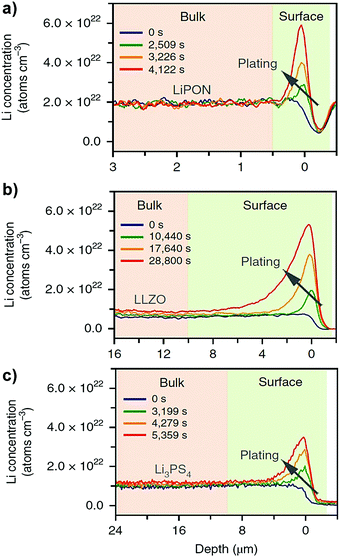 |
| | Fig. 10 Measurement of Li concentration profiles using operando neutron depth profiling technique across (a) LiPON (b) c-LLZO and (c) Li3PS4 solid electrolytes. Reproduced from ref. 74, Copyright (2019), with permission from Springer Nature. | |
As material discovery is increasingly aided by computer simulations, there may be materials of interest in which the ionic diffusion coefficient is relevant. In such cases, modelling work should focus on the nature of governing forces affecting the ionic mobility through quantum mechanical calculations and force-fields simulations.
For a ceramic-based solid electrolyte, the properties of a ceramic and how its atoms are arranged in its structure are determined predominantly by the nature and the directionality of the bonds holding the atoms together.75 In general, two types of bonds are governing the behaviours of ceramics: ionic and covalent bonds.75,76 Ionic bonding is an electrostatic force of attraction that results from the electrons transfer between a metal and a non-metal.75,76 Ionic compounds are typically brittle and have poor electrical and thermal conductivity.75,76 On the other hand, covalent bonding occurs due to sharing of outer shell electrons between two non-metals that have similar electronegativity.75,76 Although both types of bonds are present in ceramics, ionic bonding is more dominant, and the fundamental force governing the atomic structure in ceramics is the electrostatic Coulombic force.75,76 By using appropriate boundary conditions, Schrödinger's equation can be solved considering the dynamic equilibrium between various governing forces such as electrostatic Coulombic force and the forward electric force.75 The outcome of such investigations could determine whether Nernst–Einstein's relation can be applied for inorganic solid electrolytes or a new relation is required to describe the interatomic forces acting in these electrolytes.
Depending on the structure and the chemical composition of the host lattice, the atomic diffusion in a solid can be described by a range of diffusion mechanisms, which include interstitial mechanisms, collective mechanisms, vacancy mechanisms, divacancy mechanisms or interstitial-substitutional exchange mechanisms.64 For glassy solid electrolytes, atomistic simulation can be implemented to evaluate which diffusion mechanisms best describe the hopping behaviour observed experimentally in the solid electrolyte. By studying the relationship between mean displacement and time for colloidal particles, Jean Perrin and his students had performed a series of experiments in 1908 to evaluate Einstein's and Einstein–Smoluchowski's relation.33 Instead of assuming the general applicability of Nernst–Einstein's relation for all electrolytes, the Jean Perrin's experiments can be extended to evaluate whether the Einstein's diffusion model can describe the hopping mechanisms for different types of inorganic solid electrolytes.
5 Conclusions
In solid-state battery research, Nernst–Einstein's model has often been used to relate the diffusion coefficient of mobile cations to the electrolyte conductivity. However, a near-zero concentration gradient across the inorganic solid electrolyte indicates that the diffusion overpotential is insignificant, and the migration of mobile cations is the primary conduction mechanism. In this case, ionic conductivity can be measured from the impedance measurement of inorganic solid electrolytes, where the ion–ion correlations are also considered implicitly through a direct experimental measurement.
We show that the popular Nernst–Einstein's relation is not valid for all materials. Instead of using by default Nernst–Einstein's relation originally developed for fluids, future studies should calculate the ionic mobility from quantum mechanical or force-field simulations. Such approach could determine how the nature of governing forces affect the ionic mobility in an inorganic solid electrolyte. Then, the calculated ionic mobility can be used in cell- and system-level solid-state battery modelling to predict battery performance.
We also highlight that the measurement of loss tangent is necessary to characterise the viscoelastic behaviour of inorganic solid electrolytes. If the loss tangent of inorganic solid electrolytes is less than unity in the range of batteries operating temperatures, the impacts of using Nernst–Einstein's relation in modelling the ionic mobility in inorganic solid electrolytes must be evaluated before further use. A new relation describing the governing forces is required. However, if the measured loss tangent is comparable to that of polymers and Li metal, the viscoelastic behaviour of inorganic solid electrolytes should be quantified.
Conflicts of interest
There are no conflicts of interest to declare.
Acknowledgements
Much appreciated is the strong support received from Beijing Institute of Aeronautical Materials (BIAM). The research was performed at the BIAM-Imperial Centre for Materials Characterisation, Processing and Modelling at Imperial College London.
References
- J. Janek and W. G. Zeier, Nat. Energy, 2016, 1, 1167 CrossRef.
- Y. Kato, S. Hori, T. Saito, K. Suzuki, M. Hirayama, A. Mitsui, M. Yonemura, H. Iba and R. Kanno, Nat. Energy, 2016, 1, 652 CrossRef.
- Y.-H. Chiang, W.-Y. Sean and J.-C. Ke, J. Power Sources, 2011, 196, 3921–3932 CrossRef CAS.
- S. Alavi, C. R. Birkl and D. A. Howey, J. Power Sources, 2015, 288, 345–352 CrossRef CAS.
- J. Li, C. Ma, M. Chi, C. Liang and N. J. Dudney, Adv. Energy Mater., 2015, 5, 1401408 CrossRef.
- S. D. Fabre, D. Guy-Bouyssou, P. Bouillon, F. Le Cras and C. Delacourt, J. Electrochem. Soc., 2012, 159, A104 CrossRef CAS.
- C. Loho, R. Djenadic, M. Bruns, O. Clemens and H. Hahn, J. Electrochem. Soc., 2017, 164, A6131–A6139 CrossRef CAS.
- D. Rettenwander, G. Redhammer, F. Preishuber-Pflügl, L. Cheng, L. Miara, R. Wagner, A. Welzl, E. Suard, M. M. Doeff, M. Wilkening, J. Fleig and G. Amthauer, Chem. Mater., 2016, 28, 2384–2392 CrossRef CAS PubMed.
- J. B. Bates, N. J. Dudney, G. R. Gruzalski, R. A. Zuhr, A. Choudhury, C. F. Luck and J. D. Robertson, J. Power Sources, 1993, 43, 103–110 CrossRef CAS.
- P. Braun, C. Uhlmann, M. Weiss, A. Weber and E. Ivers-Tiffée, J. Power Sources, 2018, 393, 119–127 CrossRef CAS.
- L. Cheng, W. Chen, M. Kunz, K. Persson, N. Tamura, G. Chen and M. Doeff, ACS Appl. Mater. Interfaces, 2015, 7, 2073–2081 CrossRef CAS PubMed.
- S. Larfaillou, D. Guy-Bouyssou, F. Le Cras and S. Franger, J. Power Sources, 2016, 319, 139–146 CrossRef CAS.
- J. C. Bachman, S. Muy, A. Grimaud, H.-H. Chang, N. Pour, S. F. Lux, O. Paschos, F. Maglia, S. Lupart, P. Lamp, L. Giordano and Y. Shao-Horn, Chem. Rev., 2016, 116, 140–162 CrossRef CAS PubMed.
- A. Bates, S. Mukherjee, N. Schuppert, B. Son, J. G. Kim and S. Park, Int. J. Energy Res., 2015, 39, 1505–1518 CrossRef CAS.
- D. Danilov, R. A. H. Niessen and P. H. L. Notten, J. Electrochem. Soc., 2011, 158, A215 CrossRef CAS.
- N. Kazemi, D. L. Danilov, L. Haverkate, N. J. Dudney, S. Unnikrishnan and P. H. Notten, Solid State Ionics, 2019, 334, 111–116 CrossRef CAS.
- N. J. J. de Klerk, E. van der Maas and M. Wagemaker, ACS Appl. Energy Mater., 2018, 1, 3230–3242 CrossRef CAS PubMed.
- A. M. Nolan, Y. Zhu, X. He, Q. Bai and Y. Mo, Joule, 2018, 2, 2016–2046 CrossRef CAS.
- S. Ohno, A. Banik, G. F. Dewald, M. A. Kraft, T. Krauskopf, N. Minafra, P. Till, M. Weiss and W. G. Zeier, Progr. Energy, 2020, 2, 022001 CrossRef.
- X. Song, Y. Lu, F. Wang, X. Zhao and H. Chen, J. Power Sources, 2020, 452, 227803 CrossRef CAS.
- A. A. Talin, D. Ruzmetov, A. Kolmakov, K. McKelvey, N. Ware, F. El Gabaly, B. Dunn and H. S. White, ACS Appl. Mater. Interfaces, 2016, 8, 32385–32391 CrossRef CAS PubMed.
- H.-K. Tian and Y. Qi, J. Electrochem. Soc., 2017, 164, E3512–E3521 CrossRef CAS.
- H.-K. Tian, A. Chakraborty, A. A. Talin, P. Eisenlohr and Y. Qi, J. Electrochem. Soc., 2020, 167, 090541 CrossRef CAS.
-
M.-C. Pang, Mechanical behaviour of inorganic solid-state batteries: Can we model the ionic mobility in the electrolyte with Nernst–Einstein's relation? 2021 DOI:10.5281/zenodo.5559668.
- A. Marcolongo and N. Marzari, Phys. Rev. Mater., 2017, 1(2), 025402 CrossRef.
- N. M. Vargas-Barbosa and B. Roling, ChemElectroChem, 2020, 7, 367–385 CrossRef CAS.
-
A. Einstein, Investigations on the theory of the Brownian movement: on the movement of small particles suspended in a stationary liquid demanded by the molecular kinetic theory of heat, Dover Publications, 1956, pp. 1–18 Search PubMed.
-
C. M. A. Brett and A. M. O. Brett, Electrochemistry: Principles, methods, and applications/Christopher M.A. Brett and Ana Maria Oliveira Brett, Oxford University Press, Oxford, 1993 Search PubMed.
-
R. P. Feynman, R. B. Leighton and M. L. Sands, The Feynman lectures on physics, New millennium edn, Basic Books, New York, 2011, p. 2010 Search PubMed.
- G. Peskir, Stochastic Models, 2003, 19, 383–405 CrossRef.
-
J. S. Newman and K. E. Thomas-Alyea, Electrochemical systems, 3rd edn, Wiley, Hoboken, NJ and Chichester, 2004 Search PubMed.
- M. Islam, Phys. Scr., 2004, 70, 120 CrossRef CAS.
- M. D. Haw, J. Phys.: Condens. Matter, 2002, 14, 7769 CrossRef CAS.
-
G. E. Murch, Diffusion Kinetics in Solids, John Wiley & Sons, Ltd, 2001, ch. 3, pp. 171–238 Search PubMed.
- K. Hayamizu, Y. Aihara, S. Arai and C. G. Martinez, J. Phys. Chem. B, 1999, 103, 519–524 CrossRef CAS PubMed.
- Y. Aihara, K. Sugimoto, W. S. Price and K. Hayamizu, J. Chem. Phys., 2000, 113, 1981–1991 CrossRef CAS.
- K. Hayamizu and Y. Aihara, Solid State Ionics, 2013, 238, 7–14 CrossRef CAS.
- K. Hayamizu, Y. Aihara and W. S. Price, J. Chem. Phys., 2000, 113, 4785–4793 CrossRef CAS.
- K. Hayamizu, Y. Terada, K. Kataoka, J. Akimoto and T. Haishi, Phys. Chem. Chem. Phys., 2019, 21, 23589–23597 RSC.
- K. Hayamizu, Y. Terada, K. Kataoka and J. Akimoto, J. Chem. Phys., 2019, 150, 194502 CrossRef PubMed.
- K. Hayamizu, Y. Aihara, S. Arai and W. S. Price, Solid State Ionics, 1998, 107, 1–12 CrossRef CAS.
- H. Tokuda, K. Ishii, M. A. B. H. Susan, S. Tsuzuki, K. Hayamizu and M. Watanabe, J. Phys. Chem. B, 2006, 110, 2833–2839 CrossRef CAS PubMed.
- A. Noda, K. Hayamizu and M. Watanabe, J. Phys. Chem. B, 2001, 105, 4603–4610 CrossRef CAS.
- S. Yu, R. D. Schmidt, R. Garcia-Mendez, E. Herbert, N. J. Dudney, J. B. Wolfenstine, J. Sakamoto and D. J. Siegel, Chem. Mater., 2016, 28, 197–206 CrossRef CAS.
- A. Sakuda, A. Hayashi, Y. Takigawa, K. Higashi and M. Tatsumisago, J. Ceram. Soc. Jpn., 2013, 121, 946–949 CrossRef CAS.
- J. E. Ni, E. D. Case, J. S. Sakamoto, E. Rangasamy and J. B. Wolfenstine, J. Mater. Sci., 2012, 47, 7978–7985 CrossRef CAS.
- J. Wolfenstine, H. Jo, Y.-H. Cho, I. N. David, P. Askeland, E. D. Case, H. Kim, H. Choe and J. Sakamoto, Mater. Lett., 2013, 96, 117–120 CrossRef CAS.
- F. P. McGrogan, T. Swamy, S. R. Bishop, E. Eggleton, L. Porz, X. Chen, Y.-M. Chiang and K. J. van Vliet, Adv. Energy Mater., 2017, 7, 1602011 CrossRef.
- J. A. Lewis, F. J. Q. Cortes, M. G. Boebinger, J. Tippens, T. S. Marchese, N. Kondekar, X. Liu, M. Chi and M. T. McDowell, ACS Energy Lett., 2019, 4, 591–599 CrossRef CAS.
-
G. A. Gogotsi, in Encyclopedia of Thermal Stresses, ed. R. B. Hetnarski, Springer Netherlands, Dordrecht, 2014, pp. 497–505 Search PubMed.
- S. Korte and W. J. Clegg, Scr. Mater., 2009, 60, 807–810 CrossRef CAS.
-
J. D. Ferry, Viscoelastic properties of polymers, 3rd edn, Wiley, New York and Chichester, 1980 Search PubMed.
- H. Watanabe, Prog. Polym. Sci., 1999, 24, 1253–1403 CrossRef CAS.
- H. K. Nguyen, M. Ito, S. Fujinami and K. Nakajima, Macromolecules, 2014, 47, 7971–7977 CrossRef CAS.
- A. Masias, N. Felten, R. Garcia-Mendez, J. Wolfenstine and J. Sakamoto, J. Mater. Sci., 2019, 54, 2585–2600 CrossRef CAS.
-
J. Vincent, Structural biomaterials, Princeton University Press, 2012, pp. 1–28 Search PubMed.
- Z. Wang, J. Z. Lee, H. L. Xin, L. Han, N. Grillon, D. Guy-Bouyssou, E. Bouyssou, M. Proust and Y. S. Meng, J. Power Sources, 2016, 324, 342–348 CrossRef CAS.
- R. Chen, A. M. Nolan, J. Lu, J. Wang, X. Yu, Y. Mo, L. Chen, X. Huang and H. Li, Joule, 2020, 4, 812–821 CrossRef CAS.
- Z. Wang, D. Santhanagopalan, W. Zhang, F. Wang, H. L. Xin, K. He, J. Li, N. Dudney and Y. S. Meng, Nano Lett., 2016, 16, 3760–3767 CrossRef CAS PubMed.
- M.-C. Pang, K. Yang, R. Brugge, T. Zhang, X. Liu, F. Pan, S. Yang, A. Aguadero, B. Wu and M. Marinescu,
et al.
, Mater. Today, 2021 DOI:10.1016/j.mattod.2021.02.011.
- S. Kalnaus, A. S. Westover, M. Kornbluth, E. Herbert and N. J. Dudney, J. Mater. Res., 2021, 1–10 Search PubMed.
- J. B. Bates, N. J. Dudney, B. Neudecker, A. Ueda and C. D. Evans, Solid State Ionics, 2000, 135, 33–45 CrossRef CAS.
- H. Mehrer, A. W. Imre and E. Tanguep-Nijokep, J. Phys.: Conf. Ser., 2008, 106, 012001 CrossRef.
-
H. Mehrer, Diffusion in solids: fundamentals, methods, materials, diffusion-controlled processes, Springer Science & Business Media, 2007, vol. 155 Search PubMed.
- G. Fan, H. Choo and P. Liaw, J. Non-Cryst. Solids, 2007, 353, 102–107 CrossRef CAS.
- E. T. Njiokep and H. Mehrer, Solid State Ionics, 2006, 177, 2839–2844 CrossRef.
- M. D. Demetriou, M. E. Launey, G. Garrett, J. P. Schramm, D. C. Hofmann, W. L. Johnson and R. O. Ritchie, Nat. Mater., 2011, 10, 123–128 CrossRef CAS PubMed.
- X. Xi, D. Zhao, M. Pan, W. Wang, Y. Wu and J. Lewandowski, Phys. Rev. Lett., 2005, 94, 125510 CrossRef CAS PubMed.
-
R. S. Lakes, Viscoelastic solids: Viscoelastic properties of materials, CRC Press, Boca Raton, Fla. and London, 1999 Search PubMed.
-
F. K. Fuss, in Nonlinear approaches in engineering applications, ed. L. Dai and R. N. Jazar, Springer, Cham, 2014, pp. 137–157 Search PubMed.
- J.-J. Chang, Y.-Y. Li, X.-F. Zeng, H.-Y. Zhong, T.-L. Wan and C. Lu, Materials, 2019, 12, 1–15 Search PubMed.
- C. G. Robertson and M. Rackaitis, Macromolecules, 2011, 44, 1177–1181 CrossRef CAS.
- J. D. Ferry, Macromolecules, 1991, 24, 5237–5245 CrossRef CAS.
- F. Han, A. S. Westover, J. Yue, X. Fan, F. Wang, M. Chi, D. N. Leonard, N. J. Dudney, H. Wang and C. Wang, Nat. Energy, 2019, 4, 187–196 CrossRef CAS.
-
M. Barsoum, Fundamentals of ceramics, CRC press, 2019 Search PubMed.
- The American Ceramic Society, Structure and Properties of Ceramics, available at https://ceramics.org/about/what-are-engineered-ceramics-and-glass/structure-and-properties-of-ceramics (2021/04/02).
Footnote |
| † For a compression test, one should note that the true stress should be smaller than the engineering stress due to a larger instantaneous cross-sectional area during compression. |
|
| This journal is © the Owner Societies 2021 |
 Open Access Article
 ,
Monica
Marinescu
,
Huizhi
Wang
and
Gregory
Offer
,
Monica
Marinescu
,
Huizhi
Wang
and
Gregory
Offer
 *
*

 denotes the mean displacement over all possible routes in time t. Eqn (2) was also derived by Smoluchowski and therefore, this equation is known as Einstein–Smoluchowski relation.32 The relationship between
  and t was later verified experimentally by Perrin, who measured the sedimentation equilibrium in a colloidal suspension.32,33 Experiments were performed with different colloidal materials and solvent viscosities under various external conditions to demonstrate the kinetic theory of fluids.33


![[F with combining right harpoon above (vector)]](https://www.rsc.org/images/entities/i_char_0046_20d1.gif) :27
:27![[F with combining right harpoon above (vector)]](https://www.rsc.org/images/entities/i_char_0046_20d1.gif) = 6πηvrv,
= 6πηvrv,


![[F with combining right harpoon above (vector)]](https://www.rsc.org/images/entities/i_char_0046_20d1.gif)
![[thin space (1/6-em)]](https://www.rsc.org/images/entities/char_2009.gif) [(kg m) s−2]. In this case, the drift velocity becomes29
[(kg m) s−2]. In this case, the drift velocity becomes29![[F with combining right harpoon above (vector)]](https://www.rsc.org/images/entities/i_char_0046_20d1.gif) ,
,


![[thin space (1/6-em)]](https://www.rsc.org/images/entities/char_2009.gif) K (see Fig. 8). In their works, the charge diffusion coefficient or sometimes also denoted as the conductivity diffusion coefficient, Dσ is the diffusion coefficient determined from Nernst–Einstein's relation, where the particles were assumed to be non-interacting (eqn (3)). They obtained the tracer diffusion coefficient of radioisotopes 22Na and 45Ca with the radiotracer technique.63 By comparing the conductivity diffusion coefficient to the tracer diffusion coefficient of 22Na and 45Ca radioisotopes, they concluded that the ionic conductivity of a soda-lime glass is caused predominantly by the mobility of Na ions.63 They also determined the viscosity diffusion coefficient by Stokes–Einstein's relation (eqn (11)), which corresponded to the mobility of the network-forming units.63 Nevertheless, as discussed in Section 3.2, operating temperatures ranging from 450 K to 1600 K are not feasible for inorganic solid-state Li–metal batteries. Therefore, future works are required to quantify the viscoelastic behaviour of glassy solid electrolytes and the interplay with their ionic conduction mechanisms at ambient temperatures.
K (see Fig. 8). In their works, the charge diffusion coefficient or sometimes also denoted as the conductivity diffusion coefficient, Dσ is the diffusion coefficient determined from Nernst–Einstein's relation, where the particles were assumed to be non-interacting (eqn (3)). They obtained the tracer diffusion coefficient of radioisotopes 22Na and 45Ca with the radiotracer technique.63 By comparing the conductivity diffusion coefficient to the tracer diffusion coefficient of 22Na and 45Ca radioisotopes, they concluded that the ionic conductivity of a soda-lime glass is caused predominantly by the mobility of Na ions.63 They also determined the viscosity diffusion coefficient by Stokes–Einstein's relation (eqn (11)), which corresponded to the mobility of the network-forming units.63 Nevertheless, as discussed in Section 3.2, operating temperatures ranging from 450 K to 1600 K are not feasible for inorganic solid-state Li–metal batteries. Therefore, future works are required to quantify the viscoelastic behaviour of glassy solid electrolytes and the interplay with their ionic conduction mechanisms at ambient temperatures.
 and
and  and viscosity diffusion coefficient (Dη) for a soda-lime silicate glass. Reproduced from ref. 63, Copyright (2008), with permission from IOP Publishing.
![[thin space (1/6-em)]](https://www.rsc.org/images/entities/char_2009.gif) MPa m1/2) and were shown to exhibit brittle cracks.67,68
MPa m1/2) and were shown to exhibit brittle cracks.67,68
![[thin space (1/6-em)]](https://www.rsc.org/images/entities/char_2009.gif) δ, is then the ratio between the loss modulus E′′ [Pa] and the storage modulus E′ [Pa]:70,71
δ, is then the ratio between the loss modulus E′′ [Pa] and the storage modulus E′ [Pa]:70,71


