 Open Access Article
Novel application of X-ray fluorescence microscopy (XFM) for the non-destructive micro-elemental analysis of natural mineral pigments on Aboriginal Australian objects†
Rachel S.
Popelka-Filcoff
*a,
Claire E.
Lenehan
a,
Enzo
Lombi
b,
Erica
Donner
b,
Daryl L.
Howard
 c,
Martin D.
de Jonge
c,
David
Paterson
c,
Keryn
Walshe
d and
Allan
Pring
ad
c,
Martin D.
de Jonge
c,
David
Paterson
c,
Keryn
Walshe
d and
Allan
Pring
ad
aSchool of Chemical and Physical Sciences, Flinders University, Adelaide, SA, Australia. E-mail: rachel.popelkafilcoff@flinders.edu.au
bCentre for Environmental Risk Assessment and Remediation, University of South Australia, Adelaide, SA, Australia
cAustralian Synchrotron, Clayton, VIC, Australia
dSouth Australian Museum, Adelaide, SA, Australia
First published on 14th March 2016
Abstract
This manuscript presents the first non-destructive synchrotron micro-X-ray fluorescence study of natural mineral pigments on Aboriginal Australian objects. Our results demonstrate the advantage of XFM (X-ray fluorescence microscopy) of Aboriginal Australian objects for optimum sensitivity, elemental analysis, micron-resolution mapping of pigment areas and the method also has the advantage of being non-destructive to the cultural heritage objects. Estimates of pigment thickness can be calculated. In addition, based on the elemental maps of the pigments, further conclusions can be drawn on the composition and mixtures and uses of natural mineral pigments and whether the objects were made using traditional or modern methods and materials. This manuscript highlights the results of this first application of XFM to investigate complex mineral pigments used on Aboriginal Australian objects.
Introduction
Characterization of natural pigments is essential for understanding the composition, technology and context of Indigenous Australian cultural expression. Naturally sourced mineral pigments are universal and significant in Aboriginal Australian culture, and are applied to a variety of natural substrates, such as wood and bark, to create culturally significant objects such as boomerangs and bark paintings.Pigments
Ochre pigments are mixtures of natural minerals including iron oxides such as hematite [Fe2O3] and goethite [α-FeO(OH)] as well as associated clays and aluminosilicates such as kaolinite [Al2Si2O5(OH)4].1 Some minerals previously documented in Indigenous Australian pigments include mostly pure as well as mixtures of hematite [Fe2O3] and goethite [α-FeO(OH)], well and poorly-crystallised kaolinite [Al2Si2O5(OH)4], phyllosilicate mineral Fe chlorite [(Mg, Fe)5Al(Si3Al)O10(OH)8] Fe siderite [FeCO3], carbon black and manganese dioxide [MnO2].1,2 Ochre and several other natural mineral pigments play a significant cultural role in Indigenous Australia from the beginnings of cultural expression to today. Natural pigments are used in many diverse cultural uses from application to the body, to objects (such as boomerangs, shields, rock art and bark paintings) and in mortuary contexts.1,3–10 The diversity of materials and uses demonstrate the cultural importance of natural pigments to Indigenous Australia as well as in other Indigenous cultures worldwide. Historically, the pigments are not industrially processed, therefore the pigments applied to objects and rock art inherently represent the natural variation and potential heterogeneity in mineral and elemental distribution and particle shapes and sizes of the original mineral source. Several recent studies have investigated characterisation of Australian ochre towards understanding the elemental composition of the original sources. These studies examined the use of chemical analysis towards answering questions in reconstructing ancient exchange routes, provenance, and analysis towards conservation and authentication studies.3,8,11–14 Many of these studies used bulk methods such as NAA, PIXE and ICP-MS, however in Popelka-Filcoff et al. demonstrated the first systematic characterization of 165 Australian Indigenous ochre samples from known locations using the XFM beamline at the Australian Synchrotron. This study quantified the natural complexity and variability an information on spatial variability within and between sources on the micron scale, informing cultural exchange and technology.10 To date, however, this level of micro-characterisation has not been demonstrated on intact cultural heritage objects. Micro-characterisation of Indigenous pigments provide data towards answering cultural questions such as cultural exchange of materials, technologies, provenance and conservation.Many objects in museum collections, including those studied here from the South Australian Museum, were made in the early to mid-twentieth century and acquired into the Museum collections around the same time. Various objects were made using traditional methods and materials, however many objects from this time were also influenced by modern methods and pigments. Visually, or without destructive analysis, it can be nearly impossible to determine if the pigments used were from cultural ochre or natural pigment mines, or from commercially produced sources.
Analysis of pigments
Mixtures and varying methods of application (and therefore thickness) of pigments present a challenging analytical problem, especially for the non-destructive elemental analysis of mixed pigments on objects with a variety of shapes and sizes. This natural complexity provides challenges for characterisation and quantification of mineral pigments, especially with the additional requirement for non-destructive analysis in situ. Analyses of these complex natural materials require sensitive, high-resolution methods. For objects housed in cultural institutions and communities, destructive sampling of large object areas is not possible and would be disfiguring. While techniques such as neutron activation analysis (NAA) have demonstrated success in characterization of ochre sources, NAA is a bulk measurement technique that does not provide information on individual components of the sample.15 However, recent studies have characterised Aboriginal Australian ochre pigments by neutron activation analysis (NAA), inductively coupled plasma mass spectrometry (ICP-MS), particle induced X-ray emission (PIXE) and X-ray diffraction (XRD) towards understanding composition and cultural exchange of pigment material.1,3,8,11–14,16–18Synchrotron micro-XRF analysis, or X-ray fluorescence microscopy (XFM), offers insight into the complex elemental composition, and therefore inferred mineralogy, of these natural materials. XFM as performed at the Australian Synchrotron (AS) with the Maia detector provides laterally resolved analysis, revealing not just elemental composition but also the presence and characterization of individual particles and components, facilitating the production of microscale maps of elemental composition over extended length (i.e. centimeter) scales. This is in contrast to scanning electron microscopy (SEM) that can only map on the order of less than approximately 2 cm diameter stub.19 In addition, XFM can be performed in environmental conditions or an environment with controlled humidity and temperature to protect cultural heritage items, which is not available in the vacuum conditions of a SEM. While SEM-EDX (scanning electron microscopy with energy-dispersive X-ray analysis) can produce elemental maps, they are on the order of 100 μm and not of the high definition produced by XFM, and SEM requires destructive sampling as the entire object cannot be placed in the vacuum chamber. While the sensitivity of SEM and XFM are similar levels, the advantage of the spectrum per pixel and the spectral deconvolution and elemental mapping is unparalleled in XFM with the use of analysis software such as GeoPIXE.20 While portable X-ray fluorescence (PXRF) has been used extensively in non-destructive cultural heritage analysis, it does not offer the sensitivity or the high resolution as compared to a synchrotron source. While very common in laboratories worldwide, PXRF offers a spot size of approximately 8 mm and LOD of parts per million (ppm), in contrast to the micron spot size of XFM.
In addition, other analytical methods require 100 mg or more of material removed from the cultural heritage object for analysis, which may be disfiguring to the object, or the amount of sampled pigment is too small to realise appropriate sensitivity, e.g. bulk techniques such as NAA. However, XFM only requires a negligible amount (sub-μg) of sample in most cases, in this case a thin layer (10–100 μm) of pigment applied to the artefact surface.21 Furthermore, XFM has been demonstrated to provide data by non-destructive in-beam methods directly on culturally valuable artefacts with no damaging physical sampling necessary.10,21–26 The X-ray fluorescence microprobe has been demonstrated by the recent analysis of an Arthur Streeton portrait.21 Until recently, the majority of painting analysis studies conducted using techniques such as X-ray analysis and X-ray imaging has been limited to investigating European artworks. In the case of Australia, much of the worldwide literature concerns post-European contact cultural heritage, with fewer studies on Aboriginal Australian works. Therefore, relatively little is understood about the procurement, composition, and mixing of the natural mineral pigments that have been used in Aboriginal Australian objects from the past through to the present. Information on the composition and application of the pigment can elucidate the similarities and differences in cultural practices and use of traditional and modern pigments.
This manuscript highlights the results of this first application of XFM to investigate complex natural mineral pigments used on Aboriginal Australian objects. The analysis of two different Indigenous Australian objects (a boomerang and a bark painting) provides an alternative to traditional destructive testing that provides higher resolution information. The compilation of these data into elemental maps allows further insights into the composition, application and layering of natural pigment on the micron scale, and further cultural interpretation of the objects, as well as expanding the capability of the technique towards complex analytical problems.
Experimental
Sample selection
Objects for analysis were selected in consultation with staff from the Aboriginal Australian Collections at the South Australian Museum and beamline scientists at the AS to ensure that the artifacts could be properly and safely mounted on the sample stage (<50 cm × 50 cm). The two cultural objects chosen had an organic (either wood or bark) substrate with mineral pigments applied in a variety of colors and shape designs to a single, relatively flat surface. These objects were also analyzed by the Hylogger™ instrument, which was also optimized for relatively flat objects.1 (Table 1) The XFM setup at the AS has a resolution of a few microns in the x- and y-direction, therefore deviations on the order of millimeters from the flat surface (z-direction) could potentially have relatively large effect on the quantitative results, as the models used in the GeoPIXE analysis software assumes flat specimens of uniform thickness. However, these cultural heritage materials are made using the contours of the natural plant-based materials, thus precise tolerances for the dimensions of the object and the degree of flatness are not possible. Thus the resulting data is semiquantitative, and can be used to indicate relative concentrations in areas of pigment application.Visually, parts of the Queensland boomerang have discrete areas of pigment treatment in the rectangular and “X” design that appear to be solid applications of relatively thick pigments, whereas in the cross-hatched areas of the bark painting, layers and multi-layer applications are apparent, especially in the area of the reptile's body. In addition, one goal of the project was to investigate the possible layering or mixing of pigments on the objects, which is not well quantified in traditional Australian objects. The boomerang had been analyzed earlier for mineral composition by the near-infrared Hylogger™ technique, therefore the same object was chosen for the XFM analysis in order to facilitate comparison with a complementary data set.1
Sample preparation
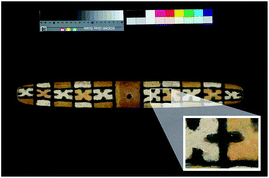
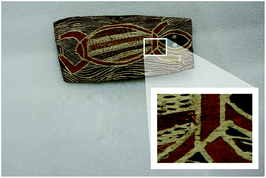
The objects were analyzed directly in the X-ray beam with no additional sample preparation, focusing on the ochre-treated areas of the objects. This set up maximized the versatility of the XFM beamline in combination with the Maia detector. The experiment utilized the Maia detector, which is a 384-element array of 1 × 1 mm Si detectors, oriented axially in backscatter geometry (180° to beam)20,21 which provides continuous “on the fly” scanning, resulting in short per pixel transit time (approximately 2.4 milliseconds per 10 micron pixel).6 In the beamline the operating distance of the detector is approximately 10 mm, providing a large solid angle. The instrumental setup, especially with the longer working distance, is ideal for cultural heritage applications.20,21 As a result, the detector can record megapixel images of the sample with full XRF spectra collected at each pixel allowing high-resolution mapping (micron spatial resolution).A rectangular area of approximately 5 × 3 cm was identified for analysis on each object. This area was chosen to encompass several color areas and types of pigment application on the object either applied as solid areas to the substrate or as layers over other areas of pigment. The selected area provided a smaller area that could be examined in higher resolution given the time constraints of the experiment, rather than the entire object at lower resolution. Dwell times for the bark painting and the boomerang were 2.4 milliseconds and 2.6 milliseconds, respectively (Fig. 1).
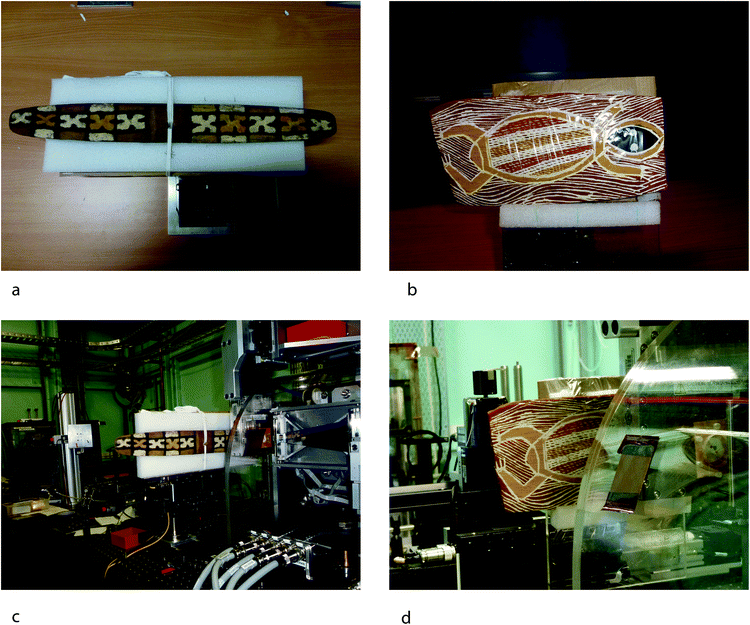 | ||
| Fig. 1 Objects mounted to the XFM stage (a and b) demonstrating mounting procedures. Objects on the beamline in preparation for XFM analysis (c and d). | ||
Data analysis was accomplished using the GeoPIXE software package.20,21 A full XRF spectrum is collected at each pixel and GeoPIXE is used to deconvolute these individual spectra into elemental concentration maps. These maps can then be used to indicate relative concentrations of elements in single or multiple element false color maps. For each image generated, the images were flattened to the Compton image and displayed using the square root intensity scale to aid visualization of the high dynamic range images. The variability of the pigment thickness and shape of the substrate prevented accurate quantitative elemental data, however the semi-quantitative results were sufficient to compare areas of interest.
Results and discussion
XRF spectra
One of the strengths of the XFM and Maia combination is the ability to produce elemental maps and distributions as discussed above. However, each individual point on these maps represents a complete X-ray fluorescence spectrum, which can also be analysed individually or as a summed region of spectra. Analysis of X-ray spectra of these areas can be used to characterise of particular areas of interest. In Fig. 2 and 3, examples of this are demonstrated with the selection of 4 distinct coloured areas from each object. These spectra indicate the relative changes in concentration (indicated by counts on the y-axis) for each energy (keV on the x-axis). The Maia 384A detector has an energy resolution of around 375 eV as compared to 140 eV in a current handheld XRF with a silicon drift detector.21,31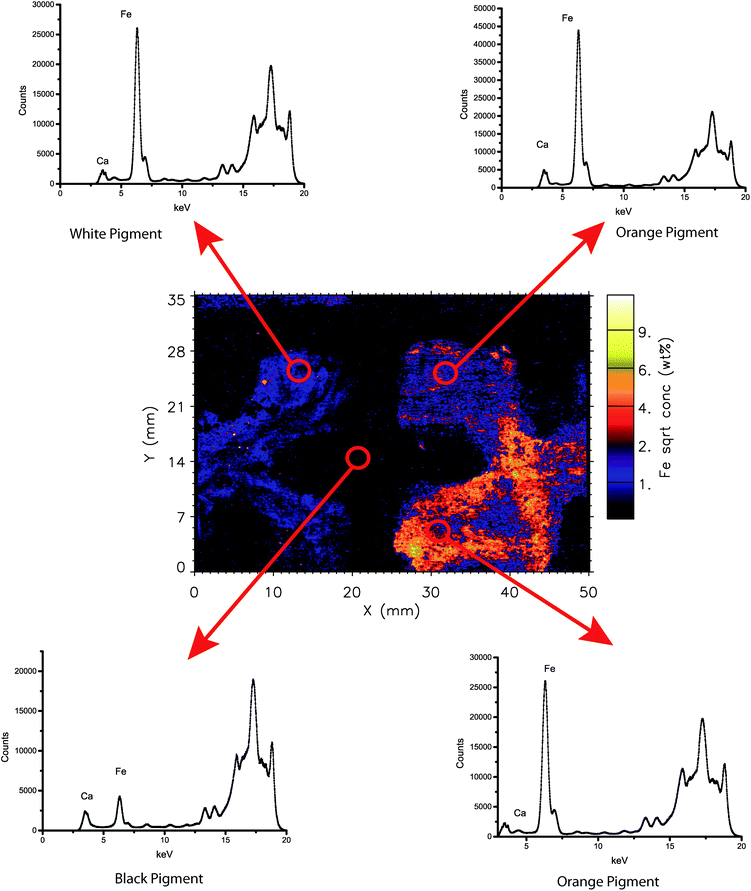 | ||
| Fig. 2 Summed X-ray spectra from selected areas of the boomerang analysed in this study. Summed areas are approximately 4 mm diameter circles. | ||
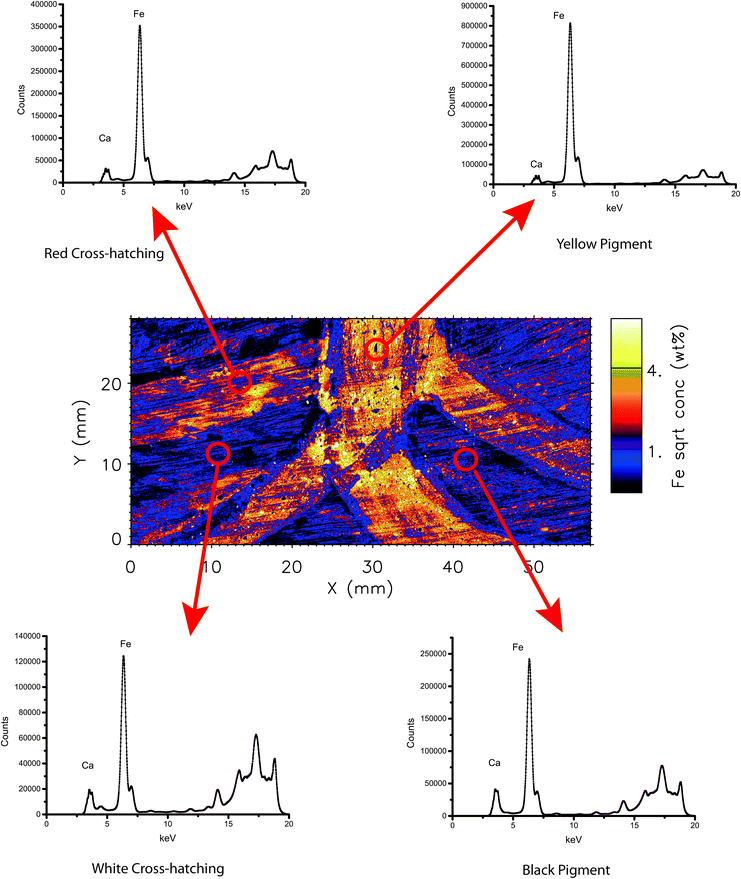 | ||
| Fig. 3 Summed X-ray spectra from selected areas of the bark painting analysed in this study. Summed areas are approximately 4 mm diameter circles. | ||
Boomerang
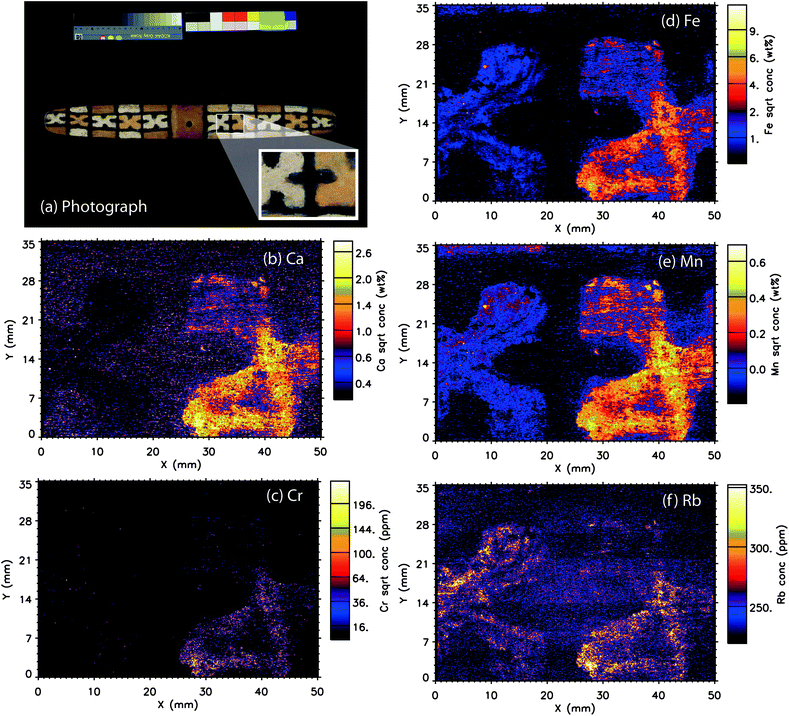
A comparison of the photographic image and the single elemental maps is shown in Fig. 4. Elemental maps are presented for Ca, Cr, Fe, Mn and Rb, which as observed in the X-ray spectral data, provided the majority of the signal. The maps for As, Cu, Ga, Pb, Sc, Se, Sr, Ti, V and Zn were not diagnostic for this object.Fe
The iron elemental intensity map (Fig. 4d) shows a large contrast between the orange pigmented “X” and the white pigmented “X” and the surrounding pigment background areas in terms of Fe concentration. The orange pigment has notably higher levels of Fe, although the white “X” also has defined areas of Fe concentration that align with the white-pigmented areas. These elemental results support the mineralogical analyses of this artefact by the Hylogger™, which identified the orange pigment as primarily goethite [FeO(OH)] with secondary kaolinite (Al2Si2O5(OH)4). Similarly, the white pigment was identified by the Hylogger™ technique as primarily kaolinite and secondary goethite. Although the kaolinite pigment appears visually white, both methods identify low levels of iron-based minerals within these pigments. These data indicate the use of mineral pigments with naturally occurring Fe minerals, rather than a purified commercial pigment.The strength of the XFM technique is the identification of areas on the micron scale of relatively lower or higher levels of Fe in the pigment applications. For instance, the upper left quadrant of the orange “X” has the highest relative levels of Fe on this object (false colour orange to white). Equally, the lower concentration areas (false colour blue) indicate the thickness of pigment application rather than Fe concentration in the particular area. Dark blue to black areas indicate very low (less than percent levels) of Fe in the pigments.
The thickness of the painted “X” designs with the XFM data has been estimated. Analysis of the boomerang has revealed bromine with a concentration of approximately 80 ppm, which is assumed to originate from the wood.27 The thickness can be estimated by considering the “X” (primarily goethite, d = 4.28 g cm−3) both as a filter of the incident beam and as a filter of the Br fluorescence emitted from the wood, and comparing it to Br fluorescence emitted from an area having negligible absorption. Here we find the orange “X” attenuates the Br counts (Br Kα = 11.9 keV) by a factor of three relative to an adjacent area free of highly attenuating elements next to the “X”. Using standard X-ray optical constants for the filtering of the 18.5 keV incident beam and emitted Br fluorescence at 11.9 keV we estimate a pure goethite equivalent thickness of 30 μm for the orange “X”.28 (ESI, Fig. 1†) Similarly for the white “X” we estimate 10 μm pure goethite equivalent thicknesses. The actual paint layer will probably be thicker than estimated because the paint layer is unlikely pure goethite, and it will also have a low Z elemental binder in its composition.
Mn
A false colour map of Mn produces a similar distribution of elemental concentrations across the same analysed area (Fig. 4e). Individual particles are also high concentration Fe and Mn indicating a correlation of these elements in both the orange and white pigments, but especially in the orange pigmented area. As Fe and Mn have the same oxidation states and similar ionic radii and, they would be expected to readily substitute in for each other in naturally occurring formations.Ca
Similarly to the Fe and Mn elemental distributions, the higher concentrations of Ca are in the orange-pigmented area of the boomerang. (Fig. 4b) The white “X” contains very little Ca, suggesting that the composition is likely kaolinite (Al2Si2O5(OH)4) or another related aluminosilicate as opposed to a Ca-based mineral such as calcite (CaCO3), or gypsum (CaSO4·2H2O). The lowest atomic number that could be investigated under these conditions using the Maia detector was Ca, and there are no data available for aluminum or silicon distributions. The elemental data do however support the previous Hylogger™ analysis of the artefact, as well as ethnographic literature on the use of kaolinite on Indigenous Australian objects, and indicate the use of a traditional mineral pigment.1An even distribution of small areas of varying concentrations of Ca is found throughout the black “background” area of the boomerang. This suggests the possible use of charcoal from wood or plant material, or perhaps burned bone, which also agrees with ethnographic evidence. Another possible black pigment known from ethnographic literature is manganese dioxide (MnO2). The lack of Mn signal in this black area eliminates MnO2 or other modern material as the pigment and instead indicates carbon-based pigment. The near-IR data on this area were inconclusive, as carbon-based pigments are highly IR absorptive, and this pigment application could also be quite thin.1
Rb/Cr
Rb and Cr maps are also presented to demonstrate the differing distributions of elements on the parts per million (rather than percent levels of elements such as Fe, Mn and Ca). (Fig. 4c and f) Similarly to Fe and Mn, Rb appears to be associated with both the orange and yellow “X” patterns and its intensity is related to thickness of pigment application. In contrast, Cr is only associated with the orange “X” design.Bark painting
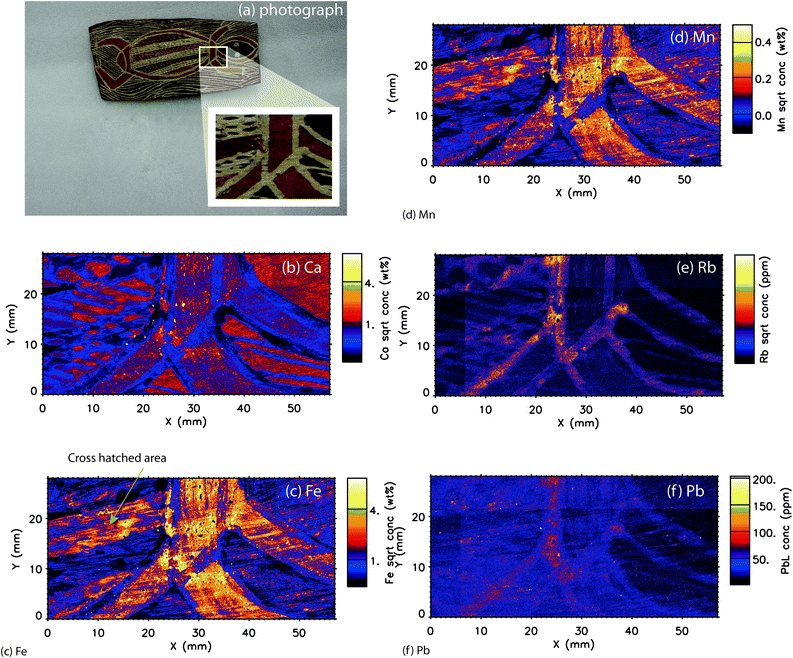
A comparison of the photographic image and the single elemental maps are shown in Fig. 5. Elemental maps are included for Ca, Fe, Mn, Pb, and Rb. Similarly to the boomerang, these elements, which as seen in the X-ray spectral data, provided the majority of the signal. As, Cu, Cr, Ga, Sc, Se, Sr, Ti, V and Zn were not diagnostic for this object.Fe/Mn
Similarly to the boomerang, the elemental map patterns and trends are correlated with Fe and Mn concentrations. (Fig. 5c and d) The yellow-pigmented areas on the neck, arm and border of the body of the reptile contain relatively high concentrations of Fe and Mn. In addition to the broad coverage of the pigments, smaller, higher concentration particles are identified throughout these areas as bright areas of about 10–20 microns that cannot be observed through visual inspection. Conversely, areas that show up as “voids” indicate particles of about the same dimensions that are void of Fe or Mn concentration interspersed through the pigments, and are composed of Ca (see later section) or likely other lighter-Z elements such as Al or Si that are not detectable by XFM. This suggests a mixture of an ochre or ochre/clay mixture for the main pigment, with smaller inclusions of Fe/Mn-rich and Fe/Mn-poor minerals. These data on the micron level provide a more complete characterization of the inherent complexity and heterogeneity of natural mineral pigments than otherwise known from previous studies.In the crosshatched area of the body of the reptile, three main colours are applied in varied patterns. The Fe/Mn elements support the visually based hypothesis that the red and yellow pigments are likely Fe-based ochre pigments, while the white is likely kaolinite. On the relative scale, the red pigments appear to contain less Fe than the yellow pigments, although this may represent a thinner application of pigment rather than an overall lower absolute concentration of Fe. Previous studies indicate the stronger covering power of hematite-based pigments as compared to goethite-based pigments; therefore the overall concentration of Fe may be lower in hematite but with not much change in visual appearance.2
Ca
The Ca elemental map provides one of the clearest distinctions between the different pigment applications on the bark. (Fig. 5b) Larger areas of the Ca-based pigment are spread out across the object, along with smaller areas of higher concentration particles. The relative intensities of Ca between the red and yellow pigments are very similar, indicating a similar level of a Ca-based accessory mineral in each pigment. The white outlines of the figure are nearly devoid of Ca, indicating that similarly to the boomerang, these white areas are likely kaolinite or a related aluminosilicate material rather than a Ca-based mineral. In contrast to the boomerang, the black-treated area of the head of the figure is quite high in Ca (approximately 1–2%) and relatively devoid of Mn (approximately 0.1%). This finding supports that the black areas are likely bone black (charred bone) due to the higher Ca composition. Some bark paintings were treated with an organic compound such as orchid juice before the application of the earth pigments.29,30 Therefore there may be some trace Ca composition in these materials identified through the XFM analysis.The high resolution of the technique permits a micron resolution view into the application of the pigments and the underlying substrate. In the crosshatched region of the painting, the calcium components of the pigment can be seen to follow the direction of the paint application and the fine grain of the bark can be observed below the pigments. The visualization on the micron scale also allows potential thicker areas of pigment due to the pigment filling in small recesses in the substrate and therefore more signal yield.
Rb/Pb
Rb and Pb are both elements that occur at parts per million concentrations. The discussion of Rb (Fig. 5f) is in more detail in the tri-colour map section below. The Pb elemental map indicates that Pb is associated with pigment application and not the bark.Tri-colour map
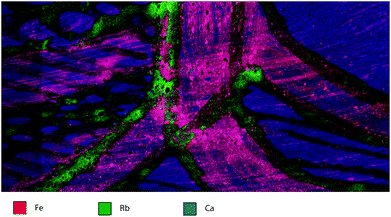
In Fig. 6, visualization of the three elemental areas emphasises the distribution of elements in different parts of the painting. The pink/purple areas of the hematite/goethite pigments identify the Fe concentration as well as some Ca (blue) underneath and in the substrate. In addition, the red and yellow crosshatched areas can be clearly distinguished from the white crosshatched areas based on elemental composition. Although at a relatively low concentration, Rb can be clearly seen in association with the white-pigmented areas. As Rb readily substitutes into minerals containing K, due to the same charge and similar size, these low levels of Rb likely indicate the presence of minerals such as orthoclase [KAlSi3O8] or muscovite [KAl2(AlSi3O10)(F, OH)2] Rb may be a proxy for related elements not analysed in this study such as K. The overall concentrations of the three elements are: Fe- 13%, Rb- 240 ppm, and Ca- 7%. The tri-colour map also demonstrates the inherent inhomogeneity of natural pigments on the bark painting. The particles are not a uniform shape or elemental distribution, whereas commercial pigments would be homogenised and mixed to obtain a close particle distribution. In addition, the variability of the natural pigments could also indicate purposeful mixing of natural pigments to obtain particular visual characteristics or cultural meaning.Spectral image artefacts
While the Maia detector coupled with the GeoPIXE software offers unprecedented insights into the pigment application on the Australian objects, spectral artefacts from the analysis were also observed. The most prominent of these is a straight line running through the top fifth of the image from the bark painting and appearance of slight enhancement. These results are not from the object itself, rather from an X-ray beam injection. It should be noted that these data were collected with the storage ring operating in decay mode and not in top up mode (which maintain a nearly constant beam intensity). In addition, the vertical image artefact is likely from the sample mount behind the object.As mentioned earlier, the objects have natural shape variability. Therefore inherent curvature of the bark painting may display enhanced or decreased intensity depending on the proximity to the Maia detector (closer or further away) according to the inverse square law. Therefore imagery in the false colour maps and concentrations represented may be affected by a small degree depending if the object is curving towards or away from the detector. The flattening to the Compton image assists in mitigating these changes relative to the surface of the object and more effectively “flattening” any curvature in the elemental map.
Semi-quantitative elemental concentrations
The false colour maps produced by GeoPIXE are generated based on the maximum and minimum concentrations of the particular element (or three elements, if a tri-colour plot); therefore the white/yellow areas of one object may be a different maximum concentration as compared to another object. In the case of the objects analysed in this study, iron was the element found in the highest concentration, reported up to about 10 weight percent. Values for the other elements such as Ca, Cr, Fe, Mn, Rb and Zn were also calculated to the ppm or sub-ppm levels and are indicated on the scale bars for each element in the figures.These concentrations are calculated based on mathematical spectral modeling of the X-ray data (fundamental parameter calculations from GeoPIXE based on the Maia detector response compared to those from thin-film elemental standards).20 The variability of the flatness in the z-direction of the object can also introduce variability in the calculation, It is known from previous studies by neutron activation analysis that the concentration of Fe in ochre pigments can range from 1 to 50–60% weight percent, depending on the composition of the major mineral components hematite and goethite and related iron oxide minerals, and the mixture with other accessory minerals.13,15,32 The large discrepancy between the NAA and the XFM values for the Fe pigments as well as the semi-quantitative measurement methods suggest that the XFM results should be used as relative values for the elemental mapping purposes rather than as a quantitative composition of the elements in the mineral pigments. Assumptions about the sample such as sample thickness, average matrix composition, and density are used as input to GeoPIXE. In addition, a uniform thickness and constant distance from the sample to the detector is assumed, which is not the case with these three-dimensional cultural heritage materials.
Conclusions
This micron-resolution X-ray fluorescence study demonstrates the first successful application of synchrotron elemental mapping and characterization of mineral pigments on Aboriginal Australian objects. In addition to providing high-resolution maps of pigment application, this work establishes the protocol for nondestructive analysis of traditional Aboriginal Australian objects directly in a beamline, therefore allowing new directions in the compositional and cultural information provided by this method. The elemental composition provides insights into the majority composition of the pigments as well as identifying mixtures of pigment areas and pigment particles that are not visually apparent. Elemental maps of the relative elemental distribution provide insight into the areas of application of pigments, layering of pigments and application of pigments without physically removing samples of the pigments. XFM also allows non-destructive identification of natural mineral pigments versus commercially made or modern pigments, which informs the cultural tradition of the object. This technique requires the transport and handling of an object to a synchrotron facility but the use of a high sensitivity X-ray fluorescence detector such as the Maia-384 allows the radiation dose to the object to be as low as possible and yet returns amounts of data of orders of magnitude greater than other traditional X-ray methods. The object itself can then be returned to the museum collection unharmed, but with further insight into the study and composition of the mineral pigments including technology, cultural exchange and conservation.Acknowledgements
We gratefully acknowledge South Australian Museum Board and South Australian Museum Aboriginal Advisory Group for support and permission to access and analyse the collections. We gratefully acknowledge the professional artefact photography by Liz Murphy of Artlab Australia. The project has approval number 4670 from the Social and Behavioural Research Ethics Committee of Flinders University. Funding is gratefully acknowledged from Australian Institute of Nuclear Science and Engineering (AINSE) Research Fellowship (Popelka-Filcoff). Part of this research was undertaken on the XFM beam line at the Australian Synchrotron, Victoria, Australia.Notes and references
- R. S. Popelka-Filcoff, A. Mauger, C. E. Lenehan, K. Walshe and A. Pring, Anal. Methods, 2014, 6, 1309–1316 RSC.
- R. M. Cornell and U. Schewertmann, The Iron Oxides, Wiley-VCH Verlag GmbH & Co., Weinheim, 2003 Search PubMed.
- D. C. Creagh, M. E. Kubik and M. Sterns, Nucl. Instrum. Methods Phys. Res., Sect. A, 2007, 580, 721–724 CrossRef CAS.
- B. David, E. Clayton and A. L. Watchman, Aust. Archaeol., 1993, 36, 56–57 Search PubMed.
- P. Jones, J. Anthropol. Soc. South Australia, 1984, 22, 3–10 Search PubMed.
- P. Jones, Ochre and Rust: Artefacts and Encounters on Australian Frontiers, Wakefield Press, Adelaide, 2007 Search PubMed.
- P. Jones and P. Sutton, Art and Land: Aboriginal Sculptures of The Lake Eyre Region, South Australian Museum and Wakefield Press, Adelaide, Australia, 1986 Search PubMed.
- R. Popelka-Filcoff, C. Lenehan, M. Glascock, J. Bennett, A. Stopic, J. Quinton, A. Pring and K. Walshe, J. Radioanal. Nucl. Chem., 2012, 291, 19–24 CrossRef CAS.
- R. S. Popelka-Filcoff, in Encyclopedia of Global Archaeology, ed. C. Smith, Springer, New York, Editon edn, 2014 Search PubMed.
- R. S. Popelka-Filcoff, C. E. Lenehan, E. Lombi, E. Donner, D. L. Howard, M. D. d. Jonge, D. Paterson, K. Walshe and A. Pring, Anal. Methods, 2015, 7, 7363–7380 RSC.
- R. L. Green and R. J. Watling, J. Forensic Sci., 2007, 52, 851–859 CrossRef CAS PubMed.
- P. Nel, P. A. Lynch, J. S. Laird, H. M. Casey, L. J. Goodall, C. G. Ryan and R. J. Sloggett, Nucl. Instrum. Methods Phys. Res., Sect. A, 2010, 619, 306–310 CrossRef CAS.
- R. S. Popelka-Filcoff, C. Lenehan, K. Walshe, J. W. Bennett, A. Stopic, P. Jones, A. Pring, J. S. Quinton and A. Durham, J. Anthropol. Soc. South Australia, 2012, 35, 81–90 Search PubMed.
- R. Scadding, V. Winton and V. Brown, J. Archaeol. Sci., 2015, 54, 300–312 CrossRef CAS.
- R. S. Popelka-Filcoff, C. E. Lenehan, M. D. Glascock, J. W. Bennett, A. Stopic, J. S. Quinton, A. Pring and K. Walshe, J. Radioanal. Nucl. Chem., 2012, 291, 19–24 CrossRef CAS.
- M. Jercher, A. Pring, P. G. Jones and M. D. Raven, Archaeometry, 1998, 40, 383–401 CrossRef CAS.
- M. A. Smith and B. Fankhauser, An archaeological perspective on the geochemistry of Australian red ochre deposits: Prospects for fingerprinting major sources, Australian Institute of Aboriginal and Torres Strait Islander Studies, Canberra, 1996 Search PubMed.
- M. A. Smith and S. Pell, J. Archaeol. Sci., 1997, 24, 773–778 CrossRef.
- D. Paterson, M. D. de Jonge, D. L. Howard, W. Lewis, J. McKinlay, A. Starritt, M. Kusel, C. G. Ryan, R. Kirkham, G. Moorhead and D. P. Siddons, AIP Conf. Proc., 2011, 1365, 219–222 CrossRef.
- C. G. Ryan, R. Kirkham, R. M. Hough, G. Moorhead, D. P. Siddons, M. D. de Jonge, D. J. Paterson, G. De Geronimo, D. L. Howard and J. S. Cleverley, Nucl. Instrum. Methods Phys. Res., Sect. A, 2009, 619, 37–43 CrossRef.
- D. L. Howard, M. D. de Jonge, D. Lau, D. Hay, M. Varcoe-Cocks, C. G. Ryan, R. Kirkham, G. Moorhead, D. Paterson and D. Thurrowgood, Anal. Chem., 2012, 84, 3278–3286 CrossRef CAS PubMed.
- U. Bergmann, P. L. Manning and R. A. Wogelius, in Annual Review of Analytical Chemistry, ed. R. G. Cooks and E. S. Yeung, Annual Reviews, Palo Alto, Editon edn, 2012, vol. 5, pp. 361–389 Search PubMed.
- L. Bertrand, L. Robinet, M. Thoury, K. Janssens, S. Cohen and S. Schöder, Appl. Phys. A, 2012, 106, 377–396 CrossRef CAS.
- K. Janssens, J. Dik, M. Cotte and J. Susini, Acc. Chem. Res., 2010, 43, 814–825 CrossRef CAS PubMed.
- L. Monico, G. Van der Snickt, K. Janssens, W. De Nolf, C. Miliani, J. Dik, M. Radepont, E. Hendriks, M. Geldof and M. Cotte, Anal. Chem., 2011, 83, 1224–1231 CrossRef CAS PubMed.
- M. Schreiner, B. Fruhmann, D. Jembrih-Simburger and R. Linke, Powder Diffr., 2004, 19, 3–11 CrossRef CAS.
- National Research Council, Mineral Tolerance of Animals: Second Revised Edition, National Academies Press, Washington D.C., 2005 Search PubMed.
- B. L. Henke, E. M. Gullikson and J. C. Davis, At. Data Nucl. Data Tables, 1993, 54, 181–342 CrossRef CAS.
- T. Reeves, R. S. Popelka-Filcoff and C. E. Lenehan, Anal. Chim. Acta, 2013, 803, 194–203 CrossRef CAS PubMed.
- J. M. Ellersdorfer, R. Sloggett and W. Wanambi, AICCM Bull., 2012, 33, 30–40 CrossRef.
- L. Monico, K. Janssens, M. Alfeld, M. Cotte, F. Vanmeert, C. G. Ryan, G. Falkenberg, D. L. Howard, B. G. Brunetti and C. Miliani, J. Anal. At. Spectrom., 2015, 30, 613–626 RSC.
- R. S. Popelka-Filcoff, J. D. Robertson, M. D. Glascock and C. Descantes, J. Radioanal. Nucl. Chem., 2007, 272, 17–27 CrossRef CAS.
Footnote |
| † Electronic supplementary information (ESI) available: Fig. 1: Br elemental map of boomerang. See DOI: 10.1039/c5an02065d |
| This journal is © The Royal Society of Chemistry 2016 |

